If you consider it fun to find and fix SQL Server problems then I can say without fear of contradiction that this article is going to come at you in a clown suit.
I always feel better at the end of the day if I’ve been able to isolate a problem and offer a fix. Being a SQL Server DBA, overseeing terabytes of critical business data, can be both highly stressful and highly rewarding. Frightening? Yes, like a horror movie with suspect code lurking in every shadow. Fulfilling? Absolutely, when you discover that you are only one temp table or sub-query away from being the day’s hero or heroine.
This article is all about sleuthing in SQL Server, peeling back layer after layer of data until you’ve uncovered the bare metal of the problem. It can be both fun and painstaking. Words like “Deadlock” and “Victim” are common, so we must tread with care through this twilight world. And, if worse comes to worse, we may have to “Kill” something. These murderous tendencies in a DBA make many, mainly developers, fearful to approach us. They creep up to our cubicle and tempt us with their feigned courtesy; “Can you please kill me?” they ask expectantly.
“Absolutely” is our reply.
System tables versus DMVs
Before I start troubleshooting, it is important to note that the steps that I take as a DBA, at this point in my career, are ones that allow for querying across multiple versions of SQL Server: 2000, 2005 and 2008. While I certainly can appreciate the utility of the Dynamic Management Views (DMVs) in SQL 2005 and 2008, there are many companies in the real world that still use SQL 2000. As much as I would love to say that all of the servers that I manage are SQL 2005, that is just not the case. The reason that companies may be slow to upgrade are many-fold, although cost and third party application support are the two primary reasons.
However, the system tables that I use here will be deprecated in a few years, and I surely will as well. For this reason, I would strongly recommend that anyone who works primarily with SQL Server 2005 and higher should use the DMVs. With slight modification, the queries I present here can utilize DMVs in lieu of system tables or system stored procedures.
For additional information on mapping Distributed Management Views to system tables in 2000, 2005 and 2008, please see Books Online topic “Mapping System Tables to System Views.”
Tracking down database performance issues
You are a DBA sitting at your cubicle, or if you are fortunate, your corner office with wrap-around tinted windows overlooking a flowing brook with squirrels and hibiscus, the rustling of nothing special blowing through your perfectly set A/C vent … OK, your cubicle … and your phone rings. It is from the Help Desk and they are asking you to take a look at application Z, because User X called and said Department Y’s screens are all (W)hite and they are “frozen”, presumably not because of the efficient A/C vent.
One of the users has received a timeout issue related to S.Q.L., which is why you are being called. I do not know about you, but when you have more than 100 applications that tie to the SQL Servers in your infrastructure, you do not always know what server/database combination are linked from the frontend to the backend. So you have to do some upfront interrogation:
“What SQL Server are they connecting to?” you ask.
“I am not really sure, let me find out,” Help Desk says. Pause. “They do not know what that is.”
“OK, what is the application?”
“Oh, um, it is Accounts_Receivable_Generation1.4.”
“That is server ‘G’ you say confidently.” Some DBA, long before you arrived, decided it would be fun to name all servers on letters of the alphabet, one letter at a time. “G” in this case is, of course, the intuitive name for where the A.R.G application must reside because it is an accounts receivable application and “G” stands for “Gold”, from the DBA’s favorite online game. After jotting down a note to change that server name in the next maintenance weekend, you tell the Help Desk that you will look into the matter and get right back with them. You are on.
What follows is an example of how I track down and resolve such issues, often misdiagnosed as “database performance” issues.
Using sp_who2
The first troubleshooting tool in every DBA’s tackle box is the tried-and-true stored procedure, sp_who2. Granted there is Activity Monitor, which is also quite handy, but I have found that there are two things wrong with Activity Monitor. Firstly, when the server is heavily burdened with locks or temporary tables, Activity Monitor often cannot be launched, and you generally receive an error message to this effect. Secondly, Activity Monitor for SQL Server 2008 is radically different and, in my opinion, too difficult to maneuver when trying to home in on a problem as quickly as possible. That is primarily the reason I am compelled to run both 2005 and 2008 versions of the client tools.
Sp_who2, on the other hand, always works and the results are generally instantaneous. It displays, among many other things, any blocking on the SQL Server instance on which the problem has been reported. Running sp_who2 on the affected server reveals that there are indeed blocked processes, as is evidenced by the BlkBy field in the results, see Figure 1.
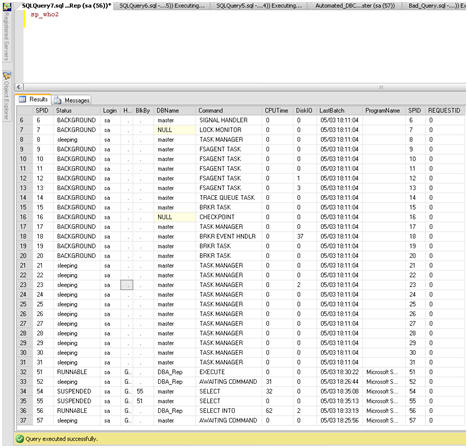
Figure 1: Blocked processes uncovered by sp_who2.
I can tell at first glance that SPID 55 is blocked by SPID 51, and that SPID 54 is blocked by 55. I can also see that the database context of the blocking SPID is the DBA_Rep database, which ironically and for argument’s sake is the same database that the fictitious A.R.G application uses.
With sp_who2, I have discovered a blocking process and it has been blocking for quite some time now. Users are getting frantic, and soon this will escalate and there will be three or four people at my cubicle, who otherwise would not give the SQL Server infrastructure a second glance, laser beam focused on my every action, and fully expecting me to solve the problem quickly.
In order to do so, I am going to have to find fast answers to the following questions:
- Who is running the query and from where?
- What is the query doing?
- Can I kill the offending query?
- If I kill the query, will it rollback successfully and will this free up the blocked processes?
Who is running the query?
Finding out who is running the query, and from where, is usually easy and, in fact, may be readily apparent from the output of sp_who2. In this case, Figure 1 tells me that the query is being executed by sa from Microsoft SQL Server Management Studio and it is coming from the local server “G”.
However, in the real world, it might not always be quite so straightforward to answer the “who” question. Some applications use a generic login as an abstraction from the user. The user may possess a valid login account, but this account is not used to directly connect to the database. Instead, the account is controlled by the application, and usually stored in a table within the application database. In these cases, you will often see the generic application login and not the user’s login.
What you may also find is that the query is issued by an application residing on another server, potentially a web server, in which case the ProgramName field from the sp_who2 results will likely show “.Net Client”. That does not tell you much. You may also see the Web server name but, again, this may be expected. Occasionally, you may strike lucky and see an unexpected application, like Management Studio, Query Analyzer, Microsoft Access or some other application that should not be connecting to production data directly, outside of the front end application. If so, then you have made progress and can continue with the confidence that you now have a user name, program name and location. If you have not captured anything out of the ordinary, that is OK; you will still be able to find the answer to the next most important question, “What is the query doing?”
DBCC: What is the query doing?
Microsoft has been kind enough to provide us with many tools to diagnose such issues. One such tool is the DBCC set of commands. DBCC, which if you are a SQL Server DBA you are very familiar with, can be used for a variety of important tasks, from checking for and fixing corrupt databases ( DBCC CHECKDB), which I cover in my book ‘The DBAs Tackle Box’, to checking how memory is being used on your SQL Server instance ( DBCC MEMORYSTATUS). There is another DBCC command, INPUTBUFFER, which allows you to see the underlying query that a specific SPID is executing. It is quite helpful, nay, indispensible, for the sleuthing DBA.
Using DBCC INPUTBUFFER is as easy as passing in the SPID number, as shown in Figure 2, to uncover the “Bad Query” that is blocking the other process.

Figure 2: Output of DBCC INPUTBUFFER.
As you can see the output lacks formatting when returned in a grid format. I could expand the EventInfo field to get a better look at the query, but it would still lack proper formatting. Returning the results to text, which is simply a matter of clicking the “Results to Text” button on the Management Studio toolbar, usually delivers better results, as shown in Figure 3.
Clearly, someone has been tasked with filling the Important_Data table (shown in Listing 1 for those who want to work through the example) with values and will do whatever it takes to get the job done!
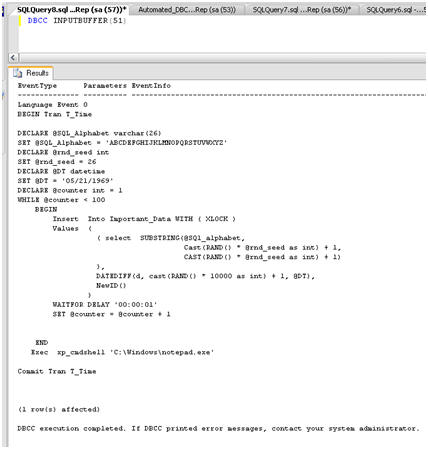
Figure 3: Results to Text for DBCC INPUTBUFFER.
|
1 2 3 4 5 6 7 |
CREATE TABLE [dbo].[Important_Data]( [T_ID] [int] IDENTITY(1,1) NOT NULL, [T_Desc] [nchar](40) NOT NULL, [T_Back] [datetime] NULL, [T_Square] [uniqueidentifier] NULL ) ON [PRIMARY] GO |
Listing 1: CREATE statement for Important_Data table.
Let’s take a look at this “Bad Query” in all its ugly glory, as shown in Listing 2.
|
1 2 3 4 5 6 7 8 9 10 11 12 13 14 15 16 17 18 19 20 21 22 23 24 25 26 27 28 29 30 31 |
BEGIN Tran T_Time DECLARE @SQL_Alphabet varchar(26) SET @SQL_Alphabet = ' ABCDEFGHIJKLMNOPQRSTUVWXYZ' DECLARE @rnd_seed int SET @rnd_seed = 26 DECLARE @DT datetime SET @DT = '05/21/1969' DECLARE @counter int SET @counter = 1 DECLARE @tempVal NCHAR(40) WHILE @counter < 100 BEGIN SET @tempVal = SUBSTRING(@SQl_alphabet, Cast(RAND() * @rnd_seed as int) + 1, CAST(RAND() * @rnd_seed as int) + 1) Insert Into Important_Data WITH ( XLOCK ) Values ( @tempVal, DATEDIFF(d, cast(RAND() * 10000 as int) + 1, @DT), NewID() ) WAITFOR DELAY '00:00:01' SET @counter = @counter + 1 END Exec xp_cmdshell 'C:\Windows\notepad.exe' Commit Tran T_Time |
Listing 2: Really “Bad Query”.
If I saw this query on a real system, my concern would begin to build at around line 15, and by line 24 I think I would be a bit red-faced. At line 29, where I see the query call xp_cmdshell and execute Notepad.exe, I would need a warm blankie and soft floor where I would lie in a fetal position for a few hours thinking about happy things.
Of course, at this stage I should make it clear that this query is an exercise in the ridiculous; it is one that I specifically designed to cause locking and blocking so that I could demonstrate how to resolve similar issues on your servers. The “bad query” is not the work of a reasonable person but that does not mean that something similar will never occur on one of your servers (although it would probably never occur twice). Wrapped in a transaction called T_Time, it inserts one row at a time, 1,000 times, into the Important_Data table, based on random patterns for T_Desc and T_Back. It does this insert every 1 second. While doing so, it explicitly locks out the Important_Data table using a table hint ( XLock) so that no other query can access the Important_Data table until it is complete, which will not be until 1020 seconds, or 17 minutes, passes.
Finally, we have the heinous call to xp_cmdshell. Again, one would think that no one would really do this in the real world. Unfortunately, I know for a fact that some developers make liberal use of xp_cmdshell. Sometimes, it is the path of least resistance to kicking off another process that will return a value to the calling query. But what if, at some point, the expected value is not returned and a dialogue box appears instead, awaiting user input? Suffice it to say that it would be very bad, but I am getting ahead of myself. All we need to know right now is that, for the sake of our example, this query is “happening” and I do not have a few hours or soft floor, and the warm blankie was wrenched from my grasp by my boss who is standing over me. So, it is best to just proceed ahead to resolution.
Killing the offending query
At this point, my goal is simply to kill the blocking SPID so that any queries backing up behind it can start to flow through. So, after confirming that the business has signed off on killing the offending SPID (trust me, eventually, you will get the OK to KILL this SPID), the next step seems easy enough, and the command would look something like this:
|
1 |
KILL SPID 51 |
And that is it, right? If you issue this command in SSMS, you will receive the usual reassuring “success” message, as shown in Figure 4.
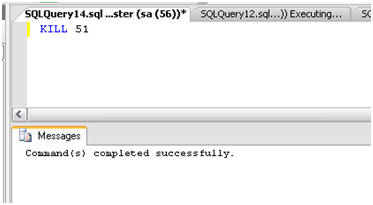
Figure 4: Killing the Bad Query process (51).
However, that message can be misleading. In some cases, the SPID will indeed be killed but there may be a significant time lag while the offending statement is being rolled back. An option of the KILL command exists that I was not aware of at one point in my career, and that is WITH STATUSONLY. After killing a SPID you can issue the KILL command again with this option and get a status of how long SQL Server estimates that a ROLLBACK will take. If you have been rebuilding an index for 10 minutes, for example, and kill that process, you can see the “% completion of rollback” counting up to 100%.
In other cases, it may be that, despite issuing the KILL command, the SPID will not be dead at all and the blocking will still be evident. If you issue the KILL WITH STATUSONLY command for the Bad Query, you will see something similar to Figure 5.

Figure 5: SPID that will not be killed.
As you can see, the SPID shows an estimated time rollback completion of 0%, and an estimated time remaining for rollback of 0 seconds, indicating that it is not going to be possible to kill this SPID directly. This situation can occur for the reason that I foreshadowed earlier: the blocking process has kicked off another process, such as an executable, and SQL Server is waiting, indefinitely, for that other process to complete. The only way to kill the blocking SPID is either to restart SQL Server or find and kill the executable that SQL Server is waiting for.
In this example, I know that the Bad Query launched Notepad.exe so I have a head start. Figure 6 shows the culprit in Task Manager.

Figure 6: Offending Notepad.exe preventing killing SPID 51.
Remember that Notepad is only an example; this could have been any other process that got called from xp_cmdshell and was waiting for user input to finish.
All I should have to do is end the Notepad.exe process and the blocking will be cleared and the resources freed. Notice that the user name for Notepad.exe is SYSTEM. When SQL Server issued the command to the OS, via xp_cmdshell, Notepad was launched as a System process, not as a user process.
Right-clicking Notepad.exe and selecting “End Process” finishes off the Notepad executable, allowing SPID 51 to be killed, and all previously blocked processes to move forward.
Any INSERT statements that were issued as part of the transaction, before Notepad was executed, should be considered discarded, as Figure 7 shows.
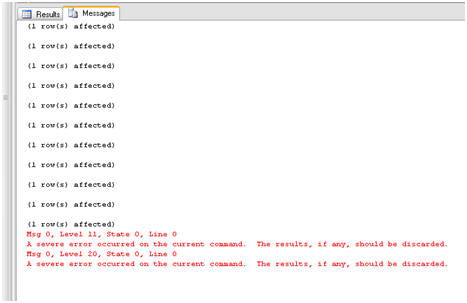
Figure 7: Discard any transaction for the killed SPID.
This can be confirmed by issuing a quick query against the Important_Data table, as shown in Figure 8, to verify that no records exist after the KILL statement was run and Notepad.exe was terminated.
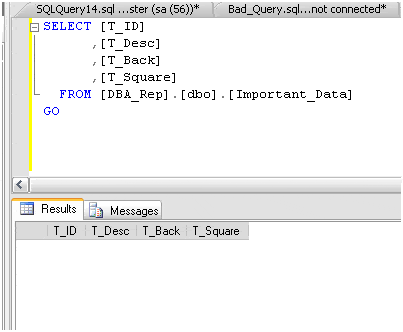
Figure 8: No committed records in Important_Data after KILL.
Using sp_lock
Before I deliver a query that is going to automate the discovery of problem queries (there I go foreshadowing again), I want to talk about another important characteristic of poorly performing queries, namely their rampant use of resources.
It is very important to monitor usage of CPU and I/O resources and I will cover those in great detail in the next article, on Performance Monitoring and Notifications. However, here I want to focus on locking resources. While sp_who2 gives you a good picture of processes that may be blocking other processes, and some initial insight in to the resource utilization via CPU and Disk I/O, it does not give you any details about the various locks that have been acquired in order to execute the process.
Locking is a “normal” activity in SQL Server, in that it is the mechanism by
which SQL Server mediates the concurrent access of a given resource by several “competing” processes. However, as a DBA you will come to recognize
certain locking behavior that is an immediate tell-tale sign of something being intrinsically wrong.
Some common lock types are:
- RID – single row lock
- KEY – a range of keys in an index
- PAG – data or index page lock
- EXT – Extent Lock
- TAB – Table Lock
- DB – Database Lock
In addition to lock types that refer to resources or objects that can be locked, SQL Server has common lock modes:
- S – Shared lock
- U – Update Lock
- X – Exclusive lock
- IS – Intent shared
- IU – Intent Update
- IX – Intent Exclusive
- BU – Bulk update
In the above list of lock types and modes, combinations of resources and modes can be created. So, for example, you can have a table lock (TAB) that has a mode of “X” for exclusive. This means that a process has requested or been granted an exclusive lock on a table. Of course, this may indeed cause blocking issues if the lock is held for a substantial duration.
SQL Server provides a stored procedure, called sp_lock, which provides a lot of information that is useful to a DBA regarding the number and type of locks that a process has requested.
Note: The SQL Server 2005, and above, equivalent of sp_lock would be the DMV sys.dm_tran_locks.
Figure 9 shows the output of sp_lock for SPID 51, the Bad Query.
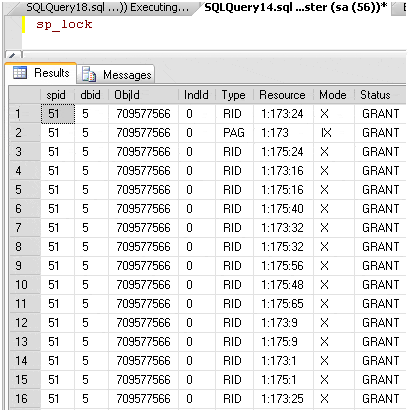
Figure 9: Number of locks from Bad Query.
You can see that there are many locks acquired, mostly exclusive locks at the row level, as indicated by the mode “X” and the type “RID”. When I see one SPID that has acquired this number of locks, especially exclusive locks, I get very concerned that something is definitely not as it should be.
Often, a simple count of the locks and, more importantly, the types of locks for a specific SPID, is enough to help me locate a poorly performing query, even if there is no obvious blocking. Acquiring locks, just like acquiring connections, requires memory resources and even shared locks, which may not block others from accessing data, can sometimes have a major performance impact due to memory or other resource pressures.
Automating discovery of problems
Up to this point we have used sp_who2 to seek out SPIDs that are causing blocking issues, DBCC INPUTBUFFER to elicit the SQL being executed by such a blocking SPID, and then sp_lock to discover some information about the locks being acquired by the offending process. All of this took quite a bit of time to manually discover and resolve, and when a query is locking out an entire table, and depleting any number of other precious resources, this is time you don’t necessarily have.
What is missing is a single query that will tell all in a single execution. Faced with this pressing need, I have developed just such a query. It returns all of the previously discovered information, and more, in an easily-digestible format,
While sp_who2 gives good “at a glance” information, my query dives into the underlying system table, called sysprocesses, in order to retrieve some additional information regarding the blocking and blocked processes.
With sp_lock, the underlying system table is syslockinfo. This table does not display intuitive information in the manner of sysprocesses. Specifically, the type of locks have to be identified,via a join to the spt_values table in the Master database. When developing the query, I found it much easier to create a table to store the output of sp_lock and then do a simple count of lock types
per SPID.
TIP: The stored procedure, sp_helptext, is one of those “hidden gems” that I have used many times over the years. When passed any object, such as a view or stored procedure, it will display the code that makes up that object. Running sp_lock through sp_helptext will show the join to the spt_values table.
Listing 3 shows the query that will, in one fell swoop, find and report on blocked and blocking processes and the number of locks that they are holding. First it creates a temp table to store the output of sp_lock and then it lists all locked and blocked processes, along with the query that each process is currently executing, or that is waiting on resources before it can be executed.
|
1 2 3 4 5 6 7 8 9 10 11 12 13 14 15 16 17 18 19 20 21 22 23 24 25 26 27 28 29 30 31 32 33 34 35 36 37 38 39 40 41 42 43 44 45 46 47 48 49 50 51 52 53 54 55 56 57 58 59 60 61 62 63 64 65 66 67 68 69 70 71 72 73 74 75 76 77 78 79 80 81 82 83 84 85 86 87 88 89 90 91 |
SET NOCOUNT ON GO -- Count the locks IF EXISTS ( SELECT Name FROM tempdb..sysobjects WHERE name LIKE '#Hold_sp_lock%' ) --If So Drop it DROP TABLE #Hold_sp_lock GO CREATE TABLE #Hold_sp_lock ( spid INT, dbid INT, ObjId INT, IndId SMALLINT, Type VARCHAR(20), Resource VARCHAR(50), Mode VARCHAR(20), Status VARCHAR(20) ) INSERT INTO #Hold_sp_lock EXEC sp_lock SELECT COUNT(spid) AS lock_count, SPID, Type, Cast(DB_NAME(DBID) as varchar(30)) as DBName, mode FROM #Hold_sp_lock GROUP BY SPID, Type, DB_NAME(DBID), MODE Order by lock_count desc, DBName, SPID, MODE --Show any blocked or blocking processes IF EXISTS ( SELECT Name FROM tempdb..sysobjects Where name like '#Catch_SPID%' ) --If So Drop it DROP TABLE #Catch_SPID GO Create Table #Catch_SPID ( bSPID int, BLK_Status char(10) ) GO Insert into #Catch_SPID Select Distinct SPID, 'BLOCKED' from master..sysprocesses where blocked <> 0 UNION Select Distinct blocked, 'BLOCKING' from master..sysprocesses where blocked <> 0 DECLARE @tSPID int DECLARE @blkst char(10) SELECT TOP 1 @tSPID = bSPID, @blkst = BLK_Status from #Catch_SPID WHILE( @@ROWCOUNT > 0 ) BEGIN PRINT 'DBCC Results for SPID ' + Cast(@tSPID as varchar(5)) + '( ' + rtrim(@blkst) + ' )' PRINT '-----------------------------------' PRINT '' DBCC INPUTBUFFER(@tSPID) SELECT TOP 1 @tSPID = bSPID, @blkst = BLK_Status from #Catch_SPID WHERE bSPID > @tSPID Order by bSPID END |
Listing 3: Automated discovery query.
There is nothing overly complicated about this query. It is a base starting point from which you can quickly analyze locking and blocking issues in SQL Server. In the case of non-blocking locks, it will show you any query that is a potential issue with regard to other resources such as memory or I/O.
Figure 10 shows the output of this query, captured while the “Bad Query” was executing.
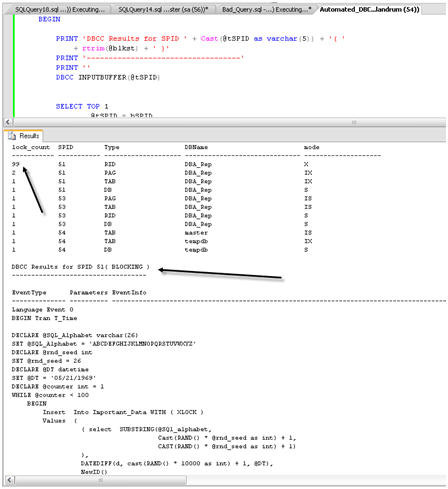
Figure 10: Output of SPID count and Blocking query in Automated Discovery.
Notice the high lock count of 99 for SPID 51, the culprit query. The next output section shows that, in this case, SPID 51 is indeed causing blocking, and the code that the SPID is executing follows, as we have seen previously from DBCC INPUTBUFFER.
In addition, the Automated Discovery Query also lists all of the blocked SPIDs behind the main blocking SPID. Figure 11 shows the queries, in this case simple select statements against the Important_Data table, which are blocked by
SPID 51.
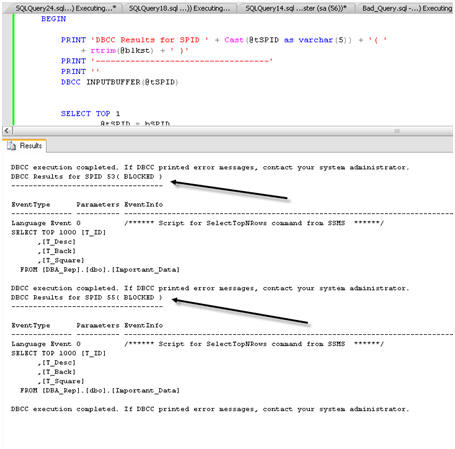
Figure 11: Blocked SPIDs found using Automated Discovery query.
You might decide that you would like to take this query, and make it into a stored procedure. You can then load it into a maintenance database on each server so that you have it always available. It also means that you can parameterize it to control its behavior. For example, you may decide that you do not want to execute the portion of the query that counts locks, which on a very busy system could take quite a bit of time.
Listing 4 shows the code to create this stored procedure, named usp_Find_Problems, with a flag to execute the lock count portion based on need.
|
1 2 3 4 5 6 7 8 9 10 11 12 13 14 15 16 17 18 19 20 21 22 23 24 25 26 27 28 29 30 31 32 33 34 35 36 37 38 39 40 41 42 43 44 45 46 47 48 49 50 51 52 53 54 55 56 57 58 59 60 61 62 63 64 65 66 67 68 69 70 71 72 73 74 75 76 77 78 79 80 81 82 83 84 85 86 87 88 89 90 91 92 93 94 95 96 97 98 99 100 |
USE [DBA_Rep] GO /****** Object: StoredProcedure [dbo].[usp_Find_Problems] Script Date: 06/22/2009 22:41:37 ******/ SET ANSI_NULLS ON GO SET QUOTED_IDENTIFIER ON GO CREATE PROCEDURE [dbo].[usp_Find_Problems] ( @count_locks BIT = 1 ) AS SET NOCOUNT ON -- Count the locks IF @count_locks = 0 GOTO Get_Blocks ELSE IF @count_locks = 1 BEGIN CREATE TABLE #Hold_sp_lock ( spid INT, dbid INT, ObjId INT, IndId SMALLINT, Type VARCHAR(20), Resource VARCHAR(50), Mode VARCHAR(20), Status VARCHAR(20) ) INSERT INTO #Hold_sp_lock EXEC sp_lock SELECT COUNT(spid) AS lock_count, SPID, Type, CAST(DB_NAME(DBID) AS VARCHAR(30)) AS DBName, mode FROM #Hold_sp_lock GROUP BY SPID, Type, CAST(DB_NAME(DBID) AS VARCHAR(30)), MODE ORDER BY lock_count DESC, DBName, SPID, MODE --Show any blocked or blocking processes Get_Blocks: CREATE TABLE #Catch_SPID ( bSPID INT, BLK_Status CHAR(10) ) INSERT INTO #Catch_SPID SELECT DISTINCT SPID, 'BLOCKED' FROM master..sysprocesses WHERE blocked <> 0 UNION SELECT DISTINCT blocked, 'BLOCKING' FROM master..sysprocesses WHERE blocked <> 0 DECLARE @tSPID INT DECLARE @blkst CHAR(10) SELECT TOP 1 @tSPID = bSPID, @blkst = BLK_Status FROM #Catch_SPID WHILE( @@ROWCOUNT > 0 ) BEGIN PRINT 'DBCC Results for SPID ' + CAST(@tSPID AS VARCHAR(5)) + '( ' + RTRIM(@blkst) + ' )' PRINT '-----------------------------------' PRINT '' DBCC INPUTBUFFER(@tSPID) SELECT TOP 1 @tSPID = bSPID, @blkst = BLK_Status FROM #Catch_SPID WHERE bSPID > @tSPID ORDER BY bSPID END END |
Listing 4: Statement to create usp_Find_Problems.
Executing usp_Find_Problems with no parameters will return the lock counts as well as the blocked and blocking SPIDs, whereas executing it with a value of 0 as the input parameter will exclude the lock counts. Figure 12 shows both executions in SSMS, using vertical tab groups.
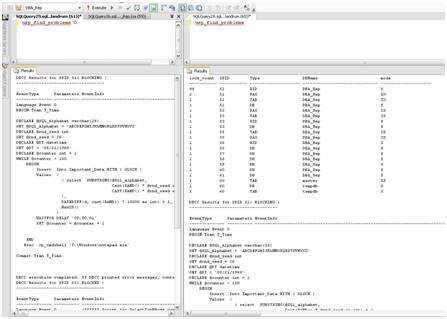
Figure 12: Executing the usp_Find_Problems stored procedure with parameters.
Summary
In this article I demonstrated how I go about detecting SQL Server problems in the form of excessive locking, and blocking. While this is a good start for the DBA detective, there is much more ground to cover. I mentioned CPU and I/O in this article only peripherally, as it relates to problem code. In my book, I continue on the path of analyzing performance issues, but extend this topic to explain how to make sure you get notified immediately of performance, and other, issues.
After all, if you do not know about the problem, you can’t fix it. I would much rather be notified of a potential issue from a system that is monitoring such events than from an irate application user, or from the Help Desk. Granted, you will be hard pressed to totally escape emails from users and that is OK, generally they are understanding. It is their bosses that are not. If you can find and fix, or even just report, an issue before anyone else, it appears that you are ahead of the game. And you are … you are a DBA after all.
Detecting SQL Server problems. Rodney demonstrates in this article how he goes about detecting SQL Server problems in the form of excessive locking, and blocking.
SQL Response, Red Gate’s monitoring and alerting tool, notifies you of SQL Server health and activity problems as soon as they occur and provides you with diagnostic data to resolve them.

Load comments