
SQL Server 2016 allows us to pass filtered data to R to perform complex statistical analysis, graphing and calculation, and even enables us to run the many R packages. Power BI is a powerful tool for data analytics and visualization. The integration of the three components SQL, R and Power BI can provide us with a complete BI solution.
Although it has long been possible to connect to a SQL database from R so that an R script can fetch the data, SQL Server 2016 allows us the alternative of running an R script from SQL Server. In the example that follows, we will demonstrate how to do this. We’ll use Sales data stored in a SQL Server database to calculate an ‘employee sales forecast’ using R. We will execute R script within SQL Server to utilize SQL Server database features such as data security, multi-threading and the handling of a large data set. The R package will perform a statistical analysis on the data. We will finally use Power BI desktop to analyze and visualize the employee sales and forecast data. PowerBI has a direct query feature to view and analyze the real-time data.
Prerequisite Software
To run this example, we will need to have the following installed before we start.
- SQL Server 2016 with Microsoft R services
- SQL Server 2016 Management Studio
- Power BI desktop.
In our example, we will follow these steps.
- Enable External Script(R script ) in SQL Server
- Run Test script to check R and SQL connectivity.
- Install Forecast and other dependent packages inside Microsoft R service folder
- Calculate the Forecast in R
- Using PowerBI , create Relation between two tables and visualize real time data using Power Bi desktop.
Allow the running of External Scripts, the R script, in SQL Server.
To run R scripts from SQL Server, we need to change the value of the configuration item “external script enabled” from 0 to 1. Otherwise when you run R script from SQL Server, you will get an error.
Open SQL Server Management Studio and then run the following command to check the current value.
|
1 |
EXECUTE sp_configure 'external scripts enabled'; |
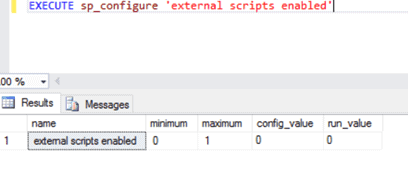
The default configuration value is 0, and the run value is 0. Now, run below command to change ‘external script enabled’ value from 0 to 1.
|
1 2 3 |
EXECUTE sp_configure 'external scripts enabled', 1; GO RECONFIGURE; |
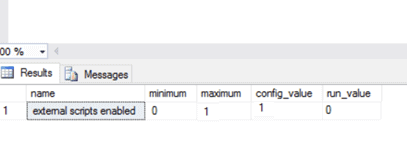
Now, close the Management Studio, Restart the SQL Service and re-open SQL Server Management Studio to run this command.
|
1 |
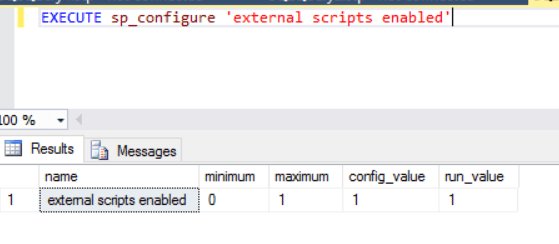
EXECUTE sp_configure 'external scripts enabled'; |
Now the config_value should be 1 and the run_value should be 1.
Run the test script to check R and SQL connectivity.
The sp_execute_external_script procedure is a built-in stored procedure in SQL Server. This stored procedure will call an R script. The meaning of each parameter is explained later on in this article when we come to run our R script rather than a sample test script .
Open SQL Server Management Studio and run this minimal test script .
|
1 2 3 4 5 |
execute sp_execute_external_script @language = N'R' , @script = N' OutputDataSet <- InputDataSet;' , @input_data_1 = N' SELECT 1 as Test ;' WITH RESULT SETS (([Col1] int NOT NULL)); |
Result
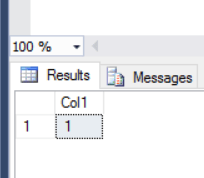
After successfully getting this result, we can be confident of being able to run any R script from SQL Server, unless of course it references a package. Next we’ll show you how to install an R package.
Install Forecast and other dependent packages inside Microsoft R service folder
In this example, we will calculate the sales forecast using an R script. R is able to run packages for a wide range of purposes, and R run from SQL Server is no exception, so we need to be able to install the necessary R package in our machine. Because we are running the R script from SQL Server, we need to install the ‘Forecast’ package that it references. It is placed in a subfolder of the Microsoft SQL Server folder.
Here are the steps to install the ‘Forecast’ library in SQL Server.
- First locate SQL Server 2016 installation folder in your computer
- For example, C:\Program Files\Microsoft SQL Server\ MSSQL13.MSSQLSERVER2016
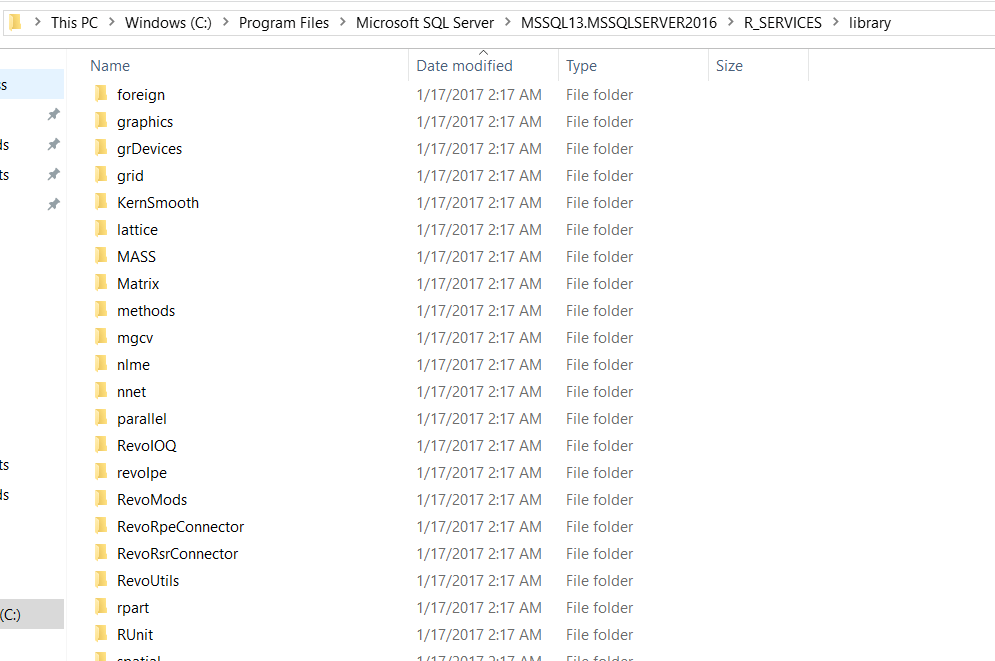
- Inside MSSQL13.MSSQLSERVER2016 folder, you can see R_SERVICES\library subfolder.
Now, we know the SQL server R service library folder location. The next step is to install Forecast library in the library folder that is used by SQL server R service.
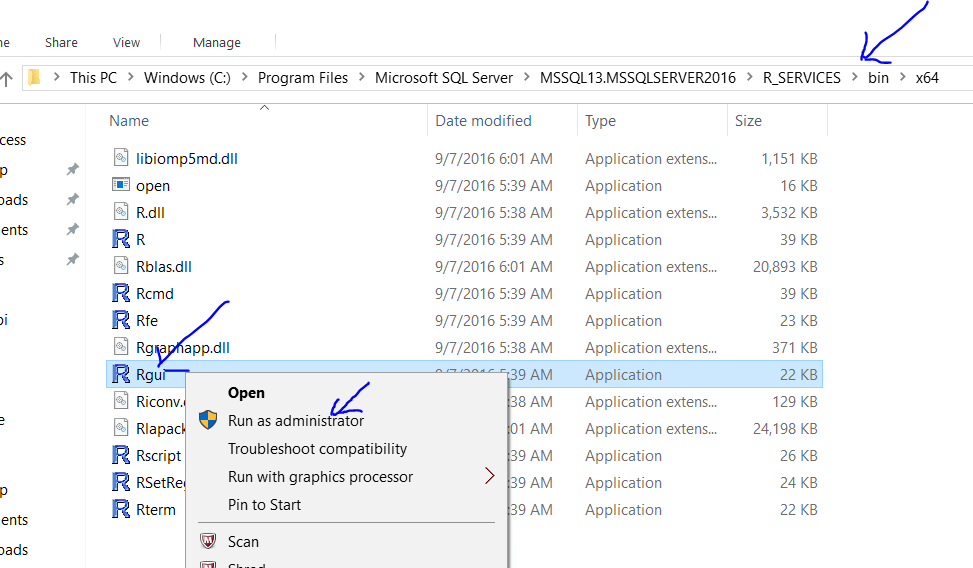
- Go to C:\Program Files\Microsoft SQL Server\ MSSQL13.MSSQLSERVER2016\R_Services\bin\X64 location to find the R GUI application.
- Right-click on the R GUI and click on ‘Run with administrator’. This step will open the R GUI to run an R script. The purpose of our R script is simply to install the ‘forecast’ library.
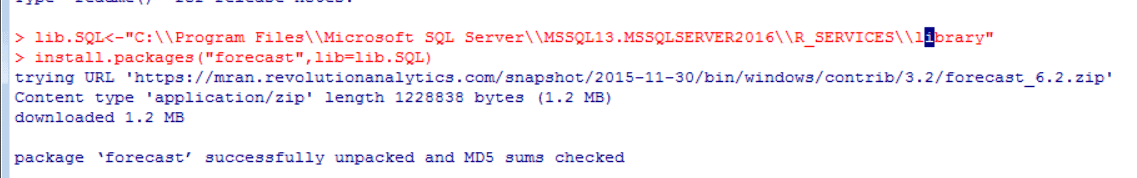
- Now, we will run the following lines of code in the R GUI to install the ‘forecast’ package. We also need to install some dependent libraries to run the ‘forecast’ package.
In this code, lib.SQL is a variable to store our SQL server R service library folder path. In this path, we want to install the library
The install.packages command is to install the R package.
The First argument of install.packages is the name of the package .
The second argument is to specify the folder location, where we want to install the library.
|
1 2 3 4 5 6 |
lib.SQL<-"C:\\Program Files\\Microsoft SQL Server\\MSSQL13.MSSQLSERVER2016\\R_SERVICES\\library" install.packages("forecast",lib=lib.SQL) install.packages("timeDate",lib=lib.SQL) install.packages("zoo",lib=lib.SQL) install.packages("colorspace",lib=lib.SQL) install.packages("fracdiff",lib=lib.SQL) |
Once we have followed these steps to install the Forecast library, it is time to check the R ‘Forecast’ library connectivity in SQL Server.
Run this command in SQL Server Management Studio to make sure that all ‘Forecast’-related packages are installed properly.
|
1 2 3 4 5 6 |
execute sp_execute_external_script @language = N'R' , @script = N' library("forecast") OutputDataSet <- InputDataSet;' , @input_data_1 = N' SELECT 1 as Test ;' WITH RESULT SETS (([Col1] int NOT NULL)); |
If you get the result in SQL Server Management Studio as shown below, it means that we have properly installed the R forecast package in SQL Server. If you receive some error message about a missing library, please install the missing library.
Result

Calculate the Forecast in R
So far, we have set up our R environment in SQL Server. Now, we will run a program to calculate the sales employee forecast of sales, using some test data.
SQL Script to create employee table. :
The EmpInfo Table contains Employee Sales data. Run this script in SQL Server Management Studio.
|
1 2 3 4 5 6 |
CREATE TABLE [dbo].[empInfo]( [Name] [varchar](50) NOT NULL, [Year] [int] NOT NULL, [Sales] [int] NULL, [Month] [nvarchar](50) NULL ) |
SQL Script to Insert data in employee table.
|
1 2 3 4 5 6 7 8 9 10 11 12 |
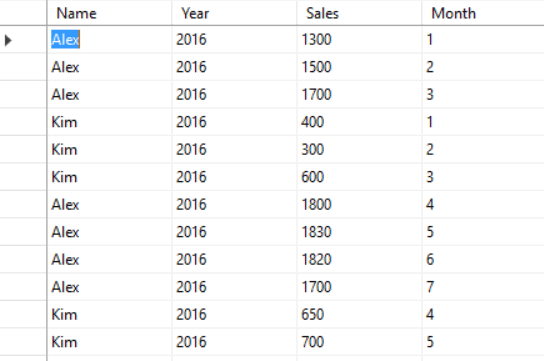
Insert into empinfo ([name],Year,Sales,Month) values('Alex',2016,1300,1) insert into empinfo ([name],Year,Sales,Month) values('Alex',2016,1500,2) insert into empinfo ([name],Year,Sales,Month) values('Alex',2016,1700,3) insert into empinfo ([name],Year,Sales,Month) values('Alex',2016,1800,4) insert into empinfo ([name],Year,Sales,Month) values('Alex',2016,1830,5) insert into empinfo ([name],Year,Sales,Month) values('Alex',2016,1820,6) insert into empinfo ([name],Year,Sales,Month) values('Alex',2016,1700,7) insert into empinfo ([name],Year,Sales,Month) values('Kim',2016,400,1) insert into empinfo ([name],Year,Sales,Month) values('Kim',2016,300,2) insert into empinfo ([name],Year,Sales,Month) values('Kim',2016,600,3) insert into empinfo ([name],Year,Sales,Month) values('Kim',2016,650,4) insert into empinfo ([name],Year,Sales,Month) values('Kim',2016,700,5) |
Now, EmpInfo table will look like below
Stored procedure to calculate the forecast:
The Sp_EmpInfo Stored procedure will calculate the employee Forecast using R. dbo.empInfo table contains all of the employee data. Here, we will filter the employee data for an employee and calculate the forecast for an employee.
What the stored procedure covers:
- @inputquery: Contains filtered SQL data.
- @input_data_1: Pass the SQL data table to R data frame InputDataSet.
- InputDataSet: @input_data_1 is mapped to the R input dataset “InputDataSet”
- @script: Consumes SQL data and runs the R script. In this example, @script uses the forecast library to calculate the forecast and return the output data to SQL.
- OutputDataSet: Pass the R script output result set to SQL Server. R script output needs to be a data frame.
- StructTS: this function fits the structural model for a time series.
- Forecast function: this calculates the point in time forecast with 70 to 90 percent accuracy result.
- RESULT SETS : Result sets have SQL Server output. If you are not sure for the output type, you can write WITH RESULT SETS UNDEFINED;
In the stored procedure below, first we will filter the data in month order and then we convert the salary field into a numeric one.
|
1 2 3 4 5 6 7 8 9 10 11 12 13 14 15 16 17 18 |
CREATE procedure [dbo].[sp_EmpInfo] @name varchar(500) AS BEGIN declare @inputquery nvarchar(max) set @inputquery='select Sales from [dbo].[empInfo] where Name='''+@name +'''' +' order by Month;' Execute sp_execute_external_script @language = N'R' ,@script = N' inp_dat=InputDataSet library("forecast") SalesData <-as.numeric(inp_dat$Sales) fit <- StructTS(SalesData, "trend") SalesForecast<- forecast(fit,h=1, level = c(70, 90)) OutputDataSet <- data.frame(SalesForecast) ;' ,@input_data_1=@inputquery WITH RESULT SETS((PointForecast Float,Low70 float,high70 float,Low90 float,high90 float)) ; END |
Now execute the dbo.sp_EmpInfo stored procedure.
|
1 |
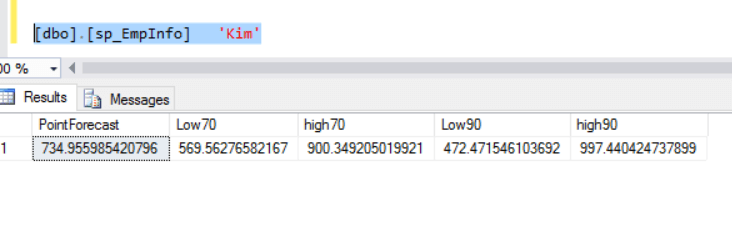
[dbo].[sp_EmpInfo] 'Kim' |
Processing the Result of the Forecast.
From this set, we will focus on the PointForecast,. Low 70-90 and High 70-90 fields to provide various accuracy levels.
- SQL script to create forecast table : Create the dbo.empForecast table to store the forecast data.
|
1 2 3 4 5 |
CREATE TABLE [dbo].[empForecast]( [name] [varchar](50) NOT NULL, [forecast] [float] NULL, [Month] [int] NULL ) |
Stored procedure to store forecasted data:
This stored procedure will call the sp_EmpInfo stored procedure and capture the R result set into SQL table variable .After some processing, we will store the table variable data in empForecast table.
|
1 2 3 4 5 6 7 8 9 10 11 12 13 14 15 16 17 18 19 20 21 |
Create Procedure [dbo].[sp_EmpForecast] @name varchar(100) as Begin declare @userData TABLE( Forecast float NULL, LowBottomPoint float null, HighBottomPoint float null, LowUpperPoint float null, HighUpperPoint float null ) INSERT INTO @userData EXEC [sp_empInfo] @Name select * from @userdata declare @forecast float select @forecast= max(Forecast) from @userData delete from dbo.empForecast where [name]=@name declare @Month float select @Month=Max(Month)+1 from dbo.empInfo where name=@name insert into dbo.empForecast(name,forecast,Month) values( @name,@forecast,@Month) End GO |
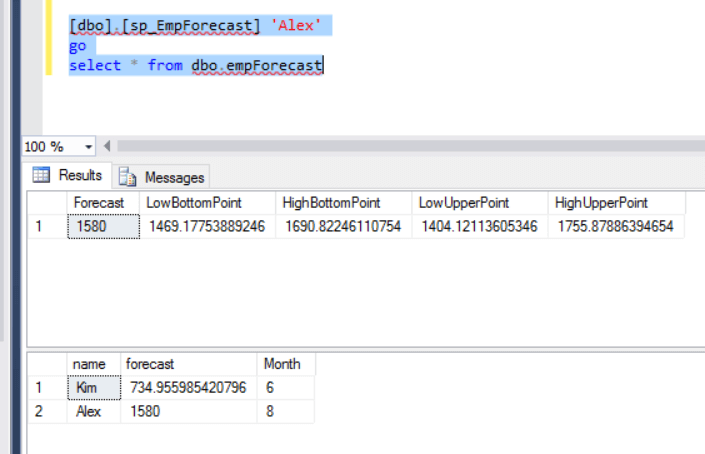
Now we are ready to execute stored procedure to calculate the forecast for an employee. Run below lines of code to calculate the forecast for employee Alex and Kim.
|
1 2 3 4 |
Exec [dbo].[sp_EmpForecast] 'Alex' Go Exec [dbo].[sp_EmpForecast] ' Kim' go |
Run the SELECT statement below to verify the employee forecast data.
|
1 |
select * from dbo.empForecast |
POWER BI
So far, we have calculated the Forecast in SQL server using R . Now we need a tool to analyze and visualize the forecast data. PowerBi is an interactive visualization tool to analyze the data. PowerBI will support multiple data sources. In PowerBI, we can define the relationship between two tables. In the current example, we will use a SQL server database as a data source.
Create Relation between two tables and analyze real time data using Power Bi desktop.
Connect the Data Source and Load the Data :
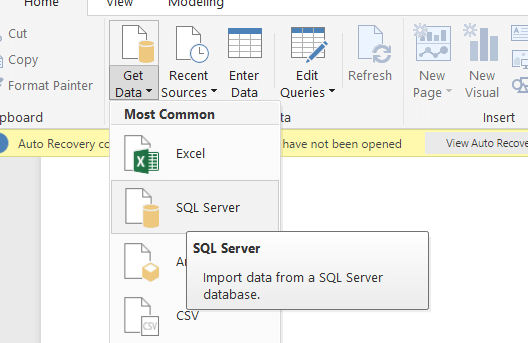
Open Power BI desktop. Click on ‘Get data’ and select SQL Server as the data source.
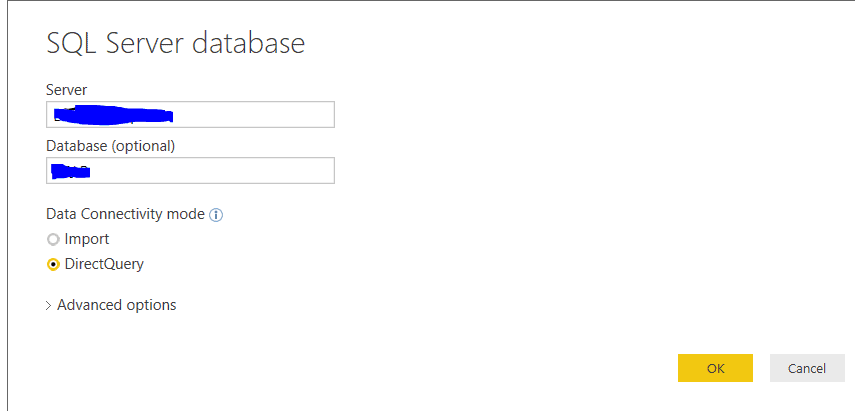
Now, select ‘Direct Query Option’ and click ‘Ok’. This option will hit the database table real time. By this I mean that
in General, when we connect to a data source, PowerBI loads the data into memory and displays the data. To reflect any data changes at source in the PowerBI application, we need to reload the PowerBI application.
DirectQuery is a feature to display real-time data in a PowerBI application. Using the directquery feature, the PowerBI report will always have the latest real-time data. There is no need to reload the application to refresh the data.
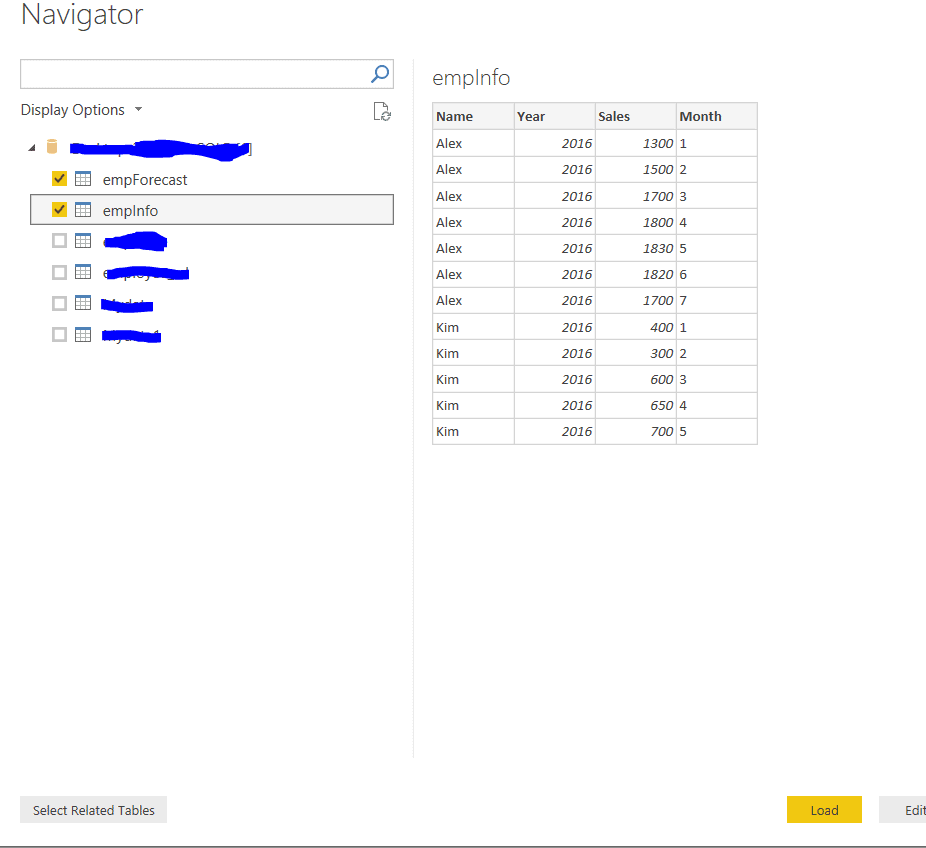
During forecast calculation, we have created two tables; empinfo and empforecast. We will use those tables to visualize the forecast data.
From the list as shown below, Select the empInfo and empForecast table and click ‘load’.
Define Relationship (Join) between tables :
So far in PowerBI, we have selected the forecast-related tables. Now, we will create a relationship between tables. We will select key column names from each table to join the two tables. PowerBI allows you to create various types of joins. One to One, One to Many or many to One. We can also add new calculated measure.
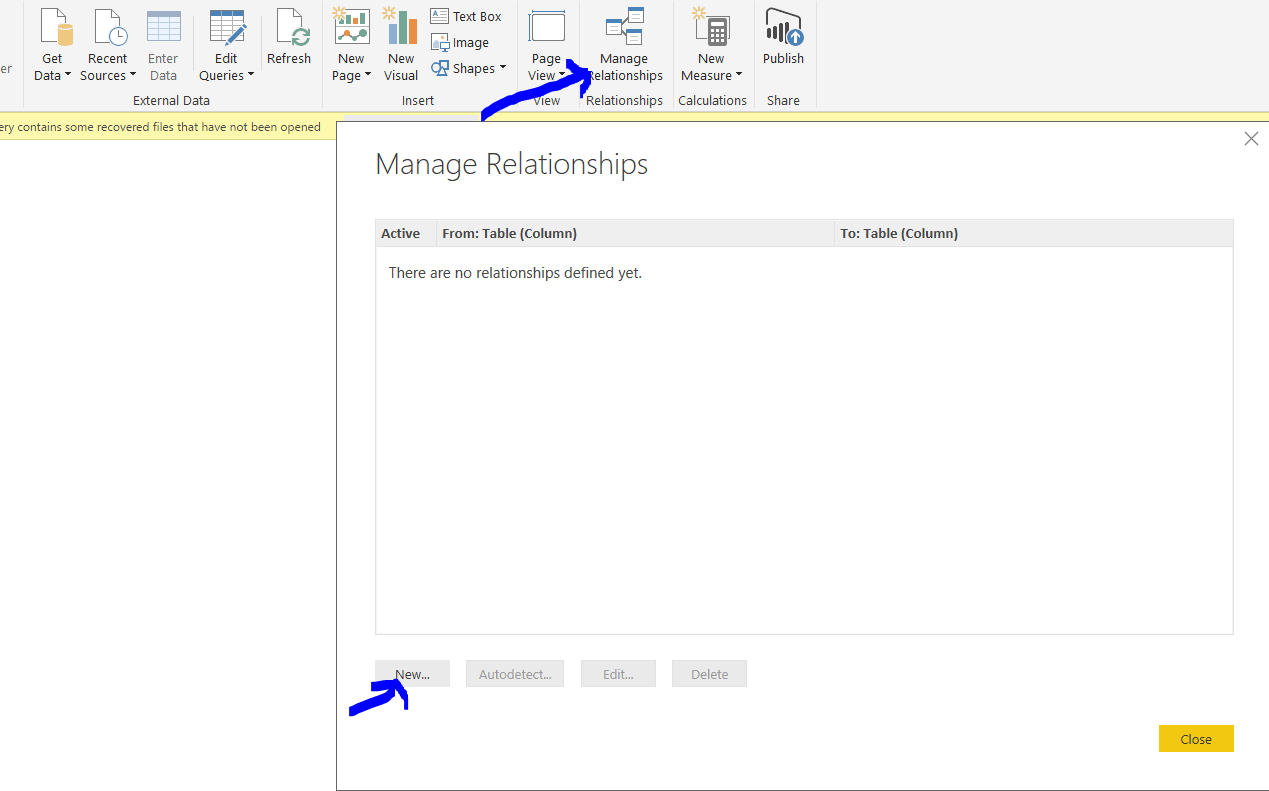
Click on Manage Relationship and click New
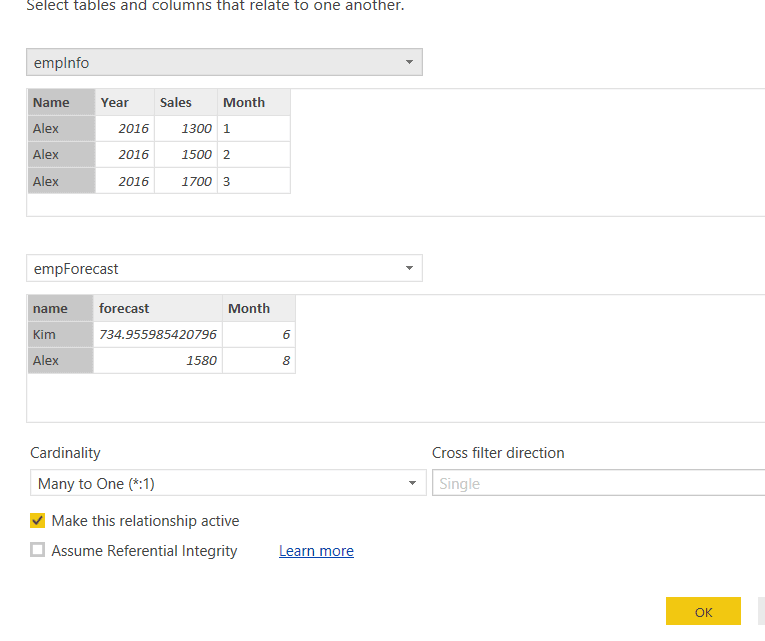
Now select both the tables. Decide your key columns between two tables. In this case, I will join the tables using the Name field from empinfo table and name field from empforecast table.
Click on the column ‘name’ on each table. The selected columns will be highlighted with a grey color and the join will be defined on gray highlighted fields. Once the relationship is defined, click ‘OK’.
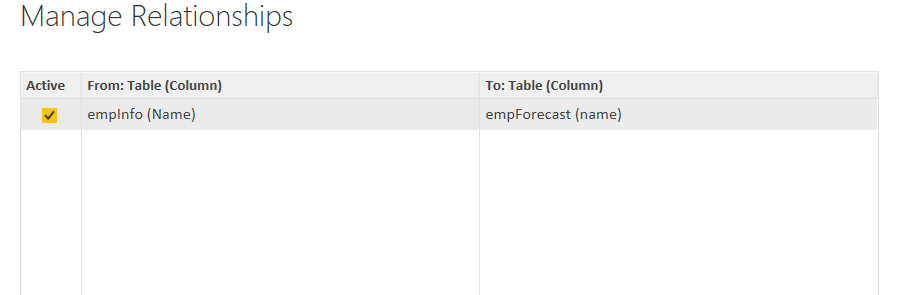
Now, if you click on ‘Manage Relationship’, it looks like the screenshot below. We have defined the join on the Name column between two tables. If I click on any value in the empinfo(name) field, the data in the empForecast(name) table will also get filtered.
Create Visualization in PowerBI :
After connecting to the data source, selecting the forecast tables and defining the relationship between the table fields in PowerBI, we are now all set to visualize our forecast data. PowerBI offers a rich visualization tool set to view and analyze the data.
In this example, we will use a straight table object. We need two straight table objects. One straight table object is used to see the empinfo table fields and second object to see the EmpForecast table fields.
Click on the first straight table object and drag fields from the empInfo table in the ‘Rows’ and ‘Columns’ section.
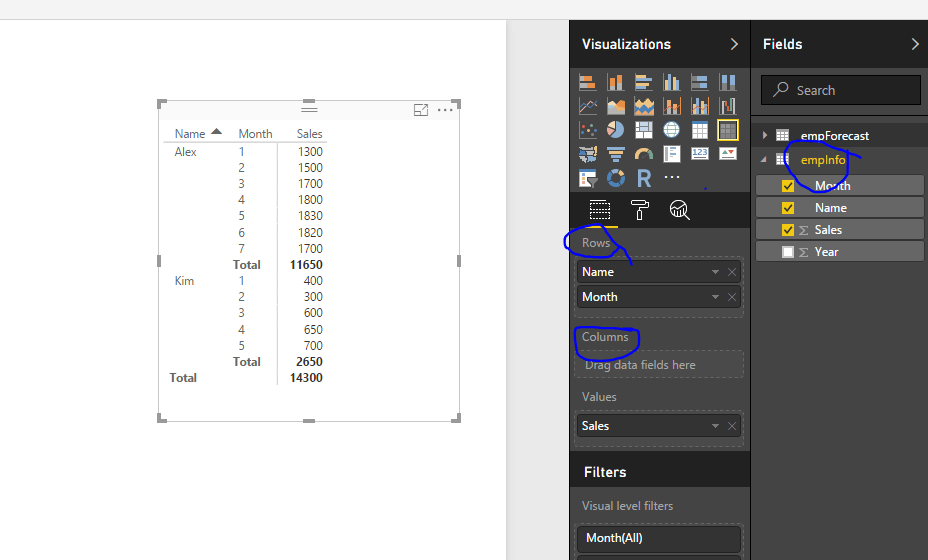
Click on the second straight table object and drag fields from the empForecast table in the ‘Rows’ and ‘Columns’ section.
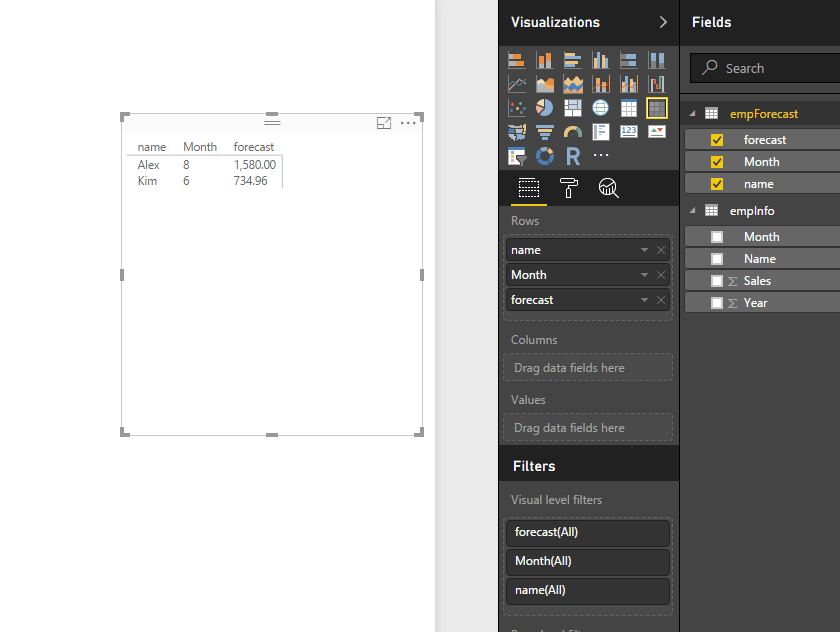
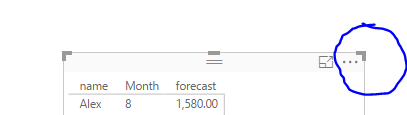
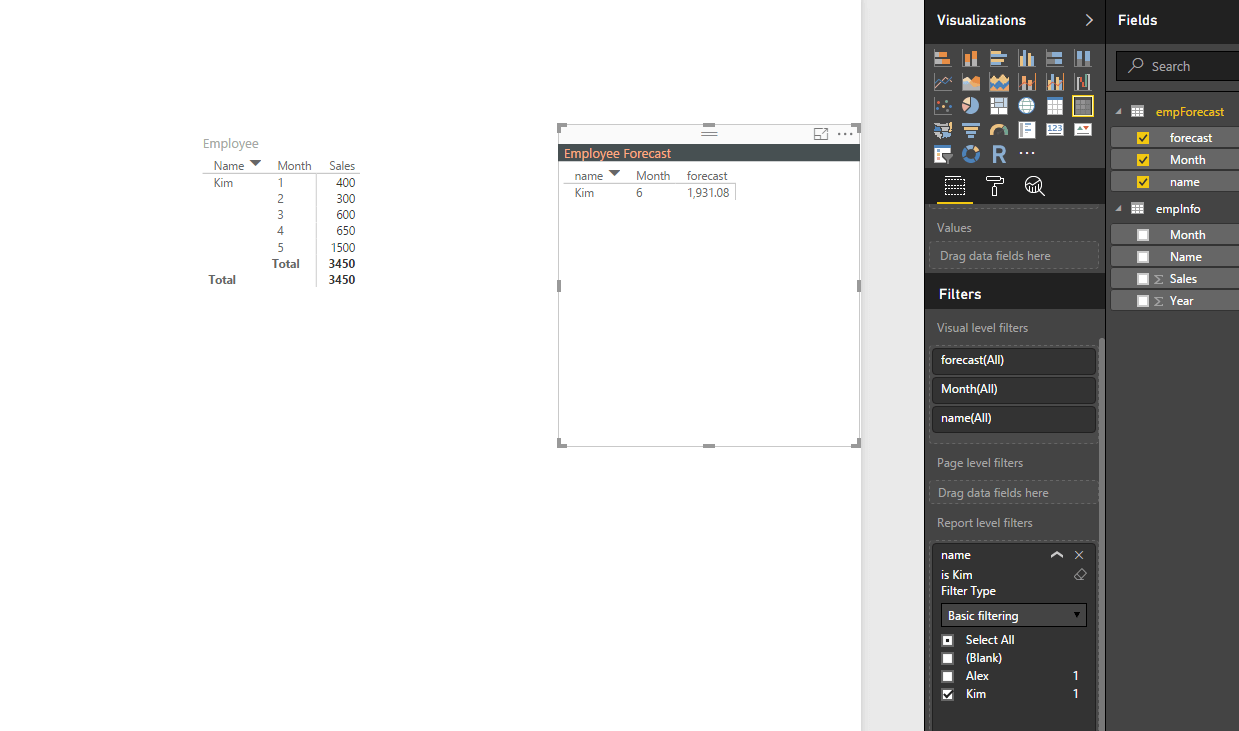
Now we can visualize data from two tables. Select the EmpForecast table and from the visualization panel drag the name field to the report filter. Now if you select ‘Alex’ from the filter pane, both tables in the report will show data only for Alex. By clicking on the top right corner of table, you should be able to export data in Excel.
In the visualization panel, there are options to Format the visualization object and define filters.
![]() This allows us to define columns, Rows and filters in report.
This allows us to define columns, Rows and filters in report.
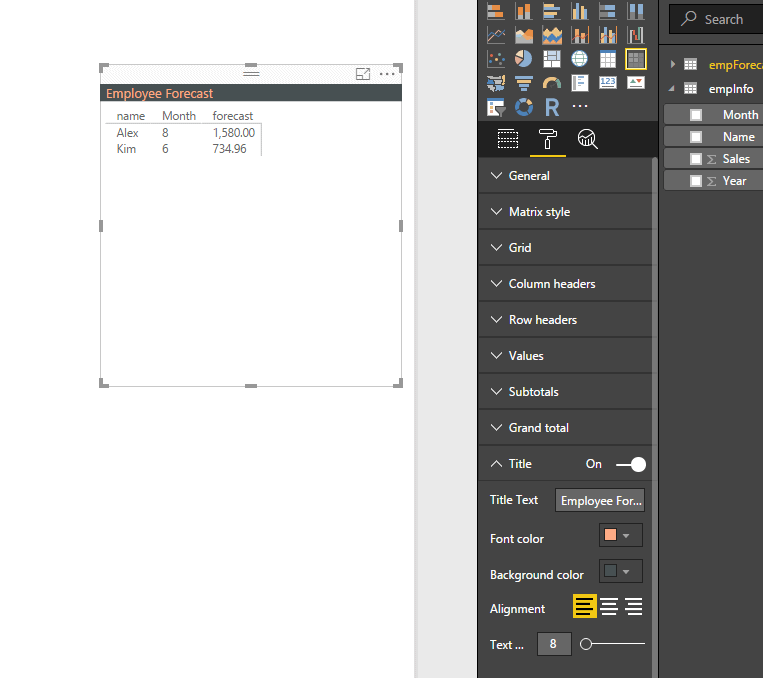
![]() This option allows us to format the table. I have enabled the title option and given a title to the object. In a similar way , you can change the background color, font color , position of object and many more things using the format option.
This option allows us to format the table. I have enabled the title option and given a title to the object. In a similar way , you can change the background color, font color , position of object and many more things using the format option.
Because we are using the Direct Query feature, any change in table values will, in real time, reflect in dashboard, without refreshing the dashboard.
Let’s see how DirectQuery feature is performing real time update.
Open SQL server management studio and run below command to update kim’s employee data for 5th Month, from Sales 700 to 1500 and re-calculate the forecast.
|
1 2 3 4 |
update empinfo set sales=1500 where Name='Kim' and Month=5 go Exec [dbo].[sp_EmpForecast] 'Kim' go |
Go back to PowerBI report and select the EmpForecast table. From the report filter ,select ‘Employee Name=Kim’. You will see that the Forecast value for Kim is updated.
Conclusion
In this article, we have covered in detail how to run an R script from SQL Server. We’ve demonstrated how to run the ‘Forecast’ package in R, but you should be able to run any algorithm, package or script in R within SQL Server and send the results back to SQL database. We have covered an overview of using PowerBI as an advanced visualization tool to do real time data analysis. I hope that this provides you enough information to start using these tools, and to use them to create a complete BI solution.
Load comments