
Since the days of SQL Server 6.5, Microsoft has been trudging steadily into the world of business intelligence (BI), conquering territory and spreading the BI gospel far and wide. No longer seen as merely an adjunct to SQL Server, BI appears to have taken center stage, with SQL Server secondary to the greater BI initiative. Yet SQL Server remains at the heart of Microsoft’s BI drive, as it was in the beginning and continues to be through the pending release of SQL Server 2016. Whenever Microsoft or its cronies bandy about the term BI, you can bet that SQL Server or one of its offspring is lurking in the background.
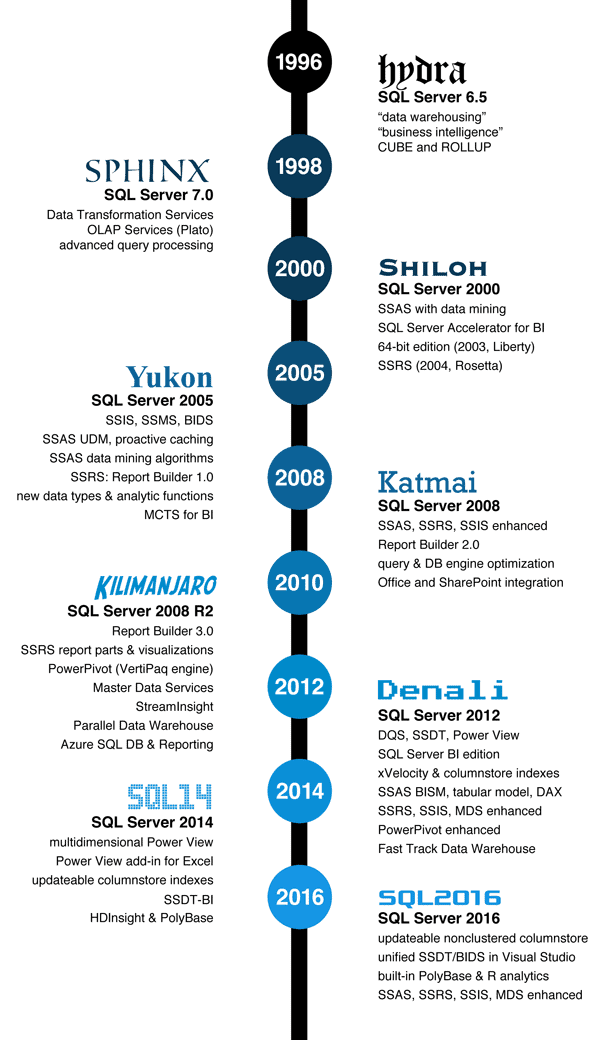
1996 â Hydra â SQL Server 6.5
SQL Server 6.5 was, of course, not the first version of SQL Server (nor was it quite 6.5, if incremental numbering means anything), but it wasn’t until this version that we started to hear terms such as business intelligence and data warehousing spoken with any conviction in the presence of the SQL Server, young upstart that it was.
Perhaps the most notable of the 6.5 features to qualify for BI status were the new ROLLUP and CUBE operators in T-SQL, which you could use when grouping and aggregating data to include summarized information in your returned data. The ROLLUP operator added totals and subtotals to the aggregated data, and the CUBE operator added aggregated summaries across the various combinations of dimensional values. Together the two operators helped to usher in an era of more complete and in-depth reporting.
1998 â Sphinx â SQL Server 7.0
In 1996, Microsoft acquired online analytical processing (OLAP) technology from Panorama Software Systems of Tel Aviv. What made this acquisition particularly noteworthy was not so much the fact that Microsoft had purchased yet another product, but rather that the company, two years later, rolled that product into its database management package with the release of SQL Server 7.0. Dubbed OLAP Services (codename Plato), the new technology not only brought sophisticated analytical capabilities to small and midsized business, but it also helped make BI a household name, ushering in a new era of data sense and sensibilities. Best of all for Microsoft, the concept of BI soon became inextricably tied to the SQL Server product, which continues to be the case today.
SQL Server 7.0 also shipped with Data Transformation Services (DTS), a processing engine with a drag-and-drop interface for performing the extract, transform, and load (ETL) operations often essential to a complete BI solution. With DTS, data developers could pull data in from a myriad of data sources and easily transform the data, all with a few well-placed drag-and-drops and perhaps a bit of scripting. Although not as elegant a tool as some would hope, it was a start, and it brought much needed attention to the importance and complexities of ETL operations and how integral they were to effective BI solutions.
SQL Server 7.0 also came with advanced query optimization aimed at addressing the types of queries typical to a data warehouse, such as a star query join with a large central fact table. In addition, SQL Server 7.0 introduced parallel execution for queries, breaking a query into subtasks and distributing them across multiple processors.
2000 â Shiloh â SQL Server 2000
With the release of SQL Server 2000, Microsoft changed the name of OLAP Services to SQL Server Analysis Services (SSAS) and added data mining to help complete its analytical capabilities. The data mining features were based on an open and extensible implementation of the OLE DB for Data Mining specification and included data mining algorithms developed by Microsoft Research. The OLAP services themselves also underwent a number of changes, with the introduction of new cube, dimension, and hierarchy types, as well as enhanced cube functionality.
At the same time, Microsoft released the SQL Server Accelerator for Business Intelligence, which provided a template for creating BI solutions based on SQL Server technology. In addition to extensive documentation, the accelerator included such components as a staging database, format files, processing scripts, DTS packages, and an empty SSAS cube.
SQL Server 2000 also provided updates to DTS, including new tasks, enhanced logging, and a new multiphase data pump. Plus, you could now save DTS packages as Visual Basic files.
In 2003, Microsoft upped the ante by releasing a 64-bit version of SQL Server, demonstrating that the company was as serious about enterprise scalability as it was BI. Then in 2004, too excited to wait for the next version of SQL Server, Microsoft released SQL Server 2000 Reporting Services (SSRS), an important piece in the BI puzzle. Not only could any size organization use SSRS to create reports based on SQL Server and SSAS data, but also to manage and distribute those reports, making SQL Server a more complete and valuable BI tool than ever.
2005 â Yukon â SQL Server 2005
Microsoft might have been making inroads all along on the BI front, but it was SQL Server 2005 that showed the world Microsoft’s true BI ambitions. First, DTS was given the axe and replaced by SQL Server Integration Services (SSIS). The new and improved ETL tool was more powerful and better designed and a welcomed relief from many of the DTS frustrations. SSIS offered both a control-flow engine and data-flow engine that made developing ETL packages easier and running those packages more efficient.
To facilitate SSIS development, as well as SSAS and SSRS, SQL Server 2005 also introduced Business Intelligence Development Studio (BIDS), an integrated development environment (IDE) based on Visual Studio technology. BIDS made it possible to design, test, and implement the various components of a BI solution from a single environment. The only thing missing was a database engine component. For that, SQL Server developers could turn to the new SQL Server Management Studio (SSMS), a robust and powerful replacement for both Enterprise Manager and Analysis Manager.
SQL Server 2005 also brought with it Report Builder, Microsoft’s first official foray into the world of self-service BI (Excel, notwithstanding). Report Builder provided an Office-like interface that let users build ad hoc reports that could include tables, charts, and other structure types.
Microsoft also updated SSAS with this release, adding new data mining algorithms and introducing the Unified Dimensional Model (UDM), a structure intended to make accessing various data models easier for the end user, regardless of the source type. The updated SSAS also brought with it proactive caching for better controlling how cube data was refreshed, thus providing SSRS reports with more up-to-date information.
The SQL Serer 2005 database engine also included a number of other changes important to BI, such as new data types and analytic functions. In addition, Microsoft added BI to its Microsoft Certified Technology Specialist (MCTS) certifications, with the introduction of the SQL Server 2005 Business Intelligence exam.
2008 â Katmai â SQL Server 2008
When it came to BI, SQL Server 2008 didn’t seem nearly as exciting as 2005, but it still had plenty of improvements. To begin with, Microsoft enhanced SSIS, SSRS, and SSAS in various ways. In SSIS, for example, Microsoft added ADO.NET as well as profiling components and improved lookup operations. SSAS offered enhanced cube and dimension designers. SSRS came with an updated designer interface as well as new data regions and data source types. And Report Builder moved on up to 2.0.
The SQL Server query engine also saw improvements with this release, with several enhancements around parallel query processing. One change, referred to as star join optimization, helped to improve query performance against a data warehouse. When the query engine detected a star schema, it used bitmap filtering to optimize the query plan. Another change centered on partitioned tables. Under certain conditions, the optimizer could deliver better performing queries and index operations.
SQL Server 2008 also seemed to be the release that Microsoft wanted to emphasize the three-way marriage between SQL Server, BI, and Office. Not only did Report Builder take on an even more Office-like aura, but Microsoft also provided data mining add-ins for Excel to tie into SSAS data. In general, Microsoft seemed more intent than ever to point out how report data could be rendered in Excel or Word, SharePoint could be used to display reports, and PerformancePoint could let users monitor, analyze, and plan business activities.
2010 â Kilimanjaro â SQL Server 2008 R2
With the release of SQL Server 2008 R2, Microsoft stepped up its Office integration and self-service BI strategies by offering PowerPivot for Excel and SharePoint. PowerPivot was an in-memory technology built on the VertiPaq columnstore engine, providing end users with powerful capabilities for performing analytics within familiar and available environments. Excel users, for example, needed only to install the PowerPivot add-in to be quickly be working with large tables of data, while taking advantage of Excel features such as being able to generate PivotTable and PivotChart reports.
Microsoft also released Report Builder 3.0, making it more powerful and user-friendly, while providing an assortment of new visualizations. SSRS itself also benefitted from a bigger, better, and brighter set of visualizations. In addition, the service now offered report parts, report components such as tables or charts that could be published to a report server or SharePoint site so those components could be integrated into other reports.
SQL Server 2008 R2 also introduced Master Data Services (MDS), a master data management solution for consolidating disparate information from across the enterprise into a centralized repository of clean and accurate data. MDS provided a tool for creating a single version of the truth that addressed the discrepancies typically found between related, but separate, sets of information.
This release of SQL Server also gave us StreamInsight, an event-processing engine that offered a high-throughput stream processing architecture built on the .NET Framework. StreamInsight promised to let developers quickly implement robust and highly efficient event processing applications. It was also right around this time that Microsoft was spinning up SQL Azure Database and SQL Reporting, along with Parallel Data Warehouse, designed to support massive warehousing workloads.
2012 â Denali â SQL Server 2012
SQL Server 2012 continued to demonstrate Microsoft’s commitment to its BI strategy. Not only did Microsoft enhance SSRS, SSIS, and MDS, but the company also added the tabular model to SSAS, which was part of a larger architecture that Microsoft referred to as the BI Semantic Model (BISM). The BISM umbrella provided a way of delineating the traditional SSAS multidimensional model and its Multi-Dimensional Expression (MDX) language from the new tabular model, with its Data Analysis Expression (DAX) language.
SQL Server 2012 also updated PowerPivot (whose name would at some point morph to Power Pivot) and introduced Power View, an SSRS add-in for SharePoint Server. Power View provided users with an interactive environment for exploring data and creating visualizations in order to build ad-hoc reports. Power View helped push self-service BI even further by providing a reporting tool for users such as data analysts and information workers.
The new SQL Server also introduced Data Quality Services (DQS), a system that let users build their own knowledge bases and use them to perform data quality tasks, such as correcting, standardizing, enriching and de-duplicating data.
In addition, the database engine now supported columnstore indexes, which were based on xVelocity, an advanced in-memory storage and compression technology. xVelocity had its roots with the VertiPaq technology used for PowerPivot but was adapted to the new columnstore indexes. The indexes stored data in a columnar format, unlike traditional B-tree structures, and organized the data into individual columns that joined together to form the index, offering improved performance for queries that summarized large quantities of data.
SQL Server 2012 also replaced BIDS with SQL Server Data Tools (SSDT), causing a fair amount of confusion in the developer community. To begin with, SSDT was a product separate from SQL Server, although it appeared as though it could be installed with SQL Server. What added to the confusion was that there were two versions of SSDT: one BIDS-like version and one for application developers looking to add a SQL Server component to their solutions. It took some effort, but users were eventually able to figure out what they needed and to get it up and running.
The SQL Server 2012 product family also offered an official BI edition for the first time, referred to (not surprisingly) as the SQL Server 2012 Business Edition, which fell somewhere between the Standard and Enterprise editions. At the same time, Microsoft gave us something called the SQL Server 2012 Fast Track Data Warehouse reference architecture, a set of resources for accelerating data warehouse deployments based on SQL Server 2012.
2014 â SQL14 â SQL Server 2014
Unofficially dubbed “SQL14” by some, SQL Server 2014 came and went with a bit less BI fanfare than we saw with SQL Server 2012. That said, it still contained some new or improved BI features worth noting. For example, Microsoft released an Excel add-in for Power View, although it was sometimes considered a Power BI feature, rather than SQL Server. In addition, when Power View was implemented via SSRS in SharePoint mode, it could now handle multidimensional data from SSAS OLAP cubes, a capability not available to the new Excel add-in.
Microsoft also released SSDT-BI, which the company referred to as the replacement for BIDS, confusing even more those who thought BIDS had already been replaced with the release of SQL Server 2014. SSDT-BI supported SSAS, SSRS, and SSIS projects, but only for SQL Server 2014. Backward compatibility remained a pipedream. In addition, SSDT-BI was not part of the SQL Server installation process and had to be downloaded and installed separately.
SQL Server 2014 added support for updateable clustered columnstore indexes, which let users modify and bulk-load data. Nonclustered columnstore indexes were still supported, but they also still could not be updated.
It should also be noted that around this time Microsoft made significant headway with HDInsight and PolyBase, ceding to the ever-mounting hype around Big Data. Although HDInsight, an Apache Hadoop solution, was already making waves during the SQL Server 2012 era, Microsoft seemed to be pushing harder than ever as SQL Server 2014 drew near, culminating in the release of PolyBase, a T-SQL front-end tool for querying data stored in a Hadoop/HDFS cluster and other data stores. At the same time, Microsoft continued to pull Azure into the picture by providing better integration across all systems.
2016 â SQL2016 â SQL Server 2016
And that brings us to SQL Server 2016, with its rumored codename of “SQL2016.” Microsoft apparently has a number of new and improved BI-related features in mind for the next release. As starters, SSDT and BIDS will evidently become more unified within its Visual Studio shell, making it backward compatible with previous versions and raising hopes that Microsoft will finally get SSDT right. And we might finally be able to script to SSAS tabular data from within the SSDT environment.
From all appearances, Microsoft is planning to enhance all the major services. SSIS, for example, will introduce new AlwaysOn capabilities and incremental package deployment. MDS will get a security and performance facelift. SSAS will see new DAX functions and parallel processing capabilities. Even SSRS will be receiving a few upgrades, such as enhancements to the subscription features. And this time around SQL Server will be getting updateable nonclustered indexes
Perhaps the biggest news with the imminent SQL Server 2016 release is that the R analytics platform will be integrated into SQL Server. Data scientists will now be able to run their R code within a sandboxed process in order to perform real-time analytics. These analytical capabilities will be further augmented by the fact that PolyBase will also be built into SQL Server 2016, allowing developers to use their existing T-SQL skills to extract data from both structured and nonstructured sources.
SQL Server and Beyond
Predicting what might come next is never easy, but Microsoft’s strategy for SQL Server and BI will no doubt include expanding even more the role of cloud services, most notably around the Office offerings. Data streaming and real-time analytics will also likely continue to gain ground, particularly with the onslaught of messaging around the Internet of Things (IoT), as will the expanding role of self-service BI.
Whatever Microsoft decides to do, integration and interoperability across systems and services will likely hold the key, with branding seemingly secondary to the need for open standards and shared communications. How the stand-alone, on-premises SQL Server product will hold out over the long haul is yet to be seen, but it doesn’t appear to be going away anytime soon, despite naysayer predictions of eventual NoSQL domination. As Yogi Berra reportedly said long before relational theory stole home plate, “It ain’t over till it’s over.”
It never is, especially when it comes to Microsoft.
This document contains proprietary information and is protected by copyright law.
Copyright © 2026 Red Gate Software Limited. All rights reserved


Load comments