
Over the years Power BI has evolved into a complex and varied ecosystem of tools and solutions, which in its turn demands several supporting roles: there are, of course, developers, data engineers and data scientists, but there is need for one more, i.e. a capacity administrator. Of course some of these roles may be covered by one person, but the roles are distinct in their nature as well.
Capacity Administration
The role of the capacity admin is to oversee and make sure that all tools and users are playing well together, and sometimes there is need for a hard proof that something is wrong before it can be fixed. This article describes the process of how the capacity admin gathers enough data from the Fabric Capacity to helps the developers finetune their solutions and get the most value from the software, as well as the insights the programmers provide.
As part of the Capacity administration tasks, a PowerBI admin needs to monitor and finetune the performance of the environment, while providing best practices guidance to the developers which are publishing the reports to the shared environment. I have seen both sides in the past – I have been a Power BI developer for many years, optimizing performance and fighting for shared resources, while in the past year I have been in the Power BI Admin. These are two different points of view, especially because the developers have their tools (Power BI Desktop, DAX studio, Power BI Desktop profiler, and so on) which give them granular performance data from the local environment, while the Admins have their tools which can see the bigger picture of the resource utilization in reality from the shared environment where the published reports are.
Wouldn’t it be best to have both views combined and thus creating a much reliable and better performing environment?
For an admin, one way to get a good overview of the Premium Capacity and its resource usage is to use the Fabric Capacity Metrics app which is provided by Microsoft. (For more info, read here: https://learn.microsoft.com/en-us/fabric/enterprise/metrics-app)
In my previous article “What is Microsoft Fabric all about?” I explained how the resources of the Power BI capacities are expected to work and what triggers the throttling. But, in short, when we use Power BI services, we get the processing capacity we have subscribed for, and once we exceed it, the users of the entire capacity get “punished” by getting throttled or even rejected. Recently a team of developers managed to bring down an entire Power BI Premium capacity by publishing a single report without testing it, and without knowing how to monitor its performance on the Power BI portal after publishing it.
One Problem Is The Variability
At times a capacity may be completely adequate, but at other times there might be significant resource pressure, which if encountered for longer periods of time may mean throttling of the resources for all of the Premium Capacity constituents. When this occurs, all users and all workspaces will likely suffer the delays of a slowed down environment. A real-life example is how a single report was able to bring down an entire capacity due to having more than 10 nested levels of DAX in its measures, and by using the techniques described in this article, the admin together with the developers were able to restore the service quickly. Furthermore, there were some learnings on how to proactively investigate and prevent future outages by using the described techniques.
Of course, one way to deal with throttling caused by resource overutilization is to enable the AutoScale function. This would work well in cases when the Capacity is used for critical production reports and the stakeholders have endlessly deep pockets.
Sooner or later, however, it would be a great idea to do some performance tuning.
Viewing the Metrics
If we turn to the previously mentioned Fabric Capacity Metrics app, we might find something similar to this in the metrics report:
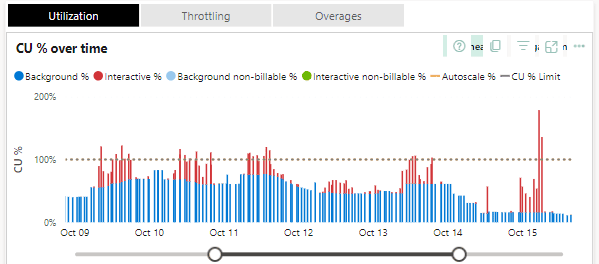
Looking further in the details, we might find which workspaces and which objects within them are causing the most pressure:

Finally, in the Fabric Capacity Metrics report we can also view a short list of statistics about the operations which take the most resources:
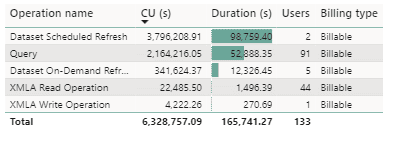
In this case we may think that this particular dataset is a great candidate for a performance tuning session, since we see that the Query is used by 91 users and is taking an enormous amount of CU seconds.
So far, this is the viewpoint of the Admin, and given that the Admin is actively monitoring the system, he / she will send a clear message to the developers that there is a great opportunity for optimization.
What would the developers do, though?
As mentioned before, the PowerBI developers use the PowerBI Performance Analyzer (by clicking on the Optimize tab in PowerBI desktop), which is a great tool in the PowerBI Desktop:
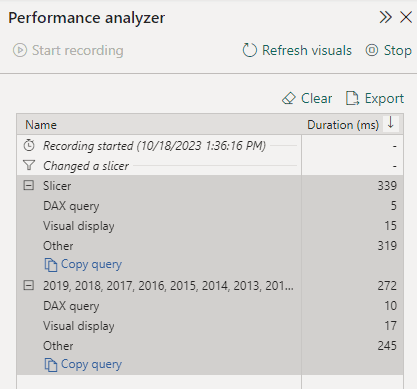
It gives insight into the query durations; we can even copy the DAX queries and finetune them in DAX Studio. We could even attach the local machine Power BI desktop process to the DAX Studio and replay and finetune the DAX queries in the context of the local developer’s machine.
Performance Analyzer, is not enough when it comes to the performance of the reports and the datasets in the Power BI Service portal. There are other factors at play in the Service Portal and the environments may be drastically different. For example, there might be a VPN in the way, or maybe the data transfer is different between the cloud services based on where the developer’s machine is– all of this would make the debugging much harder on our local development machines. Furthermore, there usually are various usage patterns of the datasets and the reports in the Service Portal, at times it may happen that everything works in a predictable way during development, but when the users touch the system, we get unexpected results.
This is the same challenge we have had in database development and query tuning for decades, and this is why there are so many posters and T-Shirts with the words “But it worked on my machine…”
This is the main reason why we would try and get performance analytics data from the portal and would not solely trust the reality of the developers’ machines.
In this case we know which reports and datasets use the most resources, but we need the tools to gather their performance metrics in context, not only on our development machines. In database development and query tuning, the next logical step would be to turn to our extended events and see what happens in the environment where the objects are.
SSMS
The next tool which comes to mind is the SQL Server Management studio, after all we can connect to SSAS objects and use extended events to trace what is hurting our performance.
We can easily do this for on-prem SSAS instances:
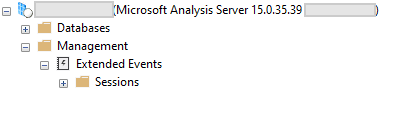
But if we try to connect to the PowerBI service, we simply do not see the Management section:

We can use extended events in the case of an on-prem Analysis Services, but it is not allowed for use when we connect to the Service portal.
Profiler
Luckily, in this case we can turn to the good-old (already deprecated) SQL Server Profiler. There are Extended events available for the on-prem Analysis Services, but there are none available for the Azure Analysis Services.
There are a few considerations, however. First, the Profiler will only work with Datasets published in a Premium workspace (Premium, Premium-per-user or PowerBI embedded. ). Second, we can only run a trace for one dataset at a time.
To trace a dataset, we need to be able to connect to the Workspace XMLA endpoint.
To use the XMLA endpoint feature there are couple of admin settings, which need to be enabled by the Power BI admin first:
- The XMLA endpoint for the Capacity needs to be enabled.
- The Allow XMLA endpoints and Analyze in Excel with on-premises datasets should be allowed on a tenant level and the user who will perform the tracing needs to be on the allowed user list.
To run a trace for a dataset, the first thing we need is the XMLA endpoint connection string. It is in the format of
|
1 |
powerbi://api.powerbi.com/v1.0/[tenant name]/[workspace name] |
The easiest way to get it is to go to the Premium Workspace, click on Settings > Premium > Workspace Connection and copy the string.
Starting the trace
As promised, now we will start working with the Profiler. We select Server Type to be Analysis Services and we connect to the XMLA endpoint with whatever authentication method is needed.
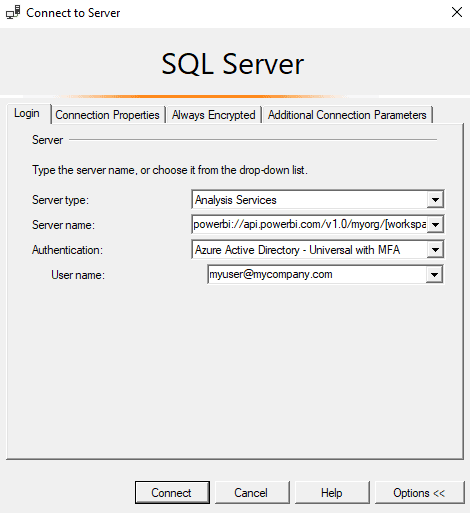
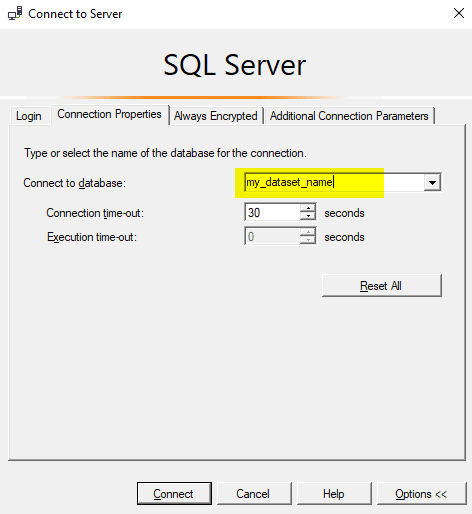
It is very important before clicking Connect here to go to the Connection Properties tab and to specify the dataset name:
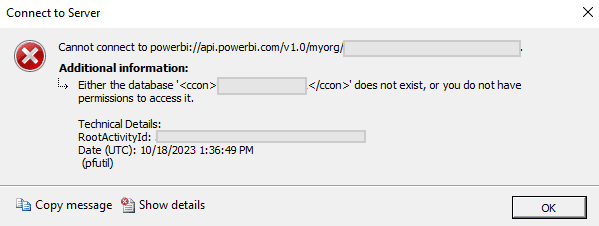
If the dataset name is not specified correctly, then an error will appear like this
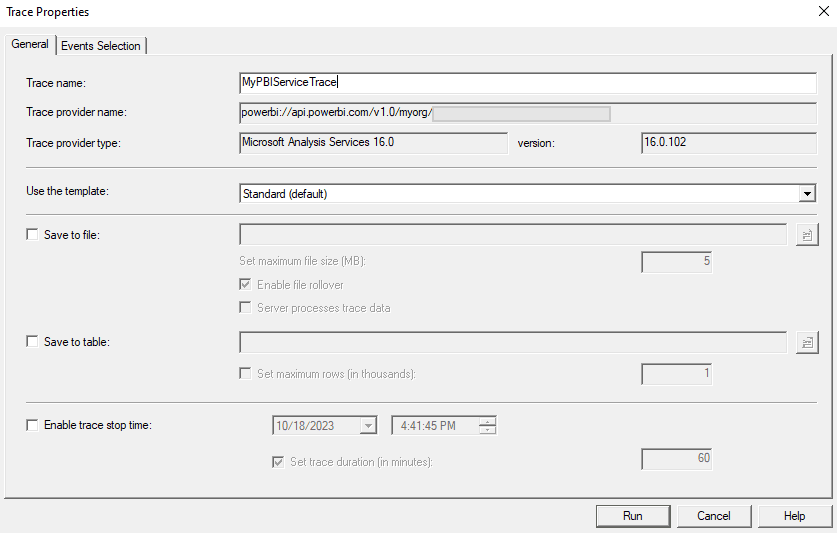
And now we can click on Connect and choose what events we want to collect. For this guide we can just select the Standard template
When we click on Run, we will start getting some real-time events captured:
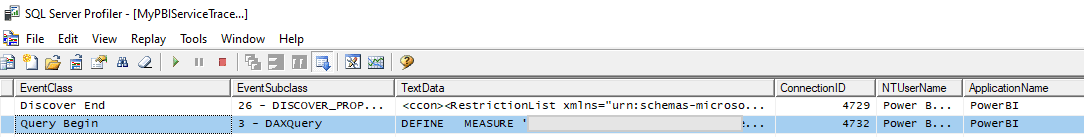
Note that there is a XML chunk at the end of the Query Begin event, which contains some valuable session information. First of all, we have captured the actual DAX query, and we also have some context information. If we format it, it looks like this:
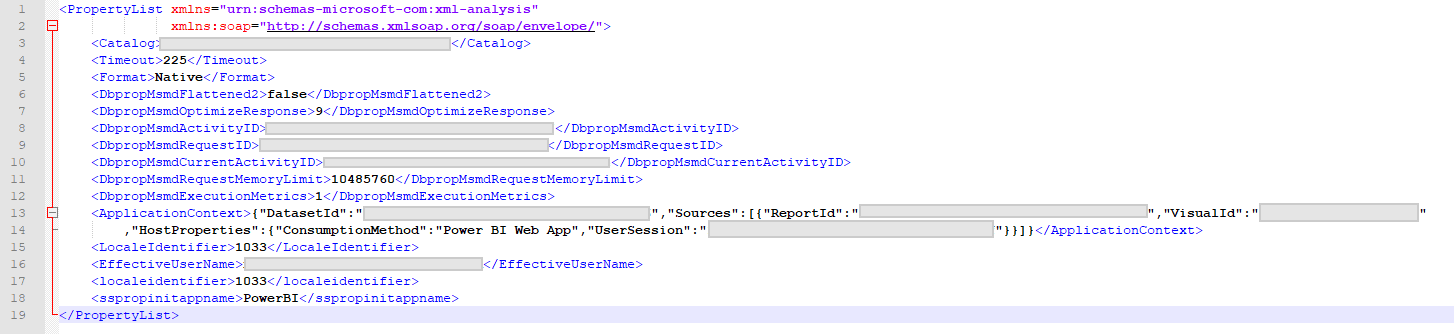
This is a great set of information, since it gives the developers some real insight of the performance of their dataset in context. The developer can see who the user was, what the application context was, and what the performance metrics were for each interaction. This information can be used for taking the DAX query and finetuning it, but also from this information we know the exact user who submitted the request, and we may talk to them about their needs – it may turn out that there is an easier way to get the work done. We also know which report and which visual is consuming the resources, and thus we can revisit those items.
From here on, the developers may take the best candidates for query optimization and they may work their way through optimizing the resources of the shared capacity.
A broader approach to performance tuning
So far, I mentioned the ad-hoc way to use SQL Server Trace tool to capture valuable information about the datasets and query performance in a Power BI Premium workspace.
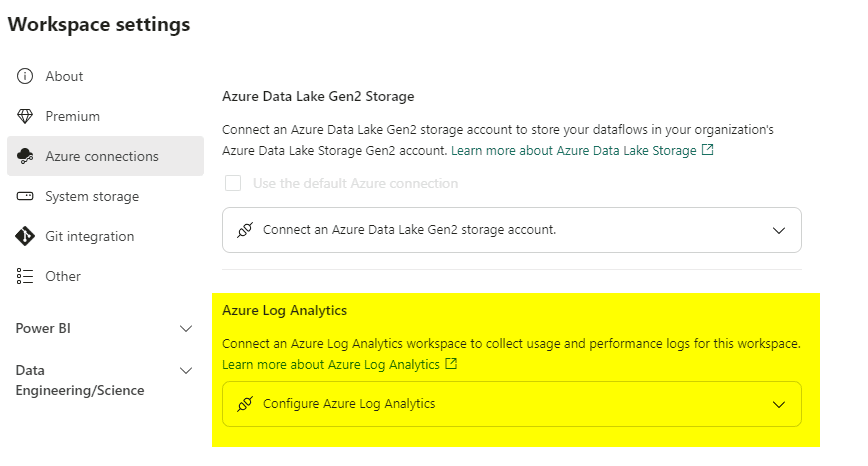
There is, however, another way to capture performance information from a Power BI Workspace which is assigned to a Premium Capacity: each workspace can individually be added to a Azure Log Analytics workspace.
This is fairly simple to do – all we need to do is to create a Azure Log Analytics and go to the Workspace Settings and then to the Azure Connections tab and point to the Azure Log Analytics environment we wish the data to be stored in.
There are some important differences between Trace and Log Analytics, however.
For example, several developers can run a trace at any time when they are testing the environment, and this trace would not cost anything. The trace can be started and stopped at any time.
Log analytics collects data continuously and it incurs costs. Furthermore, specific permissions need to be granted and managed for the Log Analytics workspace, which creates a bit of administration work.
Another aspect which is most visible for me as a Power BI Global admin is that with the Trace, I am able to audit different datasets without worrying whether the workspaces are already added to some instance of Log Analytics or not, and whether I have access to it. This really helps me have quick conversations with the Power BI developers and do ad-hoc pear-programming and tuning sessions.
How Log Analytics works
Here is how it works: when we connect a workspace to Log Analytics, the data starts flowing to a predefined log called PowerBIDatasetsWorkspace (here is the official documentation for it: https://learn.microsoft.com/en-us/azure/azure-monitor/reference/tables/PowerBIDatasetsWorkspace)
It takes some time for the data to get flowing in the logs, as I have experience it, it takes about 5 minutes to get the data in.
When the data is in the Log, we can use KQL to query it, for example here is a query which gives us the average query duration by day for the last 30 days.
|
1 2 3 4 5 |
PowerBIDatasetsWorkspace | where TimeGenerated > ago(30d) | where OperationName == 'QueryEnd' | summarize avg(DurationMs) by format_datetime(TimeGenerated, 'yyyy-MM-dd') |
The result of this query is trivial and it wont tell us much.
We could perhaps spend some time and write a more advanced KQL query, which gives us query count, distinct users and average duration per workspace for the last 30 days:
|
1 2 3 4 5 6 7 8 |
PowerBIDatasetsWorkspace | where TimeGenerated > ago(30d) | where OperationName == "QueryEnd" | summarize QueryCount=count() , Users = dcount(ExecutingUser) , AvgCPU = avg(CpuTimeMs) , AvgDuration = avg(DurationMs) by PowerBIWorkspaceName |
The result may look like this:
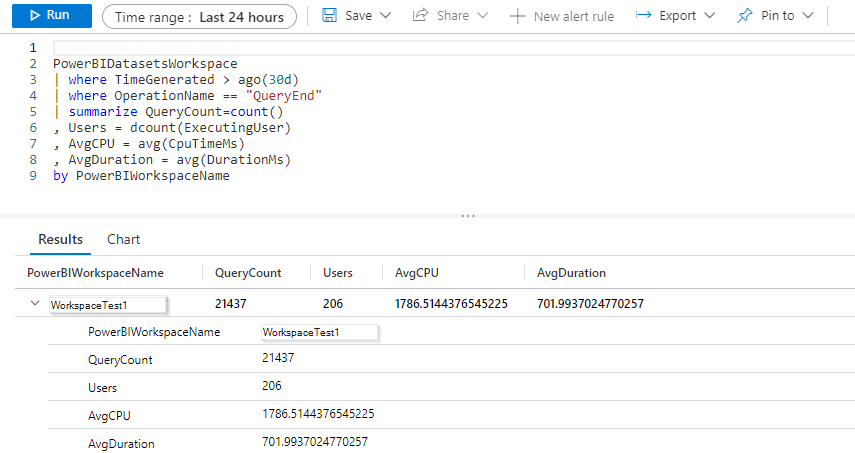
What we see here is a simple aggregation of resource usage over time for our Premium Capacity – how many queries vs. how many users and the aggregated CPU and Duration. This particular query can be used as an overview, but it is also worth noting that the underlying data is quite granular and we can filter by a specific user or even look for specific patterns within the submitted queries.
For further dive into KQL I would recommend the official documentation as a starting point: https://learn.microsoft.com/en-us/azure/data-explorer/kusto/query/
As mentioned, there are options: we can either go for the ‘on-the-spot’ profiling or we can opt out for collecting log data for our workspaces and query it later.
After all, it is an iterative process, because after the finetuning sessions (whether with the help of the Trace or the Log Analytics), the developers may ask the Power BI admin for another view of their Performance Metrics report, as a guidance to how their work has improved the environment as a whole, and the admin may help them find out what the overall health of the environment is.
In this article we saw the different views of a Power BI admin and a Power BI Developer: their tools, options, and workloads.
Happy debugging!
This document contains proprietary information and is protected by copyright law.
Copyright © 2026 Red Gate Software Limited. All rights reserved


Load comments