
For many organizations, Microsoft Excel remains a critical tool for recording, calculating, and sharing data, especially when it comes to number crunching and disseminating vital information. Those workbooks contain a great deal of important data, and more and more organizations are looking for ways to visualize and subsequently capitalize on that information.
Given this trend, it’s no surprise that Power BI Desktop lets you import data directly from an Excel workbook into the Power BI Desktop environment. Not only can you retrieve data from the spreadsheets themselves, but you can also capture Power Pivot tables, Power View visualizations, Power Query queries (Get & Transform in Excel 2016), and other components.
If all you’re after is basic spreadsheet data, then the process of getting the information you need into Power BI Desktop is a relatively straightforward operation. However, it can be less apparent how to capture the other components, especially if the source workbook contains a mix of data such as spreadsheets, queries, and PivotTables based on Power View tables.
In this article, I walk you through the process of using Power BI Desktop to capture information from an Excel workbook that contains a mix of components. We’ll work with a local .xlsx file that contains data from the AdventureWorks2014 database on a local SQL Server instance.
For the purposes of this article, the source and nature of the data are secondary to getting the information you need into Power BI Desktop. You can use whatever data you want to create your test Excel file. However, it you plan to follow along with the examples in this article, the file should include a number of specific components, which we’ll go through shortly. In the meantime, if you’re new to Power BI Desktop, you might want to first review the previous articles I’ve written on the topic:
- Working with SQL Server data in Power BI Desktop
- Power Query Formula Language in Power BI Desktop
- More Power BI to your Elbow
Setting up the Excel file
Before we get into the nitty gritty of how to get data from an Excel file into Power BI Desktop, we need to set up our example source file. The file should include a basic spreadsheet, a spreadsheet table based on an Excel query, a PivotTable based on a Power Pivot table, and a Power View visualization.
Before creating the Power Pivot and Power View components, you might need to enable these features on your Excel installation, if you haven’t already done so. How you do this will depend on which version of Excel you’re using. Be sure to check the Microsoft documentation for details.
Regardless of what data you use to create the Excel file, it is important that you understand the components that go into the file in order to see what’s going on in Power BI Desktop when you try to import information from that file.
Let’s begin with the basic spreadsheet. For my example, I started by running the following sqlcmd command to create a .csv file:
|
1 |
sqlcmd -S localhost\sqlsrv16 -d AdventureWorks2014 -Q "SELECT BusinessEntityID EmpID, FirstName, LastName, CountryRegionName Region, TerritoryName Territory FROM Sales.vSalesPerson WHERE JobTitle='Sales Representative' ORDER BY EmpID;" -o C:\DataFiles\SalesReps.csv -s"," -W |
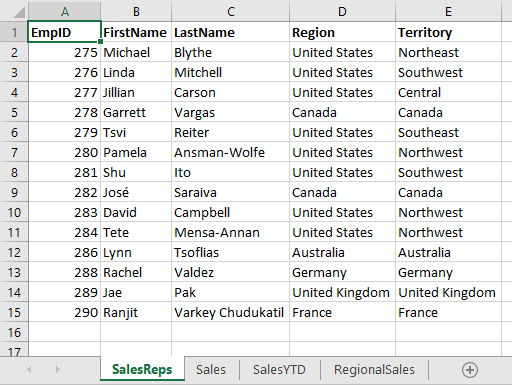
The command simply retrieves a subset of data from the vSalesPerson view into the .csv file. I then opened the file in Excel 2016, cleaned up the results to get rid of any double lines and comments, and then saved the file as an .xlsx file, giving it the name Employees.xlsx. This provided me with my initial spreadsheet, which I named SalesReps, as shown in the following figure.
Next I added a query to the Excel file, based on the following T-SQL statement:
|
1 2 3 4 5 |
SELECT BusinessEntityID EmpID, FirstName, LastName, SalesLastYear, SalesYTD FROM sales.vSalesPerson WHERE JobTitle='Sales Representative' ORDER BY EmpID; |
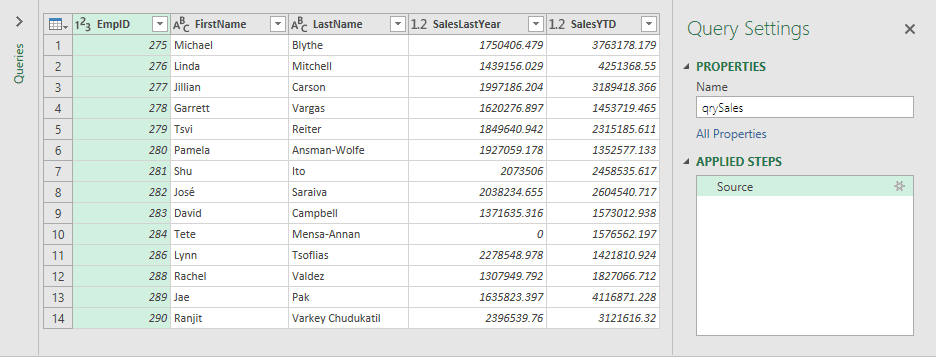
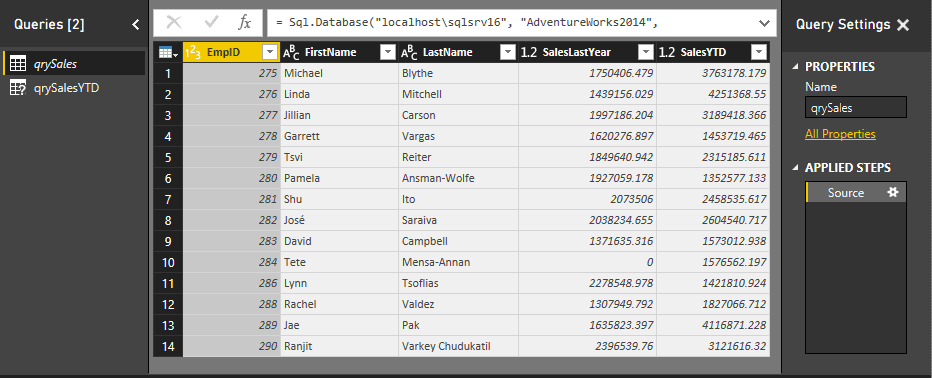
Like the preceding sqlcmd command, this statement also retrieves data from the vSalesPerson view in the AdventureWorks2014 database, but instead captures the sales figures for each sale rep. When setting up the query, I created a connection to the SQL Server 2016 instance, specified that a T-SQL query be used rather than a table or view, and named the query qrySales. The following figure shows the edit window for the new query.
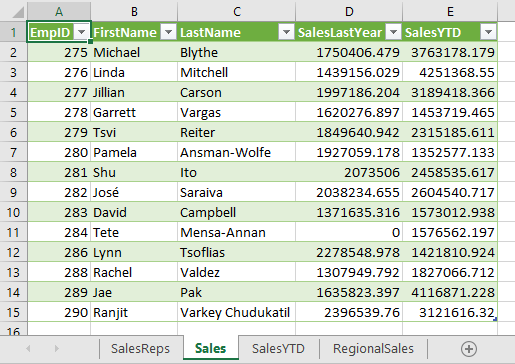
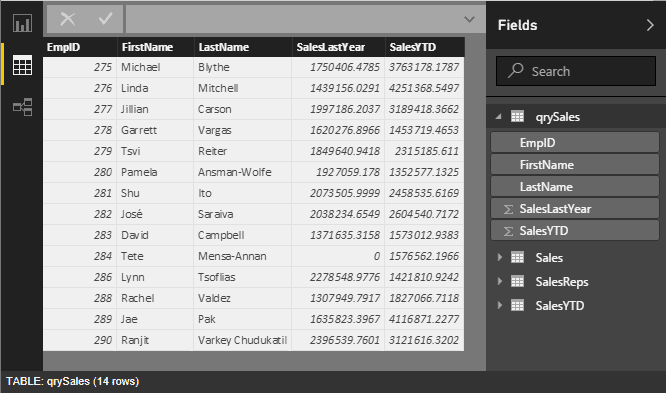
After I created the query, I sent the data to its own spreadsheet, which I named Sales. Notice that the data is rendered on the spreadsheet as a table, rather than just a simple range of data.
Next, I opened the Power Pivot management window and created a connection to an external data source (the same SQL Server instance as the query), basing the connection on the following SELECT statement:
|
1 2 3 4 |
SELECT CountryRegionName Region, TerritoryName Territory, SalesYTD FROM sales.vSalesPerson WHERE JobTitle='Sales Representative' ORDER BY Region, Territory; |
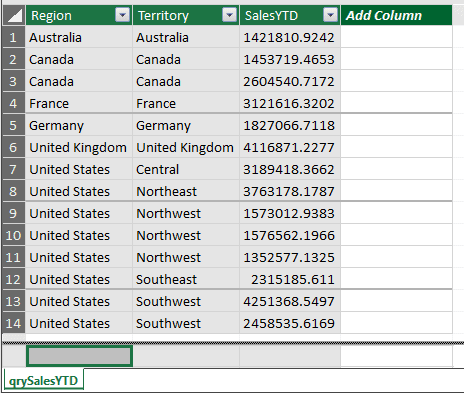
Again, we’re retrieving data from the vSalesPerson view. In this case, I named the query qrySalesYTD. After completing the process, Excel fetched the data and created a Power Pivot table with the same name, as shown in the following figure.
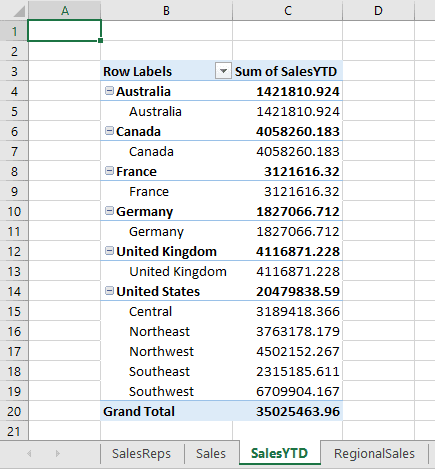
Next, I created a PivotTable based on the three columns in the qrySalesYTD table. I named the PivotTable SalesYTD, as shown in the following figure.
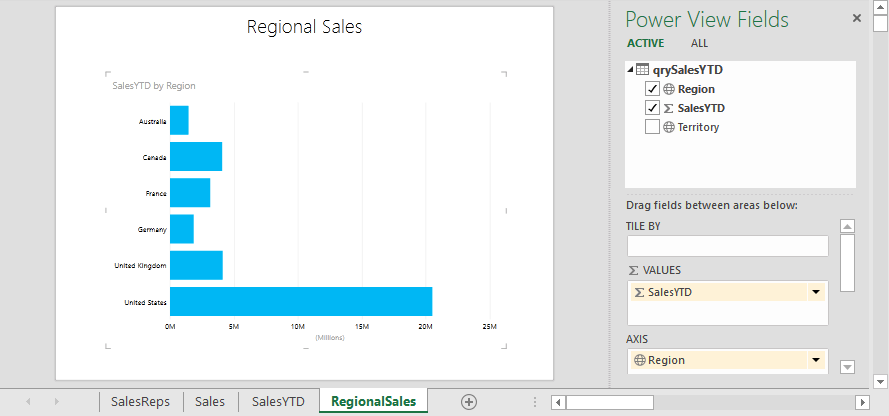
To finish setting up the sample Excel file, I created a simple Power View visualization based on the qrySalesYTD query. As the following figure shows, I named the Power View sheet RegionalSales.
This completes the sample Excel file. Just to sum up what I’ve done, the workbook now includes the following components:
- Spreadsheet named SalesReps
- Query named qrySales
- Spreadsheet table named Sales based on the qrySales query
- Pivot View table named qrySalesYTD
- PivotTable named SalesYTD based on the qrySalesYTD Power Pivot table
- Power View visualization named RegionalSales
Again, it’s not the data itself that’s important in this case, but rather the various Excel components. You need to understand what your worksheet includes in order to know how best to get the information into Power BI Desktop. As long as you’ve populated the components with some sort of data, you’re ready to pull that data into Power BI Desktop.
Retrieving information from an Excel workbook
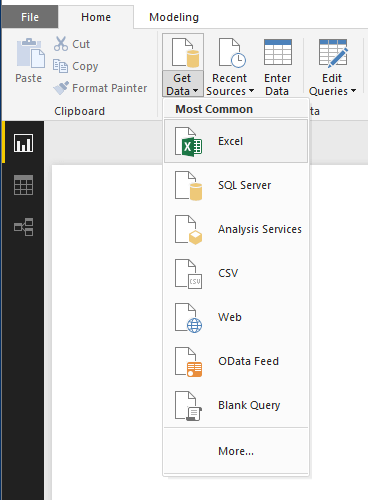
If you’ve worked in Power BI Desktop before, you’ve likely used the Get Data feature to import data from different sources, so you’re first instinct might be to go there to get the data from the Excel file, in which case, you’ll be quickly rewarded with an Excel option, as shown in the following figure.
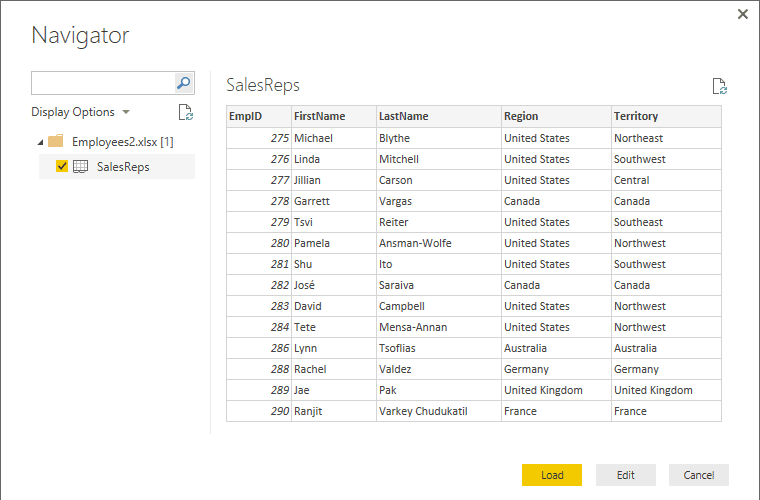
You can certainly use this option to get at some of the Excel information. Simply click Excel, navigate to your source file, and double-click it. Before long, Excel opens the Navigator dialog box, listing the components you can import, as shown in the following figure.
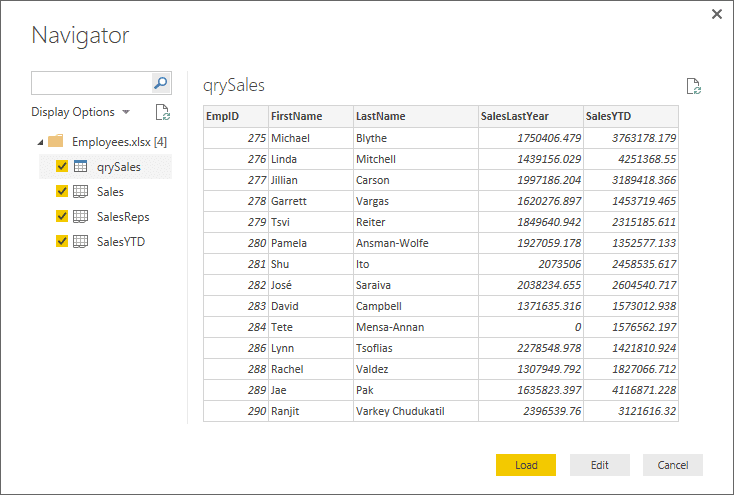
The Navigator dialog box gives us a choice of four components:
- Query named qrySales
- Spreadsheet table named Sales based on the qrySales query
- Spreadsheet named SalesReps
- PivotTable named SalesYTD based on the qrySalesYTD Power Pivot table
Within the Navigator dialog box, you can preview data for each component, and you can select any of the available components to load into Power BI Desktop. However, as you’ve probably noticed, a couple components are missing:
- Power Pivot table named qrySalesYTD
- Power View visualization named RegionalSales
We’ll get to these missing components shortly, but first let’s look at what we get when we load all four available components into Power BI Desktop. First, we’ll start in Data view, which shows the imported data from all four components saved to tables with the same names, as shown in the following figure.
Not surprisingly, the Sales table and qrySales table include the same data, so we really needed to import only one of those source components.
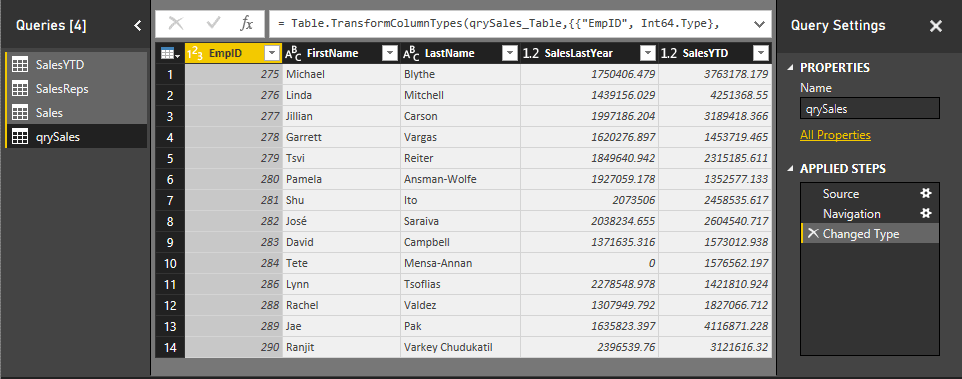
If we move on to the query editing window, shown in the following figure, we’ll also find that the four source components have been created as queries, which serve as the basis for the four tables. As a result, we can apply any of the transformations to the data that are available through the query editing window and then apply those changes to our tables.
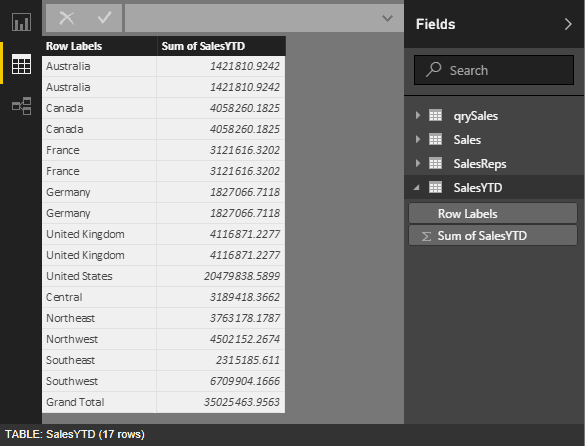
Now let’s return to the Data view and the SalesYTD table (or you can instead stay in the query editing window and view the SalesYTD query from there). What you’ll quickly discover is that Power BI Desktop flattened out our PivotTable, as shown in the following figure.
What this points to is that Excel data should be in a flattened form when you import it into Power BI Desktop so you don’t run into any surprises. In this case, it would be more efficient to bring in only the source table—the original qrySalesYTD Power Pivot table in Excel—and then create the reports we need in Power BI Desktop to render the data how we want it. But that leads us back to the fact that the Get Data import process does not include the Power Pivot table or the Power Query visualization.
Before we get into how that do that, however, let’s look at one more aspect of the Get Data import process. Suppose our Excel workbook did not include the spreadsheet table named Sales or the PivotTable named qrySalesYTD. If we were to try to import the stripped-down version of the workbook, the Navigator dialog box would present us with only one component available for import, the SalesReps spreadsheet, as shown in following figure.
It’s not surprising that the only spreadsheet object to appear is SalesReps, but what does seem odd is that the qrySales query no longer shows up. Apparently, Power BI Desktop will include the query only if the workbook also includes an associated spreadsheet table.
The conclusion to all this is that the Get Data approach is best suited for spreadsheets that contain only flattened data, whether in the form of a basic spreadsheet or data that has been turned into a table. For anything else, we need to look to a different approach for capturing the Excel components.
Importing the Excel file
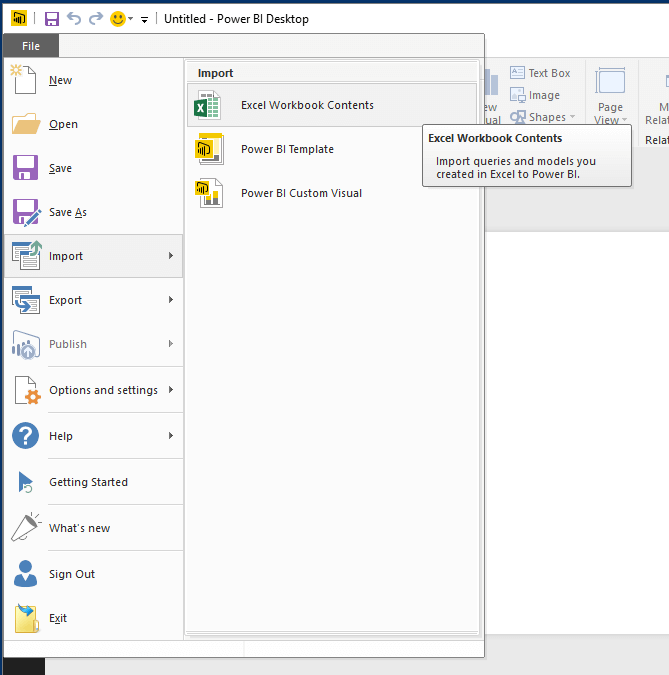
As we have seen, to use the Get Data method to capture an Excel query, the workbook must include an associated spreadsheet table, otherwise you need to take a different approach. In fact, for most non-spreadsheet components, you have to import the Excel file into the Power BI Desktop environment. To do this, click File, point to Import, and then click Excel Workbook Contents, as shown in the following figure.
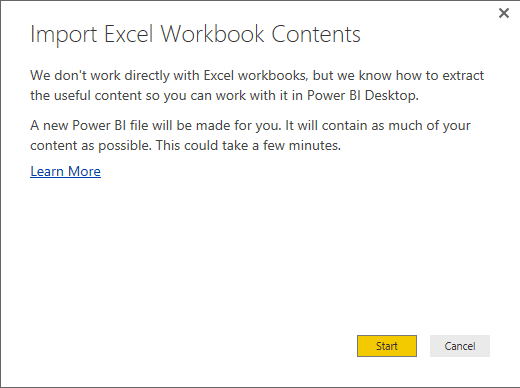
From there, you need to navigate to your Excel file and double-click it. Power BI Desktop will then present you with the following screen, which provides an overview of the import process.
When you click Start, Power BI Desktop imports the various non-spreadsheet components from the Excel file and eventually returns a summary screen, as shown in the following figure.
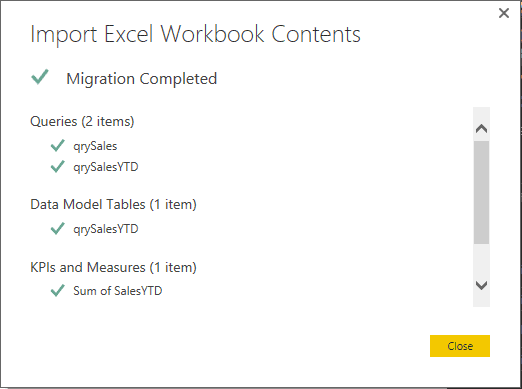
If you were to scroll down, you would also see the Power View visualization, giving us the following components:
- Query name qrySales
- Query named qrySalesYTD
- Data model table named qrySalesYTD based on the qrySalesYTD query
- Auto-generated measure named Sum of SalesYTD based on the qrySalesYTD table
- Power View sheet named RegionalSales
When you import an Excel workbook, it is an all-or-nothing proposition. You cannot select individual components. In addition, you cannot import spreadsheet data, such as that contained in the SalesReps spreadsheet. For that, you still need to take the Get Data approach.
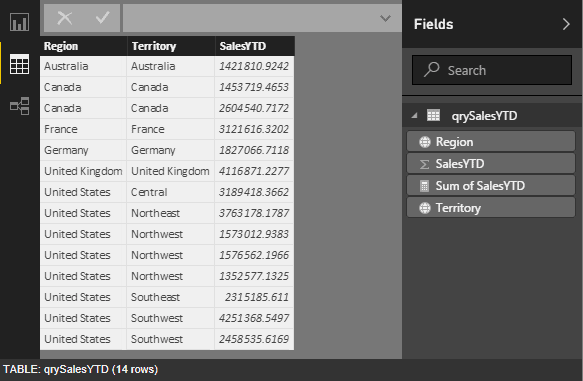
Now let’s look at what we do get with our import. Once again, we’ll start with the Data view. What you’ll quickly discover is that the only table included here is qrySalesYTD, as shown in the following figure.
Although the data in the qrySalesYTD table is what we would expect, it points to the fact that a table based on the qrySales query is missing. So let’s look go to the query editing window to see what might be going on. As the following figure shows, both queries are listed.
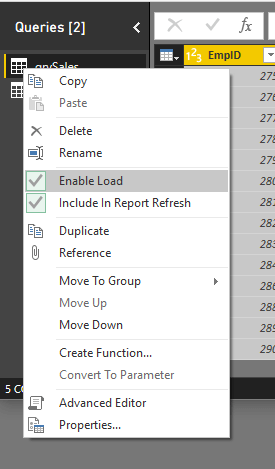
It turns out that we must specifically enable the qrySales query for the data to be loaded into a table. To enable the query, right-click the query name in the Queries pane and then click Enable Load, as shown in the following figure.
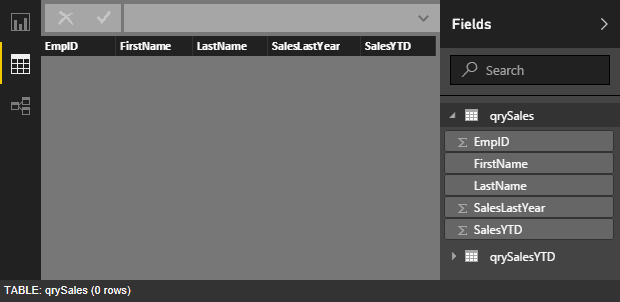
After you enable the query, close the query editing window, being sure to apply your changes, and then return to the Data view. You should find that the table has been added, but as you’ll see the following figure, it might not include the data.
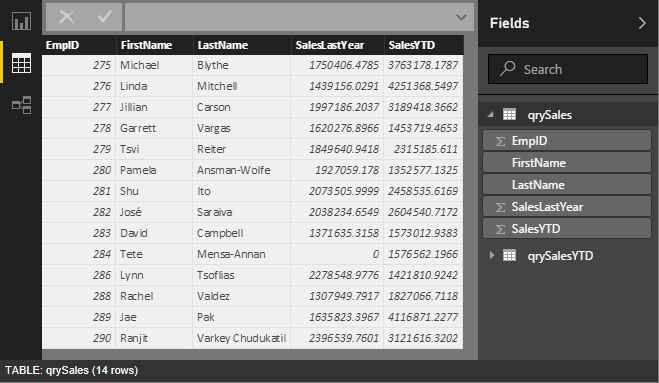
To get the data in there, you need to right-click the name of the table in the Fields pane and then click Refresh data. The table should now be populated, as shown in the following figure.
Now we have the data we need from the Excel query and the Power Pivot table that are in the source Excel file. The only other missing component is the Power View visualization. For that, we need to go to Report view. As the following figure shows, Power BI Desktop automatically adds a page for the visualization.
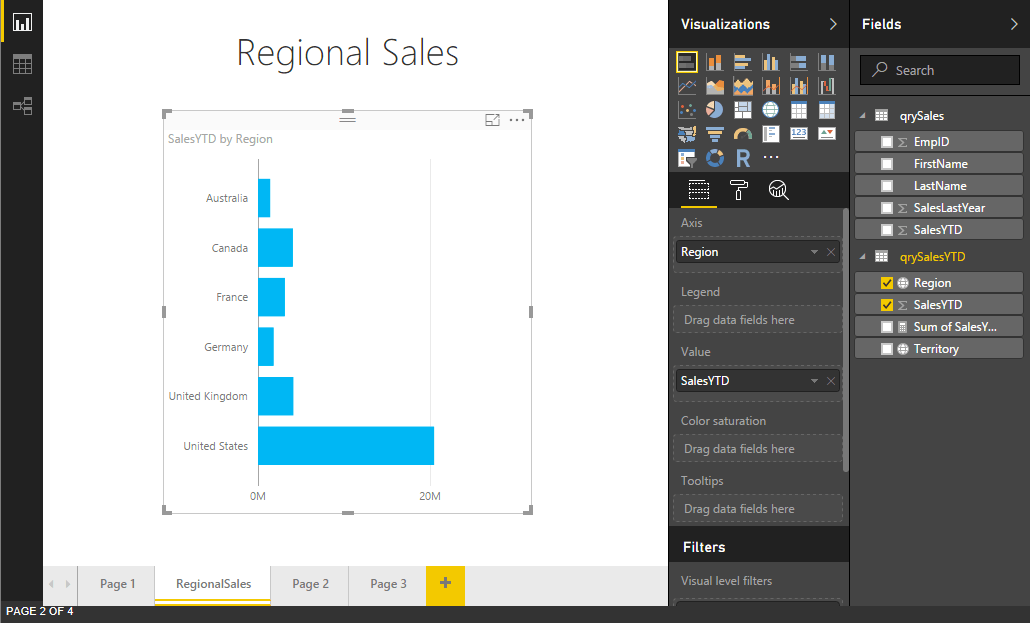
We can now change or modify the settings as we would with other visualizations. Like any Excel component that we import, once we get the information into Power BI Desktop, the data is no longer tied to the original Excel file, and we can do whatever we want.
That said, we must still deal with our wayward spreadsheet as a separate step, but even for that, once we have it in Power BI Desktop, we have free reign.
On the road to Power BI Desktop
We have two basic approaches for bringing Excel data into Power BI Desktop: the Get Data process and the import process. For the most part, we’ll use the Get Data process to bring in spreadsheets and use the import process to pull in the non-spreadsheet components.
Where things get a little tricky is if we have a spreadsheet table based on a query. (No doubt there are other tricky areas that I’ve yet to discover.) You can use the import process to bring in the query, in which case you have to take the extra steps of creating and populating your table, or you can use the Get Data process to bring in either the table or query. If the query exists without as associated spreadsheet table, your only option is to import the Excel file.
By using the Get Data and import processes, you should be able to capture most of the Excel data you need. You might run into a few limitations, such as some Power View and data model features not being supported, but overall Power BI lets you capture most of the available information. Once you have that information in Power BI Desktop, you can transform the data and create a variety of visualizations. You can then save file, share it with others, or publish your reports to the Power BI service.
This document contains proprietary information and is protected by copyright law.
Copyright © 2026 Red Gate Software Limited. All rights reserved


Load comments