

Welcome back to our journey of understanding MySQL performance tuning using MySQL Shell. So far, we’ve covered essential topics like configuring MySQL, optimizing memory and CPU usage, and enhancing disk I/O performance. These are important building blocks to ensure your MySQL server is running smoothly. Now, in this fourth part of the series, we will focus on network and query performance optimization.
Network settings and query performance have a significant impact on the overall performance of your MySQL server. In this article, we’ll see how we can use MySQL Shell to check and fine-tune settings in these areas for better performance. We’ll look at adjusting important network parameters, identifying and optimizing slow queries, and configuring the query cache, all within MySQL Shell. Whether you’re running a small database for an app or managing an enterprise-scale system, network and query optimization will help ensure your MySQL server remains fast and responsive.
When you think about database optimization, you probably picture speeding up queries or improving server response times. Both of these things are heavily influenced by how well MySQL handles network traffic and how efficiently it executes queries. If you have slow queries or network-related bottlenecks, even the most optimized server won’t perform as well as it should. That’s why network and query tuning is an important part of database performance.
MySQL Shell makes this process easier by giving us the tools to adjust network settings, monitor queries, and configure caching. With Shell scripting, we can create reusable scripts and also automate many of these tasks, making MySQL Shell an ideal tool for this job, especially if you do a lot of your management from the command line.
As mentioned earlier in the series, many of these commands can be simply executed as SQL statements, but we are doing this to build up a set of MySQL Shell commands that can be used to manage your MySQL environment.
Configuring Network-Related Parameters with MySQL Shell
Network settings control how MySQL handles communication between clients and the server. If these settings are misconfigured, your server may struggle to handle a large number of connections, or it might drop connections altogether when traffic increases. Thankfully, we can check and tweak these settings using MySQL Shell.
Let’s start by looking at some network parameters, such as max_allowed_packet, which determines the maximum size of a packet that the server can handle. If this value is too small, large queries or data transfers might fail. Here’s how we can check and modify this value in MySQL Shell.
First, connect to your MySQL server and switch to JavaScript mode:
|
1 2 3 |
mysqlsh --uri root@localhost \js |
Note: If you need to enter a password, you’ll be prompted. If you’re unsure about connection details, please refer back to Part 1 of this series. And as a reminder that this will connect with the very powerful root user, so be careful doing this on a production server if you are not sure what you are doing.
Max_allowed_packet
max_allowed_packet, which sets the packet size that MySQL uses to communicate with your clients by default:
|
1 2 3 |
var result = session.runSql('SHOW VARIABLES LIKE "max_allowed_packet"'); print("Current max_allowed_packet: " + result.fetchOne()[1] + " bytes"); |
You’ll see the current size of the max_allowed_packet. For example, if it shows:

This value is 6 MB. If your server handles large data sets, especially using long strings or BLOB columns, this might be too low. You can increase it to 16 MB or even higher, depending on your workload. Let’s adjust it to 16 MB .
|
1 2 3 4 5 |
let maxAllowedPacket = 16777216; session.runSql(`SET GLOBAL max_allowed_packet = ${maxAllowedPacket}`); print(`max_allowed_packet updated to ${maxAllowedPacket} bytes (${maxAllowedPacketMB} MB).`); |
The SET GLOBAL command will make the change for all new connections to the server. This means that if you execute the SHOW VARIABLES command in the same connection in a query tool, without reconnecting, the setting will not show as changed. Any new connection will get the new max_allowed_packet setting.
Note too that these changes will not be permanent, in that when you restart the server, they will not be remembered. If you want to make a permanent change, you need to change the value on startup or in the configuration file. For more details, check the documentation on setting system variable values.
net_read_timeout
Another important network setting is net_read_timeout, which determines how long the server waits to read data from the network before timing out. If your server deals with long-running queries or large data transfers, increasing this value can help avoid timeouts. Check the current value like this:
|
1 2 3 |
result = session.runSql('SHOW VARIABLES LIKE "net_read_timeout"'); print("Current net_read_timeout: " + result.fetchOne()[1] + " seconds"); |
The output should be similar to this:

Let’s increase the timeout to 120 seconds to handle cases where slower connections aren’t reading the data in the 30 seconds:
|
1 2 3 4 5 6 7 |
// Assign the desired time to a variable let netReadTimeout = 120; // Use the variable in your SQL command session.runSql(`SET GLOBAL net_read_timeout = ${netReadTimeout}`); print(`net_read_timeout updated to ${netReadTimeout} seconds.`); |

Once you’ve made these changes, MySQL will be better equipped to handle large queries and long-running connections without dropping them until the server is restarted.
Monitoring and Tuning Connections and Throughput with Shell Scripting
After modifying these network parameters, it’s important to monitor how well your server is handling connections and network traffic. We can use MySQL Shell to keep an eye on the number of active connections and adjust the connection settings if necessary.
Threads_connected
To check the current number of connections (also referred to as threads in MySQL), use the following command in MySQL Shell:
|
1 2 3 |
result = session.runSql('SHOW GLOBAL STATUS LIKE "Threads_connected"'); print("Current connections: " + result.fetchOne()[1]); |
You’ll see how many client connections are currently active. There are a few other similar values you can query such as Threads_created and Threads_running.
Max Connections
If your server handles many connections, you might need to increase the max_connections parameter to prevent connection issues during traffic spikes. Here’s how you can check and update the max_connections setting:
|
1 2 3 |
result = session.runSql('SHOW VARIABLES LIKE "max_connections"'); print("Current max_connections: " + result.fetchOne()[1]); |
And if you need to make a change, you can use the following code:
|
1 2 3 4 5 6 7 |
// Assign the desired time to a variable let maxConnections = 500; // Use the variable in your SQL command session.runSql(`SET GLOBAL max_connections = ${maxConnections}`); print(`max_connections updated to ${maxConnections}.`); |
By increasing max_connections, your server will be able to handle up to 500 connections simultaneously, making it more robust during peak traffic times. Note of course, you need to make sure that your server can handle the larger number of connections. Just increasing this value higher and higher could lead to other resource issues, making the connected users experience poorer.
Query Cache and Execution Plans Using MySQL Shell
Now that we’ve tuned the network settings, let’s focus on query optimization, which is where MySQL performance often falters. While you could use tools like MySQL Workbench or DBeaver for this, MySQL Shell offers some advantages for repeatability. We can create reusable functions that help us identify, analyze, and optimize slow queries in a systematic way.
The first step in query optimization is understanding how MySQL executes your queries. MySQL provides the EXPLAIN statement, which shows the execution plan for a given query. You can use this tool directly in MySQL Shell to analyze and improve query performance. In addition to analyzing queries, MySQL Shell can help us identify slow queries. We can check the slow query log to see which queries are taking the longest to execute. Let’s check the long_query_time setting to see how long a query must take before it’s logged as slow:
|
1 2 3 |
result = session.runSql('SHOW VARIABLES LIKE "long_query_time"'); print("Current long_query_time: " + result.fetchOne()[1] + " seconds"); |
The output will be similar to the following:
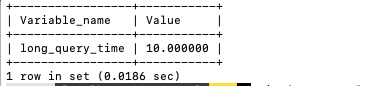
If we want to log queries that take more than 2 seconds, we can adjust this setting with the following code:
|
1 2 3 4 5 6 7 |
// Assign the desired time to a variable let longQueryTime = 2; // Use the variable in your SQL command session.runSql(`SET GLOBAL long_query_time = ${longQueryTime}`); print(`long_query_time updated to ${longQueryTime} seconds.`); |
Once this is set, you can check the slow query log to find the slowest queries and start optimizing them using EXPLAIN. When a MySQL server begins to slow down, the first question to ask is: which queries are causing the delay?
Jumping straight to optimization techniques without answering that is often counterproductive. Before using EXPLAIN or modifying server settings, the process must begin by identifying the problematic queries.
You can enable the slow query log with the following SQL statements:
|
1 2 3 4 5 6 7 8 9 10 11 12 |
// Define your parameters let slowQueryLog = 'ON'; let longQueryTime = 2; // Use the variables in your SQL statements session.sql(`SET GLOBAL slow_query_log = '${slowQueryLog}'`).execute(); print(`slow_query_log updated to '${slowQueryLog}'.`); session.sql(`SET GLOBAL long_query_time = ${longQueryTime}`).execute(); print(`long_query_time updated to ${longQueryTime} seconds.`); |
The first command enables the logging of slow queries, while the second sets the threshold for what MySQL should consider a “slow” query. In this example, any query that takes longer than 2 seconds will be logged.
You can confirm that the slow query log is active by running:
|
1 |
session.sql("SHOW VARIABLES LIKE 'slow_query_log'").execute().fetchAll(); |
Once confirmed, you can also check where the log file is stored on your server:
|
1 |
session.sql("SHOW VARIABLES LIKE'slow_query_log_file'").execute().fetchAll(); |
It shows the file path where MySQL is storing the slow queries. You can open this log file to review the entries.
Once a problematic query has been identified, the next step is to use the EXPLAIN statement to understand how MySQL executes it. For example:
|
1 |
session.sql("EXPLAIN SELECT * FROM products WHERE category = 'electronics'").execute().fetchAll(); |
If the output shows `type: ALL` it indicates a full table scan, meaning MySQL must inspect every row in the products table, `possible_keys` being `NULL` suggests there is no index available to make the query faster. `rows` shows the number of rows the server had to scan to resolve the query. This kind of pattern shows that creating an index on the category column will likely improve performance.
After adding the index:
|
1 |
session.sql("ALTER TABLE products ADD INDEX idx_category(category)").execute(); |
If you rerun EXPLAIN, `type:ref`will indicate the query is using the index instead of scanning the full table, `key: idx_category` confirms that the new index is in use, and `rows` shows that MySQL now needs to check fewer rows compared to before, which is a significant improvement.
Aside from log analysis, you can catch slow queries in real time using the `SHOW FULL PROCESSLIST` command.
|
1 |
session.sql("SHOW FULL PROCESSLIST").execute().fetchAll(); |
This command returns a snapshot of all running threads and their current states. The `Time` column shows how many seconds the query has been running; the Command column shows the type of operation. Query means it’s executing a statement. If a query shows a high time value, it may be worth investigating further.
Fine-Tuning Join and Sorting Algorithms with MySQL Shell
Complex queries that involve JOINs or SORTs can be performance killers if not optimized properly. MySQL Shell allows us to adjust the size of join buffers and sort buffers, which can improve the performance of these operations.
Viewing the settings
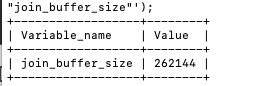
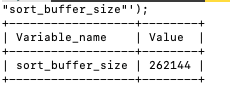
Let’s check the current join_buffer_size and sort_buffer_size settings:
|
1 2 3 4 5 |
result = session.runSql('SHOW VARIABLES LIKE "join_buffer_size"'); print("Current join_buffer_size: " + result.fetchOne()[1] + " bytes"); result = session.runSql('SHOW VARIABLES LIKE "sort_buffer_size"'); print("Current sort_buffer_size: " + result.fetchOne()[1] + " bytes"); |
The outputs will be similar to:
Changing the settings
When optimizing MySQL performance, adjusting buffer sizes like `join_buffer_size` and `sort_buffer_size` can be beneficial, but it’s essential to understand when and why these changes should be made. The `join_buffer_size` is used to set the buffer for join operations, while the `sort_buffer_size` is used for sorting.
If these buffers are too small, MySQL may need to perform disk I/O for operations that could be handled in memory, which can significantly slow down query performance. Increasing the buffer sizes allows MySQL to perform these operations more efficiently in memory, reducing the need for slower disk-based operations. But of course, setting them higher can use memory unnecessarily, and squeeze other processes need RAM.
Before blindly increasing these buffer sizes, you must first evaluate if it is necessary. You can use the following commands to check the current values for `join_buffer_size` and `sort_buffer_size`:
|
1 2 3 4 5 |
var joinBuffer = session.runSql("SHOW VARIABLES LIKE 'join_buffer_size';"); var sortBuffer = session.runSql("SHOW VARIABLES LIKE 'sort_buffer_size';"); print(joinBuffer); print(sortBuffer); |
The output will show the current buffer sizes. If the current values are too small for the queries you’re running, you might consider increasing them.
If your server has enough memory available, increasing the buffer sizes could help with performance. However, if your server is running low on memory or handling many simultaneous connections, increasing the buffer sizes too much can lead to excessive memory consumption, causing your system to slow down or crash.
Use this command to check if your server is reading a lot of data from disk instead of using the buffer:
|
1 2 3 |
var bufferReads = session.runSql("SHOW STATUS LIKE 'Innodb_buffer_pool_reads';"); print(bufferReads); |
If this value is high, it indicates that your server is doing a lot of disk reads, which means your buffers might be too small, and increasing them could help.
Once you’ve determined that increasing the buffer sizes would benefit your queries, you can adjust them like this (I will leave it to you to add variables for this script if you wish):
|
1 2 3 4 |
session.runSql('SET GLOBAL join_buffer_size = 8388608'); // 8MB session.runSql('SET GLOBAL sort_buffer_size = 8388608'); // 8MB print("join_buffer_size and sort_buffer_size updated to 8MB."); |
Note: These changes are applied globally, so be cautious when adjusting them in a production environment. It’s always a good idea to test these changes on a staging server first. It is important not to blindly change buffer sizes without first analyzing whether they are the cause of performance issues. Monitoring query performance, checking the current buffer sizes, and ensuring your server has enough memory are essential steps before adjusting these settings. Only increase these settings when you are sure that the buffer size is limiting performance due to large joins or sorts. It makes it clear that buffer changes should be a solution to a problem, not a default action.
Monitoring the effects
To monitor the performance of queries using these buffers, we can enable profiling in MySQL Shell. Here’s how to enable profiling and view the performance of a specific query:
|
1 2 3 4 5 6 7 8 9 |
session.runSql('SET profiling = 1'); session.runSql('SELECT * FROM products ORDER BY name'); result = session.runSql('SHOW PROFILE FOR QUERY 1'); var row; while (row = result.fetchOne()) { print(row); } |
You will see something similar to:
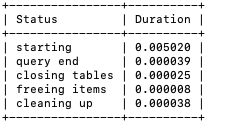
This will show the amount of time each part of the query took to execute, helping you identify issues in the query execution process.
Using MySQL Shell for Prepared Statements and Query Caching
Prepared statements can improve query performance by allowing MySQL to precompile the query, avoiding the overhead of reparsing and optimizing it every time. Let’s look at how we can use prepared statements in MySQL Shell.
First, prepare the statement:
|
1 2 3 |
session.runSql('PREPARE ProductStmt FROM "SELECT * FROM products WHERE category = ?"'); print("Prepared statement created."); |
Next, we can execute the prepared statement with different parameters, which will execute faster than a standard query because MySQL only needs to parse, check syntax, and generate an execution plan once when the statement is prepared. After that, MySQL just plugs in the new parameter and runs the precompiled plan. This saves time, especially when the same query structure is reused many times in a loop or high-traffic scenario. In contrast, a regular query forces MySQL to repeat the parsing and planning for every execution, even if only the parameter changes:
|
1 2 3 |
session.runSql('EXECUTE ProductStmt USING "Electronics"'); session.runSql('EXECUTE ProductStmt USING "Clothing"'); |
Query caching can also improve performance by storing the results of frequently executed queries. To check if query caching is enabled, run:
|
1 2 3 |
result = session.runSql('SHOW VARIABLES LIKE "query_cache_type"'); print("Query cache type: " + result.fetchOne()[1]); |
If query caching is enabled, MySQL will automatically store the result of any eligible query. When the exact same query is executed again, with the same text and the same database state, MySQL will return the cached result instantly, which saves the time it would normally take to parse, plan, and execute the query. However, when you update, insert, or delete data in a table, MySQL invalidates any cached results for that table. This is done to avoid returning outdated information.
That’s why query caching isn’t always helpful in databases that are frequently updated — if the underlying data changes often, the cache is constantly being cleared and rebuilt, which limits the benefit. Query caching is usually most effective in systems where the data is mostly read-only or where changes happen infrequently.
To disable query caching, run:
|
1 2 3 |
session.runSql('SET GLOBAL query_cache_type = OFF'); print("Query cache disabled."); |
Monitoring Network and Query Performance Using MySQL Shell
Once you’ve made these optimizations, it’s important to monitor the network and query performance to ensure your changes are effective. You can use MySQL Shell to monitor active queries and check for network latency.
To monitor active queries, run:
|
1 2 3 4 5 6 |
result = session.runSql('SHOW FULL PROCESSLIST'); var row; while (row = result.fetchOne()) { print(row); } |
This script will send a simple `SELECT 1` query to the MySQL server every 5 seconds. If the server responds successfully, it will print a message along with the exact time the response was received.
When you run the script, it shows if the server is reachable and responding. If there’s a delay or connection problem, the time between messages will increase, or you’ll stop seeing the messages altogether.
To check network latency, we can use a Shell script to periodically ping the MySQL server and log the response times:
|
1 2 3 4 5 6 7 8 9 10 11 12 13 14 |
function monitorLatency() { var result; var startTime, endTime, duration; while (true) { startTime = new Date(); result = session.runSql('SELECT 1'); result.fetchOne(); // Make sure the server returns the result endTime = new Date(); duration = endTime - startTime; print("Ping successful. Response time: " + duration + " ms at " + endTime); shell.sleep(5); } } monitorLatency(); |
This way, the script not only confirms the server is up but also tells you the round-trip time for the query, which reflects both the network latency and the server’s responsiveness. If the numbers start climbing, that’s a strong sign of latency or network congestion.
Conclusion
In this article, we’ve looked at how to optimize network and query performance using MySQL Shell. By fine-tuning network settings, optimizing query execution plans, and monitoring query performance, we can ensure that our MySQL server remains responsive and efficient.
In the next and final part of this series, we’ll go into automating performance optimization using some features in MySQL Shell. We’ll look at creating automated scripts for regular maintenance, ensuring that your server stays optimized without manual intervention. The key is to understand your workload, monitor performance regularly, and make incremental improvements.


Load comments