
The series so far:
- Statistics in SQL: Pearson’s Correlation
- Statistics in SQL: Kendall’s Tau Rank Correlation
- Statistics in SQL: Simple Linear Regressions
- Statistics in SQL: The Kruskal–Wallis Test
- Statistics in SQL: The Mann–Whitney U Test
- Statistics in SQL: Student's T Test
When you have two variables, one of the first questions you’d probably like to ask is, ‘how closely are they related?’ These variables could be attributes whose values come from measurements, scores or other types of quantity. Are you eager to puzzle out what factors are related the number of purchases in your website per day, for example? You want some sort of measure of how the various attributes relate together in their values. You have two choices, depending on whether your data is ‘parametric’ or not. A variable is ‘parametric’ if it is representative of a normally-distributed (bell-curve) population. If it isn’t, then you’d want to use something like Kendall’s rank correlation or Spearman’s rank correlation coefficient, but if your measurements are parametric, then Pearson’s Product-moment Correlation Coefficient is best.
Karl Pearson was an odd cove who had some very weird ideas about eugenics. He and Francis Galton were out to distinguish clear differences of racial types, using scientific measurement. He was a gifted mathematician whose work influenced Einstein, and which founded the science of Psychology, but his delusions about eugenics were to have ghastly consequences in the twentieth century.
Pearson’s Product-moment Correlation Coefficient gives a measurement from -1 for a perfect negative correlation (as one variable goes up, the other goes down) to 1 for a perfect correlation (as one variable goes up, the other goes up). a correlation of 0 means that there is no relationship between the two. Pearson’s correlation coefficient is calculated as the covariance of the two variables divided by the product of their standard deviations.
You can go further to calculate the probability that this correlation occurred by chance. This only gives a meaningful figure if both variables are normally distributed.
Using SQL, here is how one might calculate Pearson’s correlation coefficient when applied to a sample. It is usually represented by the letter r, and is the sample correlation coefficient. We will use the formula
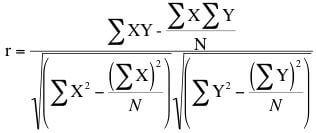
…which is easier to do in SQL, though not entirely easy on the eye for a non-statistician. My expression in the following SQL merely translates this into something any SQL programmer will greet with a grin of recognition. That big squiggly E means ‘sum()’ in SQL, and N is count(*). Later, I’ll show an easier way of calculating it, using the built-in aggregation functions (StDev() and StDevP()) designed for this sort of job.
DECLARE @OurData TABLE
(
x NUMERIC(18, 6) NOT NULL,
y NUMERIC(18, 6) NOT NULL
);
INSERT INTO @OurData
(x, y)
VALUES
(10, 7),
(9, 13),
(13, 11),
(9, 8),
(12, 13),
(9, 11),
(10, 11),
(10, 12),
(9, 8),
(11, 9),
(13, 13),
(10, 11),
(14, 15),
(11, 13),
(8, 8),
(13, 13),
(13, 11),
(12, 10),
(10, 12),
(12, 7),
(10, 12),
(10, 12),
(7, 9),
(10, 11),
(11, 8);
SELECT ((SUM(x * y)
– (SUM(x) * SUM(y)) / COUNT(*)
)
)
/ (SQRT(SUM(x * x)
– (SUM(x) * SUM (x)) / COUNT(*)
)
* SQRT(SUM(y * y)
– (SUM(y) * SUM(y)) / COUNT(*)
)
) AS ‘Pearsons r’
FROM @OurData;
… giving …
(25 row(s) affected)
Pearsons r
0.428590216844083
(1 row(s) affected)
SQL Server has a built-in function for calculating the population variance that makes it simpler to calculate
/*or more shortly, using the built-in StDevP function giving the
statistical standard deviation for the population for all values */
SELECT (Avg(x * y) – (Avg(x) * Avg(y))) / (StDevP(x) * StDevP(y)) AS ‘Pearsons r’
FROM @ourData
… giving …
Pearsons r
0.428590216844083
(1 row(s) affected)
You’d probably just want it to a couple of decimal places.
This document contains proprietary information and is protected by copyright law.
Copyright © 2026 Red Gate Software Limited. All rights reserved


Load comments