
The series so far:
- Statistics in SQL: Pearson’s Correlation
- Statistics in SQL: Kendall’s Tau Rank Correlation
- Statistics in SQL: Simple Linear Regressions
- Statistics in SQL: The Kruskal–Wallis Test
- Statistics in SQL: The Mann–Whitney U Test
- Statistics in SQL: Student's T Test
A lot of things in life happen almost entirely by chance. You have to make a judgement whether the report you are creating shows sheer chance or whether it is due to some real difference. If you have a test that gives you a reasonable estimate of the likelihood that it happened by chance, then that will add a great deal of confidence to your judgement. By sheer convention, we tend to show a measure of confidence in our results if the probability of our results happening by sheer chance drops below the 5% level.(p < 0.05); the so-called ‘significance level’.
However a lot can go wrong, and a lot of research results have to be quietly forgotten about because the researchers have miscalculated the chance that their results could have happened by luck. In science, you are obliged to disprove the null hypothesis, which is that your results occurred entirely by chance. If you ‘fish’ for significant results, the criteria for rejecting the null hypothesis gets much more stringent. It is easy to forget, as well, that the the 5% level.(p < 0.05) is arbitrary, and many real-life events are far less probable than this! Some researchers find the significance of results a difficult concept to grasp!
Generally, we rely on the normal distribution of the data to base our calculations on, but some data just isn’t normally distributed or even a continuous variable. This can make life harder. However, for correlations, we have non-parametric tests such as Kendall’s Rho. For calculating whether samples come from the same population distribution, we have the Mann–Whitney U , and, if there are more than two samples, the Kruskal–Wallis one-way analysis of variance on ranks.
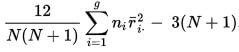
The calculation leads to getting the value of H.
If the null hypothesis is true, the probability of getting a particular value of H by chance is the P value corresponding to a chi-square equal to H; When you look up the chi-squared probability, you’ll need to know the degrees of freedom, which is the number of groups minus 1.
If the sample sizes are too small, H does not follow a chi-squared distribution very well, and you need to be very cautious in your conclusion!
In our example, we have three groups of patients, one of which had the experimental treatment, another had a placebo, and the third had no treatment.
|
1 2 3 4 5 6 7 8 9 10 11 12 13 14 15 16 17 18 19 20 21 22 23 24 25 26 27 28 29 30 31 32 33 34 35 36 37 38 39 40 41 42 43 44 45 46 47 48 49 50 51 |
DECLARE @H NUMERIC(8,2) DECLARE @DegreesOfFreedom INT DECLARE @rankOrder TABLE ( item INT IDENTITY, TheGroup VARCHAR(20), Measurement INT ); INSERT INTO @rankOrder (TheGroup, Measurement) SELECT 'Treatment' AS Thegroup, f.Measurement FROM (VALUES (56), (43), (54), (65), (88) ) f(Measurement) UNION SELECT 'No Treatment', g.Measurement FROM (VALUES (45), (55), (60), (70), (72) ) g(Measurement) UNION SELECT 'Placebo', h.Measurement FROM (VALUES (18), (30), (34), (40), (44) ) h(Measurement) ORDER BY f.Measurement ASC; --the degrees of freedom is the number of groups -1 SELECT @DegreesOfFreedom = COUNT(distinct TheGroup)-1 FROM @rankOrder --and now we can calculate H SELECT @H= (12.00/(SUM(n)*(SUM(n)+1)))* SUM(sumranks)-(3.00*(SUM(n)+1)) FROM (SELECT (SUM(item)*SUM(item))/COUNT(*)AS sumranks ,COUNT(*) AS n FROM @rankOrder GROUP BY [@rankOrder].TheGroup)f /* and we can look up the probability of the null hypothesis occuring by chance */ SELECT @H AS H,coalesce(CONVERT(VARCHAR(5),MIN(Critical_Level)),'>0.05') AS 'probability' FROM (VALUES (1, 3.8415 , 0.05), (1, 6.6349 , 0.01),(1, 10.8276, 0.001),(2, 5.9915, 0.05),(2, 9.2103, 0.01), (2, 13.8155, 0.001),(3, 7.8147, 0.05), (3, 11.3449, 0.01), (3, 16.2662, 0.001),(4, 9.4877, 0.05), (4, 13.2767, 0.01),(4, 18.4668, 0.001),(5, 11.0705, 0.05), (5, 15.0863, 0.01), (5, 20.5150, 0.001), (6, 12.5916, 0.05), (6, 16.8119, 0.01), (6, 22.4577, 0.001),(7, 14.0671, 0.05), (7, 18.4753, 0.01), (7, 24.3219, 0.001),(8, 15.5073, 0.05),(8, 20.0902, 0.01),(8, 26.1245, 0.001),(9, 16.9190, 0.05), (9,21.6660, 0.01), (9,27.8772, 0.001),(10,18.3070, 0.05), (10,23.2093, 0.01), (10,29.5883, 0.001) )Critical_Values(Degree_Of_Freedom,Value,Critical_Level) WHERE Critical_Values.Degree_Of_Freedom = @DegreesOfFreedom AND Critical_Values.Value < @H /* giving ... H probability 8.70 0.050 */ |
The calculation of the actual probability is pointless as well as difficult, because we only need to know whether it meets the criterion level at which we can dismiss the null hypothesis. For this reason, we don’t need the full table of probabilities, just the critical ones for the three significance levels.
In this case, we can dismiss the idea that our treatment experiment occurred by chance but we don’t know which of our three groups was different, or ‘Stochastically dominant’. We can do this later by testing pairs of groups with Dunn’s test or Mann-Whitney U
This document contains proprietary information and is protected by copyright law.
Copyright © 2026 Red Gate Software Limited. All rights reserved


Load comments