
Often times, as developers, we want to exercise some code that has side effects on external resources-be it database transactions, file creation, file content updates, event log records, process state, memory use, and so on. We want to see what effect our code is having by keeping track of those external resources in real-time, or close to it. There are a variety of dedicated tools for some of these types of things. Some give you an instant in time: tools like Windows’ Event Viewer snapshots your event log, and SQL Server Management Studio lets you snapshot any table (or group of tables with a join). You can refresh that snapshot as you wish, in order to monitor those resources. Others provide a continuous monitor: SQL Profiler or SysInternals’ Process Explorer / Process Monitor are noteworthy examples. These tools are of a type that continually refreshes the snapshot, effectively giving you near-real-time feedback.
And if there happens to be a dedicated monitoring program of that type for what you need to track, that’s great, but that isn’t always the case. Often you want to track something unique to your code that doesn’t expose a WMI performance counter, so you need a custom monitor.
We’ve all probably used PowerShell’s Get-Process cmdlet to get repeated information about a process that you’re tracking, but what about something a bit easier and slicker. I felt sure that someone in the PowerShell community would have come up with a simple solution. Then I discovered an old PowerShell routine by Marc van Orsouw, ‘thePowerShellGuy’, a.k.a MoW; a Swiss Cloud consultant and a former PowerShell MVP best known for his WMI Explorer script. This script was a small and lightweight PowerShell utility designed to do display dynamically changing information in a grid from a repeating PowerShell script block.
All you needed to do was:
- figure out how to collect what you want in PowerShell (and PowerShell is rich enough and expressive enough to allow you to grab data about most anything on your computer)
- feed it to the script to generate a monitor for continual update and display.
It was on an old website which no longer exists. I found a copy of the very same code on Google Code though that site is apparently being phased out as well.
That original script provided just the barebones, but it worked well-enough to immediately prove its worth to a Windows developer such as I. Over time, I added a large number of features, bug fixes, and enhancements to make it more useful and more user-friendly, but I do want to express my appreciation to ThePowerShellGuy, because without that first script proving its worth, I’d never have had the impetus or inclination to gradually morph it into the MonitorFactory.
In this article, I’ll explain how to use the MonitorFactory and provide some illustrations of when it would be handy. If you’d like to run the code, grab the open-source code from Github here.
Getting Started With Monitor Factory
Monitor Factory allows you to create a specific watcher or tracker for some metric that is returned from a script block of PowerShell yielding tabular data. The API for Monitor Factory consists of just one cmdlet, Start-Monitor. Before creating a monitor with Start-Monitor, you just need to create a recipe in the form of a PowerShell script block.
As PowerShell’s own help illustrates (see about_script_blocks in PowerShell help), you can run Invoke-Command to execute a script block, as in:
|
1 |
Invoke-Command -ScriptBlock { Get-Process } |
… which is exactly the same as if you had just invoked Get-Process by itself, producing a list of processes on your computer. Start-Monitor is very similar but with two crucial differences. This again invokes Get-Process…
|
1 |
Start-Monitor -ScriptBlock { Get-Process } |
… but instead, it sends the output to an interactive grid and then refreshes the data ad infinitum at whatever time interval you specify.
Some Practical Applications
Before getting into all the nitty-gritty of using Monitor Factory, let’s take a look at some real-world examples of what you might want to use it for. These are arranged in order of increasing complexity of use to give you some idea of the possibilities you can use Monitor Factory for, though truly the sky is the limit!
Database Monitoring
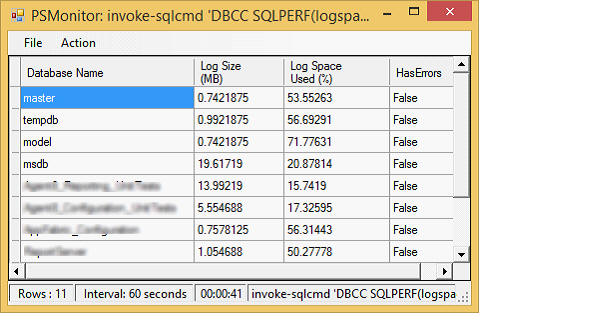
SQL data is a natural for Monitor Factory. In SQL Server Management Studio you can write queries of arbitrary complexity which ultimately yield a data table, just what makes Monitor Factory salivate! To move your SQL code from SSMS over to the command-line, Invoke-Sqlcmd will let you execute any arbitrary SQL query from the PowerShell command line, displaying the tabular output on your console. (It is the PowerShell equivalent of the sqlcmd utility.) Wrap that whole thing in a script block and feed it to Monitor Factory to take that console output into an interactive data grid window, updated automatically as frequently as you like. This is very handy to watch what your database layer is doing as you develop a new application. Here’s an example showing about the shortest, useful bit of SQL you could write, reporting on the free space of your database logs. From the SQL output I use standard PowerShell to select just four properties of interest:
|
1 2 3 4 |
Start-Monitor -AsJob { Invoke-Sqlcmd 'DBCC SQLPERF(logspace)' | Select-Object 'Database Name','Log Size (MB)','Log Space Used (%)',HasErrors } |
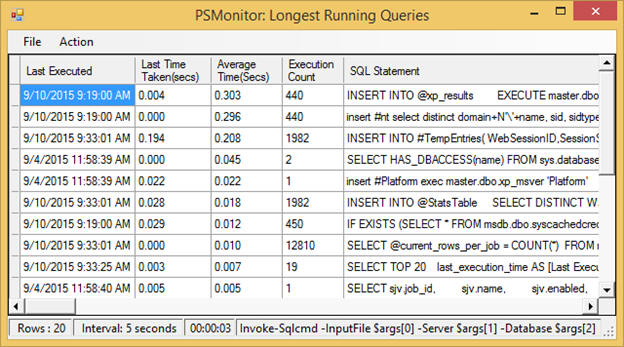
OK, that was definitely a very short query-but not terribly interesting. Here’s one with a bit more panache, generating a list of the top twenty longest-running queries in the specified database. Generate a monitor for this and you can see every few seconds if there are any new potential performance hogs. You can, of course, paste this code in as a literal, just as the previous query did, but due to its length it makes more sense to store this in a file; let’s call it TopTwentyQueries.sql. (As one useful variation, note the penultimate line is commented out; uncommenting that will yield the longest queries in just the last 20 minutes.)
|
1 2 3 4 5 6 7 8 9 10 11 12 13 14 15 16 17 18 |
SELECT TOP 20 last_execution_time AS [Last Executed] ,convert(DECIMAL(8,3), convert(DECIMAL, last_elapsed_time)/1000000) AS [Last Time Taken(secs)] ,convert(DECIMAL(8,3), convert(DECIMAL, total_elapsed_time/execution_count) / 1000000) AS [Average Time(Secs)] , execution_count AS [Execution Count] ,SUBSTRING(st.text, (qs.statement_start_offset/2) + 1, ((CASE statement_end_offset WHEN -1 THEN DATALENGTH(st.text) ELSE qs.statement_end_offset END - qs.statement_start_offset)/2) + 1) AS [SQL Statement] FROM sys.dm_exec_query_stats AS qs CROSS APPLY sys.dm_exec_sql_text(qs.sql_handle) st -- WHERE last_execution_time >dateadd(MINUTE,-20,getdate()) ORDER BY total_elapsed_time / execution_count DESC; |
Then you can generate a monitor like so:
|
1 2 3 4 |
Start-Monitor { Invoke-Sqlcmd -InputFile TopTwentyQueries.sql } -AsJob -Interval 5sec -DisplayName 'Longest Running Queries' |
With the query safely ensconced in a file, you can readily see that this could be genericized to a “SQL Monitor Factory” (though you do not yet know the semantic or syntactic elements). Here is one possible implementation of such a function, taking in five parameters. It builds a parameter list for Start-Monitor using those parameters. Note that the function allows the title to be optional, so it only sets the DisplayName parameter if you provide it. You will learn more about Start-Monitor‘s calling semantics shortly.
|
1 2 3 4 5 6 7 8 9 10 11 12 13 14 15 16 17 18 19 |
function Start-SqlMonitor ( [string]$path, [string]$server, [string]$database, [string]$title = '', [string]$interval = '5sec' ) { $monitorParams = @{ AsJob = $true Interval = $interval ScriptBlock = { Invoke-Sqlcmd -InputFile $args[0] -Server $args[1] -Database $args[2] } ArgumentList = $path, $server, $database } if ($title) { $monitorParams.DisplayName = $title } Start-Monitor @monitorParams } |
Here is the simplified equivalent call you can now make with the previous query:
|
1 |
Start-SqlMonitorTopTwentyQueries.sql localhostmaster 'Longest Running Queries' |
File System Monitoring
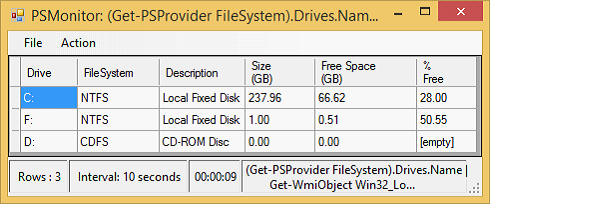
Windows Management Instrumentation (WMI) is an API that provides a rich source of data on your local machine or even on remote machines. Get-WmiObject is the PowerShell API to WMI (superseded by Get-CimInstance in PowerShell v5.0). This bit of code lets you keep a watchful eye on your disk usage. Get-PSProvider returns the drive letters of the disks on the local machine. That list is fed into Get-WmiObject to fetch details about each disk, and from that output we again select just the properties of interest, some of which are calculated properties that return more useful values than just the raw data.
|
1 2 3 4 5 6 7 8 9 10 11 12 13 |
Start-Monitor -AsJob { (Get-PSProvider FileSystem).Drives.Name | % { Get-WmiObject Win32_LogicalDisk ` -ComputerName localhost -Filter "DeviceID='$_`:'" | Select-Object @{n='Drive'; e={$_.name}}, FileSystem, Description, @{n='Size (GB)';e={($_.size/1gb).ToString('F2')}}, @{n='Free Space (GB)';e={($_.freespace/1gb).ToString('F2')}}, @{n='% Free'; e={(($_.Freespace/$_.size)*100).ToString('F2')}} } } |
Source Control Monitoring
If you are working with colleagues on a project it is often quite handy to have a handle on the “pulse” of your source control activity. As long as your source control system has a command-line interface, you can often massage that output to display new commits. I am using TFS for my current job, so all I need to do is invoke this wrapper function that shows me the number of files that are stale (i.e. there are files freshly committed by my colleagues that I have not yet brought into my workspace), grouped by folder.
|
1 |
Start-StaleMonitorfolder C:\MyBase\TFS\root\Extensions |
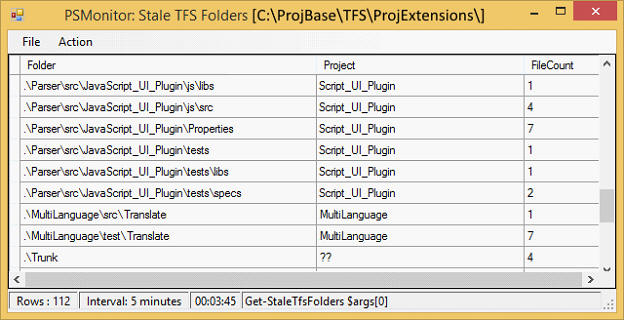
My wrapper functionStart-StaleMonitor can also display a more condensed summary by project or an expanded, fully itemized list by file. Observe in the code below how it simply calls Start-Monitor with one of three cmdlets: Get-StaleTfsFiles, Get-StaleTfsFolders, or Get-StaleTfsProjects. It also supplies a few more parameters to Start-Monitor that will be discussed shortly, though you can likely discern most of what it does.
|
1 2 3 4 5 6 7 8 9 10 11 12 13 14 15 16 17 18 19 20 21 22 23 24 25 26 27 28 29 30 31 32 33 |
function Start-StaleMonitor( [ValidateSet('file','folder','project')]$choice = 'file', [string]$path = 'C:\MyBase\TFS\root\Main', [string]$interval = '5m' ) { switch($choice) { "file" { Start-Monitor -AsJob { Add-PSSnapin Microsoft.TeamFoundation.PowerShell; Get-StaleTfsFiles $args[0] } -Interval $interval -DisplayName "Stale TFS Files [$path]" -ArgumentList $path } "folder" { Start-Monitor -AsJob { Add-PSSnapin Microsoft.TeamFoundation.PowerShell; Get-StaleTfsFolders $args[0] } -Interval $interval -DisplayName "Stale TFS Folders [$path]" -ArgumentList $path } "project" { Start-Monitor -AsJob { Add-PSSnapin Microsoft.TeamFoundation.PowerShell; Get-StaleTfsProjects $args[0] } -Interval $interval -DisplayName "Stale TFS Projects [$path]" -ArgumentList $path } } } |
When I said “all you need to do…” at the beginning of this section, that remark was facetious (at least for TFS). First, I had to write Start-StaleMonitor. Then I had to write Get-StaleTfsFiles, Get-StaleTfsFolders, and Get-StaleTfsProjects. (All of those are available from my open-source PowerShell library, by the way.) Not done yet… then you have to have the TFS 2013 PowerTools extension installed in Visual Studio, which also installs some PowerShell cmdlets that are needed within those three cmdlets (hence the Add-PSSnapin you see in the code above). It might seem like a lot of work, but I find the information I get from Start-StaleMonitor very useful in my daily work. And if you use TFS, you now have a plug-and-play solution; you just have to install it!
Considerations for Script Blocks
Be Aware of Multiple Object Types
Unlike Invoke-Command, mentioned in the introduction, which just outputs to the console, there are some considerations to be aware of when constructing your script block for Start-Monitor. Let’s use Get-ChildItem to illustrate these.
|
1 |
Start-Monitor -ScriptBlock { Get-ChildItem -Recurse } |
This monitors all files and directories rooted at the current directory, flattening the result into a single list of objects. But what kind of objects? Get-ChildItem emits both FileInfo and DirectoryInfo objects, each with different properties. The interactive grid that is generated, however, can only handle a single object type; it determines its columns from the first object it encounters. For Get-ChildItem this will typically be a DirectoryInfo object so all the column headers will correspond to DirectoryInfo properties. FileInfo objects share a lot of the same properties, but not all; files will thus have some columns shown as empty and some file properties will not appear at all.
Adding a filter to restrict the output to ignore directories…
|
1 |
Start-Monitor { Get-Child -File -Recurse } |
… will allow you to see all the properties of each file, because all objects going into the grid are now the same type, FileInfo.
Be Aware of the Properties of Your Output
You will immediately notice that the grid display is quite different from what you get on the console when you just run Get-ChildItem. I’m not speaking just of the formatting. Rather, you will see a lot more columns: the grid has around 20 columns whereas on the console you only see four (Mode, LastWriteTime, Length, and Name) !
This difference is due to the fact that PowerShell defines a set of default properties for a cmdlet that it uses when it outputs to the console. But that is merely an output rendering artifact. All the properties of the object are really there. And they have to be: otherwise, it would not make any sense that when you pipe to another cmdlet you would only get a portion of an object! So forStart-Monitor, your script block’s output does not go to the console. Rather it is consumed by an internal function that constructs a DataTable object that in turn is connected to the grid view to render it as output. But the constructor function sees the entire object; in the case of Get-ChildItem, that means all of its 20 or so properties. Therefore, if you want to get the same output that you would on the console, you have to explicitly select just those properties (here I am switching from Get-ChildItem to its ls alias for brevity):
|
1 |
Start-Monitor { ls -File -R | select Name,Mode,LastWriteTime,Length } |
Foreground and Background Execution
Start-Monitor can be run as a foreground or background process. Just add -AsJob to run as a background process. Internally there are a lot of machinations needed to support the asynchronous version but from the user perspective there are only two things to be aware of.
Foreground or background, Start-Monitor will pop open a secondary window. But run synchronously your PowerShell host window will be tied up running the application-you will not get a prompt to continue doing other work. That’s really the main reason for making a cmdlet that supports background processing, so that you can continue executing other commands in the same window.
The second reason is less obvious but more important. When you run synchronous applications you get error messages on your console; with asynchronous applications you do not, because once launched they are no longer tied to the console. Instead, output is collected in the background job itself. A job is quite a powerful PowerShell entity. It persists for the life of your PowerShell session unless you explicitly remove it. Thus, even if you close the window opened by Start-Monitor, its job will still be available. Which is a good thing, because you can request its output (with Receive-Job) to examine any errors reported. Receive-Job needs a job ID (which you can get from Get-Job) or you can receive output from all jobs by just using an asterisk (*) for the job ID. The point here, is that when you are crafting a new script block to feed to Start-Monitor it is a good idea to run it in the foreground first. But if at some point you are mysteriously getting no output in your data grid and you are running as a background job, you just have to remember that there may be errors that you are not seeing, and you need but ask for them with Receive-Job.
Using Variables
The samples you have seen thus far use script blocks whose contents are static, i.e. they are akin to literals rather than variables. What if you wanted to make a convenience wrapper to monitor the contents of a directory you specify at runtime? Consider first the synchronous (foreground) version:
|
1 2 3 4 |
function MonitorDir($myDir) { Start-Monitor { ls $myDir -R } } |
That will work fine; the $myDir variable is accessible because the script block is not wrapped inside a background job. As soon as you change it to a background job, though…
|
1 2 3 4 |
function MonitorDir($myDir) { Start-Monitor { ls $myDir -R } -AsJob } |
… you will get an empty grid. If you then query the data from the job (“Receive-Job *” is an easy way to not bother with the ID if you only have one outstanding job) you will see an error saying the variable has not been set. To get around this issue you have to “manually” supply any arguments you wish to inject into the script block using the $ArgumentList parameter:
|
1 2 3 4 |
function MonitorDir($myDir) { Start-Monitor { ls $args[0] -R } -AsJob -ArgumentList $myDir } |
The -ArgumentList is a list, as it intimates by the name, though here it is just used with a single value. Index into the list as shown above ($args[x]) to retrieve the supplied values.
Using Modules
When you need to use an external module within your script block you must explictly bring it in scope inside the script block; it will not be inherited from your current scope. Depending on the module this will require an Add-PSSnapin call or an Import-Module call.
User Interface
Rounding out this article, these last couple sections are a mini-reference, detailing both the input (parameters you can specify to Start-Monitor), and the output (components of the window generated by Start-Monitor).
Here’s an example of a monitor created by Monitor Factory:
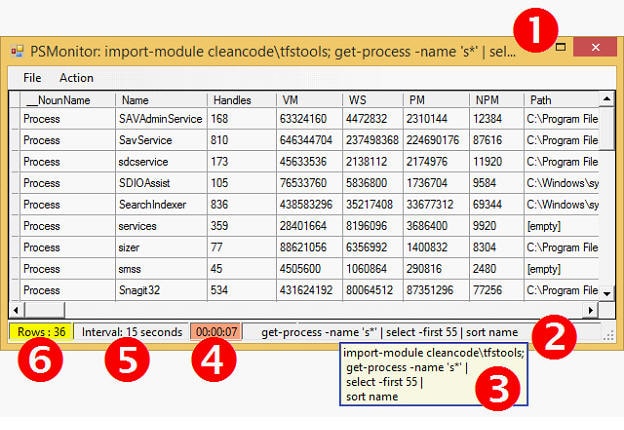
- The
ScriptBlockparameter that you supply is displayed in the window’s title bar (truncated to fit if too long) unless you specify a more user-friendly name with theDisplayNameparameter. - The
ScriptBlockparameter is also displayed in the bottom status bar, again truncated to fit. Here, since space is limited, any leadingImport-ModuleorAdd-PSSnapincommands are suppressed. - If you hover over the value in the status bar, however, you can see the entire
ScriptBlockin a tooltip. If it is a lengthy command, then line-breaks are added to the tooltip as shown to help ensure the whole script block is easily visible. - The countdown timer shows you when the next refresh will occur. If the time-to-refresh is less than a minute, the countdown timer refreshes every second. Otherwise, it refreshes every 5 seconds. Normally grey, if you pause the countdown via the
Actionmenu (or Ctrl+P), the background turns salmon, as shown in the figure. Besides the regular refresh interval, you can refresh on-demand from theActionmenu (or Ctrl+R). Any manual refreshes will not alter the next auto-refresh time. - When you create a monitor you can optionally specify a refresh interval (which defaults to 10 seconds). You can specify the interval in seconds, minutes, or hours. The status bar reflects your interval but normalizes it to seconds, minutes, or hours, regardless of what unit you supplied. (Example, if you specify 300 seconds it displays “5 minutes”.)
- On each refresh, the row count is automatically updated to reflect the refreshed content of the grid. Sometimes when you are viewing the grid it is handy to know what a prior value was for a row or a cell. Under the
Actionmenu you can selectPrior Data(or Ctrl+D) to switch context to the prior data set. When you do, the row indicator turns yellow as shown. Press Ctrl+D again to return to the current data set (or just wait for the next refresh).
Syntax
The API for Monitor Factory includes just these few parameters:
|
1 2 3 4 5 6 |
Start-Monitor [[-ScriptBlock] <ScriptBlock>] [[-Interval] <String>] [[-DisplayName] <String>] [[-ArgumentList] <Object[]>] [-AsJob] |
ScriptBlock
-
Default: { Get-Process | Select-Object PSResources,cpu }
The sequence of commands to execute. You may specify a single command, a command pipeline, or multiple commands. (If you are entering all on one line, separate multiple commands with semicolons.) Be sure to include Import-Module and Add-PSSnapin commands as needed to find your commands!
Interval
-
Default unit: seconds
-
Default value: 10
The time between successive data refreshes. This can either be a simple integer or an integer with units of hours, minutes, or seconds, or abbreviations thereof. Note that no spaces are allowed between the number and the units, so any of these are valid: 10, 10min, 10h, or 10seconds.
DisplayName
An optional string to display in the window title bar rather than the raw command sequence. If not supplied, the ScriptBlock parameter is used.
ArgumentList
This specifies the arguments (parameter values) for the script that is specified by the ScriptBlock parameter. This mechanism is required if you create a background monitor (with -AsJob) and you wish to supply external variables into your ScriptBlock.
AsJob
Runs the monitor as a background task, freeing up your PowerShell host to receive other inputs from you. If you get a blank grid or otherwise unexpected output, check the job details for possible errors. (Look up the last job id with Get-Job or, if you do not have other active jobs you can just do “Receive-Job *” to get the output of all jobs.) Alternately, rerun Start-Monitor without the -AsJob parameter to show any errors or message directly in the console. One limitation of background jobs: you cannot copy text from the data grid. Rerun Start-Monitor without -AsJob if you need to copy data out of the grid.
Summary
MonitorFactory provides a small, clean framework for those frequent occasions when you need to keep an eye on some external resources as you are examining behavior or performance of your code. It lets you whip up an auto-refreshing “watch window” on-the-fly to customize exactly what you need to see. Because sometimes, the answer is obvious when you can see how the data changes.
Grab the open-source code from Github here. For documentation (besides this article!) the cmdlet help is fully instrumented, so you can invoke Get-Help Start-Monitor to see all the details. Also I will be adding a bit on the Github wiki itself as time allows.
This document contains proprietary information and is protected by copyright law.
Copyright © 2026 Red Gate Software Limited. All rights reserved
Load comments