

Organizations are shifting more and more of their IT to the Cloud or replacing them entirely by cloud services. However, cloud-based services and applications must be monitored alongside those that need to be hosted on-premise. Most of the data center activities such as SLA management, resource planning and management, troubleshooting, and billing need to be monitored wherever the data and services are actually hosted.
In this article, we look at how to adopt an integrated approach for monitoring on-premise as well as cloud using Microsoft SCOM, OMS and other tools offered by Azure. We will first mention the existing monitoring tools of Azure such as Azure Monitor, App Insights, Security Center and Azure Advisor: Then we will look at Microsoft SCOM & OMS as a means of monitoring processes. Finally, we’ll describe an integrated approach for monitoring both cloud and hybrid environments.
Existing Monitoring Capabilities
Azure Portal
For monitoring Azure, the Azure Portal is the first place to look. Almost every resource in Azure has a Monitoring section that can be configured to monitor the resource in detail.
The Azure Monitor blade
The Azure Monitor blade consolidates activity logs and diagnostics logs across various events and resource types with various filtering options. You can view pre-defined metrics against resource types such as Virtual Machines or storage accounts. This blade can be extended with any of the third-party monitoring and management solutions that are available in the Azure marketplace.
The App(lication) Insights blade
The App(lication) Insights blade not only allows monitoring but also allows you to manage application performance. It works with live web applications that are developed using .Net, Java, Node.js and can be deployed on-premise or in the cloud. You can enable Application monitoring during deployment or at runtime, though the latter limits the telemetry data. App Insights presents the data on customizable dashboards and the APIs can be leveraged to collect custom telemetry data.
In order to monitor live desktop and mobile apps, Microsoft recommends the use of HockeyApp platform. App Insights can also be used in this context for viewing the telemetry data because HockeyApp can send the data to App Insights via the HockeyApp Bridge App. This way, The ‘App Insights’ blade becomes a single place for monitoring live applications, whether they be web, desktop or mobile.
Security Center blade
Azure Portal provides a Security Center blade to monitor and detect any security violations or threats.
Azure Advisor blade integrates with Security Center to come up with recommendations around high availability, performance, security and cost. These recommendations are marked with an impact of high, medium and low which can be managed from the advisor blade.
Microsoft System Center Operations Manager (SCOM)
SCOM is a cross-platform data center monitoring system for operating systems, hypervisors, network and hardware. It uses a single interface that shows state, health and performance information of computer systems.
By default, SCOM only monitors some basic OS-related services, however it can be extended by importing management packs (MPs) that allow you to monitor specific services such as SQL servers, SharePoint or Apache. Custom management packs can be created to get customized monitoring solutions. SCOM provides various out-of-the-box reports and dashboards thast are designed to monitor the performance of a datacenter.
SCOM provides a powerful way of monitoring the health of an ‘application’ as a whole. The components that constitute an application can be on a single server, cloud-based or distributed in nature. The overall health of the application is calculated based on pre-defined health rollup configurations. You can even model and monitor hybrid applications wherein backend resources like databases are deployed on-premise and front-end resources like web apps are deployed on Azure.
Microsoft Operations Management Suite (OMS)
OMS is an IT operations management solution from Microsoft that is available as a cloud service, It can manage both on-premise and cloud environments. The OMS suite consists of components for log analytics, automation, backup, disaster recovery, security and compliance.
The Log Analytics component collects data from various sources which can be analyzed through Log Analytics queries. Additional logic for data collection and analytics is provided through a gallery of pre-defined “solutions”. Custom views and dashboards can be created in OMS portal using Log Analytics queries.
Monitoring: An Integrated Approach
In this section, we examine how the above-mentioned tools can be used together to monitor real-world hybrid (on-premise and Azure) server environments.
Note that all these tools integrate with each other seamlessly. This means that, for example, Azure Monitor and App Insights data can be accessed from OMS Log Analytics. SCOM integrates with OMS and vice versa. Management packs for Azure and App Insights help in monitoring Azure environment as well as the applications from within SCOM. Also, SCOM allows to expose on-premise data-center elements to OMS using agents and proxy servers. OMS agents help in monitoring systems through OMS that are neither monitored through SCOM nor deployed in Azure. If internet access is restricted for a set of computers, then an OMS gateway can be setup to monitor them through OMS.
To work with OMS, you should first decide on the number of ‘workspaces’ to be used for your monitoring needs.The term ‘Workspace’ is used to describe a logical container for the management data which is associated with an Azure subscription. Then you need to identify the sources, known as ‘connected sources’ in OMS terminology that generate data (e.g. agents) for monitoring and define the data sources (e.g. IIS logs).
Next you setup the SCOM environment. SCOM is complementary to OMS and can provide additional insights that OMS cannot provide. SCOM can be deployed either on-premise or in Azure as depicted below:
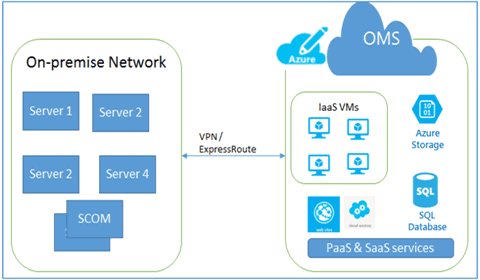
Figure 1: On-premise SCOM monitoring Azure environment
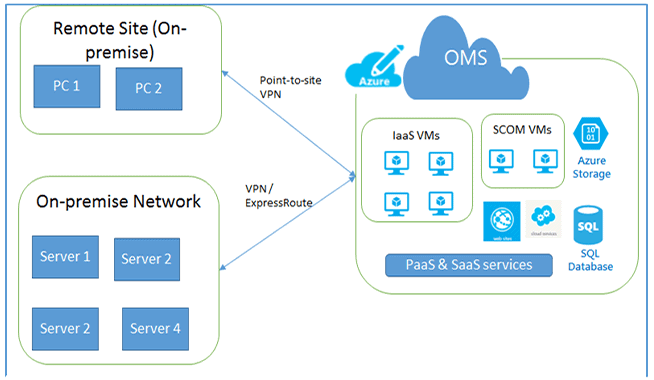
Figure 2: SCOM in Azure monitoring Hybrid environment
Once OMS & SCOM are set up, decide on whether you need any additional solutions from the OMS solutions gallery to provide you with additional data sources for monitoring with better views and insights on data. Similarly, finalize on the Managements Packs that you need to install in SCOM.
Once we have the monitoring environment ready, we can get into the task of configuring the system for specific monitoring requirements.
Availability & Performance Monitoring
Almost every service offering in Azure is backed by a Service Level Agreement (SLA) which describes Microsoft’s commitments for availability and connectivity for a particular service/resource. However, this is the default service level and may not be adequate to ensure high availability of applications deployed in Azure. Organizations need a robust approach to monitoring overall system availability, and operational response time/throughput; This is because these are usually the most critical criteria that are defined in the SLA with the application users.
Resource Level Monitoring
At times, mostly to minimize the overall cost on Azure, less critical workloads are deployed on Azure without requiring Azure’s SLA criteria of deploying multiple instances. It is important to know when the resources supporting these workloads become unavailable, thereby causing application downtime. Azure portal helps in configuring alerts for most of the resources/services which will be triggered when a service remains unavailable for a specified amount of time.
OMS Log Analytics dashboards, SCOM console as well as Azure portal together help in monitoring various resources deployed in on-premise and hybrid environments.
Application Level Monitoring
It is a straightforward task to monitor whether a resource in isolation is available and/or performing adequately. This can be achieved through different consoles and dashboards. However, it gets tricky when it comes to application monitoring where an application may be comprised of different components distributed across various tiers and environments, e.g. on-premise and cloud.
SCOM helps in monitoring the SLA requirements of an application through the Service Level Objective (SLO) feature. An SLO can include Monitor state SLO to track availability as well as Collection rule SLO to track the performance of the application. Microsoft Azure Management Pack for SCOM includes a distributed application template which can be utilized to create your distributed application deployed in a hybrid environment. A sample dashboard for SLA monitoring created this way can be seen below:
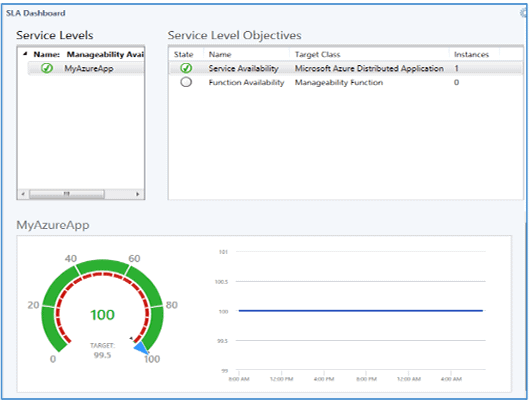
Figure 3: SLA Dashboard View in SCOM for a Hybrid Application
It is also possible to create a summary report on service level tracking data to compare how the application is performing against the service level objectives that are specified at granular levels.
OMS is not capable of modelling an “application” as such. Individual solutions, however, can be used to assess the performance of a service and can provide recommendations for making the server environment faster and more robust.
Security Monitoring
Security monitoring is an important part of the task of protecting your resources against internal/external attacks, threats and data loss. Anti-malware Assessment, Security & Audit solutions in OMS provide an overall view of the security state, whether they are Cloud-based or on-premise, or hosted on Windows or Linux systems.
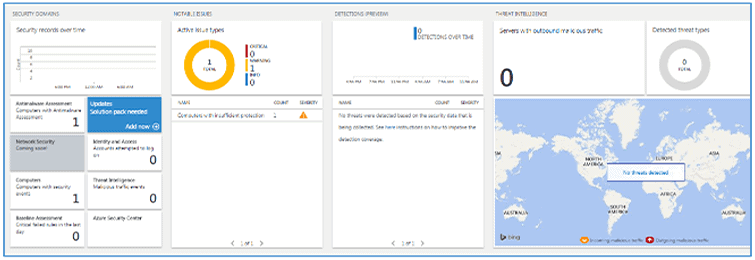
Figure 4: Azure Security Center
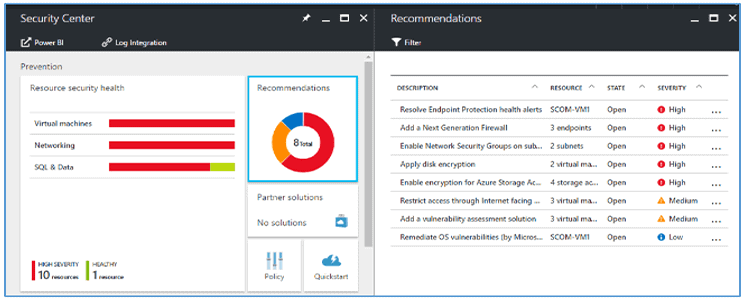
Figure 5: OMS Security & Audit Dashboard
The Security & Audit dashboard provides various insights; it helps in quickly identifying number of active issues and threat patterns. The Security Domains area allows access to malware assessment, update assessment, identity & access information, and computers with security events. It also provides quick access to Azure Security Center. A set of common security queries are also provided which can easily be customized for a specific environment.
Alerting & Auto-Recovery
In order to meet high availability requirements of an application, in addition to monitoring the system continuously, you should also have adequate processes and resources in place to take corrective actions immediately. This is where Alerting & Automation features become a more important part of a monitoring solution.
Azure Portal, SCOM and OMS all provide built-in support for alerts. The Azure Automation service that is part of OMS suite helps in automating specific tasks. Azure Portal and OMS allows you to create alert rules that send out email notifications, run a web-hook with a custom JSON payload or even a runbook (an Azure Automation runbook) when the alert is activated. The OMS Security & Audit solution provides a set of alerts around security violations that can be enabled and configured to not only get notified on the alerts but also for taking corrective actions automatically. SCOM also provides a notification feature (email, SMS). SCOM alerts can be diagnosed further by creating diagnostic tasks that can run a command or a script.
Alerts can not only be configured for reporting unavailability, but also for knowing how a service/application is performing. Application Insights supports alert rules that are relevant to performance metrics such as server response time, receiving response time or browser page load time which trigger an alert on meeting specified criteria. Actions can be taken on the alert by specifying web hooks in addition to notifying key stakeholders over email.
The Alerting feature can also help to integrate the monitoring solution with ticketing systems such as Atlassian JIRA that can auto-create tickets on receiving emails. Most of the problem/incident management systems have the ability to auto-assign tickets to support engineers who can then start working on the ticket. This kind of automation reduces the overall turnaround time in identifying and resolving issues.
Azure automation allows you to run Runbooks that can either run on Azure or in local environment via Hybrid Runbook Worker. This feature helps in taking actions based on the alert in an automated fashion Azure Automation runbook gallery has a number of runbooks available. Runbooks can be scheduled to run at regular intervals using Azure Scheduler. Azure Automation service not only helps in reducing the recovery cycle, but also in avoiding human errors and overall application downtime.
Summary
This article talks about the out-of-the-box capabilities that Microsoft Azure provides in the monitoring space and how they can be leveraged to monitor the IaaS, PaaS and SaaS environments in Azure. The same set of tools, especially OMS, can add value in monitoring hybrid environments where the Azure cloud is seen as an “extended” environment to the on-premise data center. Because of the different SCOM deployment topologies that one can choose from, it is possible to complement OMS with SCOM to provide a unified view of entire application workloads either on-premise or in the cloud. This will provide you with the means of monitoring availability, security and performance and can monitor your on-premise extended Azure environments.
This document contains proprietary information and is protected by copyright law.
Copyright © 2026 Red Gate Software Limited. All rights reserved


Load comments