
- The SQL Server 2016 Query Store – Part 1: Overview and Architecture
- The SQL Server 2016 Query Store – Part 2: Built-In Reporting
- The SQL Server 2016 Query Store – Part 3: Accessing Query Store Information Using DMVs
- The SQL Server 2016 Query Store – Part 4: Forcing Execution Plans Using the Query Store
- The SQL Server 2016 Query Store – Part 5: Analyzing Query Store Performance
In the previous articles in this series about the Query Store, we discussed the architecture and options of the Query Store, and then took a look at the various built-in reports. In this article we are taking a look at the new DMVs that were introduced to support the Query Store, what they contain, and how we can access them with custom queries.
Newly added Query Store DMVs
Let’s start this article with a list of the new DMVs that were introduced in SQL Server 2016 to support the Query Store. In this article we will discuss every new DMV, and how they are related
- Sys.database_query_store_options
- Sys.query_store_query
- Sys.query_store_query_text
- Sys.query_context_settings
- Sys.query_store_plan
- Sys.query_store_runtime_stats
- Sys.query_store_runtime_stats_interval
As you can see from this list, the DMVs are easily identified by the query _ store string in the name of the DMV, with the exception of the sys.query_context_settings DMV.
With the exception of the sys.database_query_store_options (this DMV only holds Query Store configuration), all of the DMVs have a relation between them which is shown in Figure 15 below.
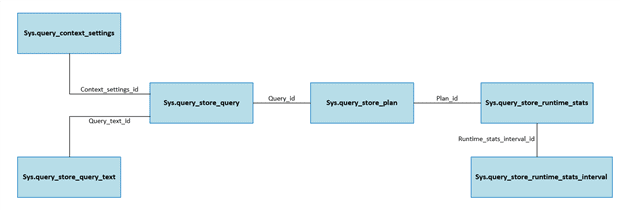
Figure 15 Query Store DMV relations
Sys.database_query_store_options
The sys.database_query_store_options DMV does not hold any query-related information, but instead records all the configuration options and their settings of the Query Store. I won’t go into detail describing every column in the DMV, as Microsoft has already done this on MSDN https://msdn.microsoft.com/en-us/library/dn818146.aspx, but I would like to bring some columns to your attention:
- actual_state_desc This returns the current operating state of the Query Store and can be either OFF, READ_ONLY and READ_WRITE.
- current_storage_size_mb Shows you the current size the Query Store is taking in megabytes (MB).
- max_storage_size_mb The maximum size the Query Store can reach in megabytes (MB). Using this column, and the current_storage_size_mb value, you can easily check how much free space is left in the Query Store storage.
We have discussed the various Query Store options that you are able to configure in part 1 of this article series: Introducing the SQL Server 2016 Query Store #1 – Overview and Query Store Architecture and since the column names of this DMV are pretty self-explanatory I won’t describe them further.
Sys.query_store_query
A large part of the performance metrics of a query is recorded inside the sys.query_store_query DMV.
Before we look at the various bits of information stored inside the DMV, I want to step back a bit and discuss SQL statements and SQL batches.
Frequently, when we talk about executing a query, we really mean a single T-SQL command executed against the database. We call this a SQL Statement. A SQL statement is one single command that gets processed by SQL Server. For instance SELECT * FROM TableX.
However, it is also possible to execute multiple SQL statements inside one single unit called a SQL batch. An example of a SQL batch could be:
|
1 2 3 4 5 6 |
-- Statement 1 SELECT TOP 100 * FROM Person.Address; -- Statement 2 SELECT TOP 100 * FROM Sales.SalesOrderDetail; |
It is important to know that the information inside the sys.query_store_query DMV is recorded at the level of the SQL statement. As a matter of fact, the Query Store will cut up SQL batches into their SQL statements and record the performance and runtime metrics of the individual SQL statement. This is very different to the sys.dm_exec_query_stats DMV where runtime and performance metrics are recorded on the SQL batch level. We would have used this DMV before the Query Store became available. By recording the statement rather than the batch, the Query Store provides a finer granularity for trouble-shooting query performance! To show you an example of the way that batches are split into their component SQL statements, take a look at the example below.
|
1 2 3 4 5 6 7 8 9 10 11 12 13 14 15 16 17 18 19 20 |
-- Execute first -- Empty the Query Store ALTER DATABASE AdventureWorks SET QUERY_STORE CLEAR; -- Execute second -- Statement 1 SELECT TOP 100 * FROM Person.Address; -- Statement 2 SELECT TOP 100 * FROM Sales.SalesOrderDetail; -- Execute third -- Query sys.query_store_query SELECT query_id, qt.query_sql_text AS 'Statement Text', [text] AS 'Query Batch Text' FROM sys.query_store_query q CROSS APPLY sys.dm_exec_sql_text(last_compile_batch_sql_handle) INNER JOIN sys.query_store_query_text qt ON q.query_text_id = qt.query_text_id; |
Make sure to execute them in the correct order and execute both SQL SELECT statements in one batch. Figure 16 below shows the result of the third, and final, query in the batch above.

Figure 16 Query Store SQL statements inside sys.query_store_query
As you can see in the figure above, two new queries are recorded in the Query Store (ID 1 and 2) which were the individual statements inside the SQL batch that we executed. I joined the sys.dm_exec_sql_text DMF to show you both the unique queries inside the Query Store both belonged to the same SQL batch.
Back to the DMV! Again, the DMV is described in detail by Microsoft on MSDN https://msdn.microsoft.com/en-us/library/dn818156.aspx so I will only focus on those columns that deserve a bit more attention.
- context_settings_id This number ties the sys.query_store_query DMV to the sys.query_context_settings DMV. The sys.query_context_settings DMV records information about the context in which the query was executed (we’ll discuss the sys.query_context_settings DMV later on in the article).
- object_id The object_id column returns the ID of the database object if the query was part of such an object (for instance a Stored Procedure). If the query isn’t part of an object like a SP, a ‘0’ will be returned indicating the query was ad-hoc.
- last_compile_batch_sql_handle Returns the query text handle of the SQL batch. We used this column in the example above to join the sys.dm_exec_sql_text DMF to return the query text of the SQL batch.
A large part of the remaining columns of the DMV show various query compilation metrics, such as the number of times that this query was compiled, or the average compile memory that was needed.
Sys.query_store_query_text
MSDN link of the DMV: https://msdn.microsoft.com/en-us/library/dn818159.aspx.
The sys.query_store_query_text DMV returns the Query text of the SQL statement and can be joined to the sys.query_store_query DMV by the query_text_id column. Keep in mind that the text is related to the SQL statement, and not the SQL batch.
Sys.query_context_settings
MSDN link of the DMV: https://msdn.microsoft.com/en-us/library/dn818148.aspx.
The sys.query_context_settings DMV returns the context settings under which the SQL statement is executed. We can join this DMV to the sys.query_store_query DMV through the context_settings_id column.
It is very important for the Query Store to capture the context settings that were active when the SQL statement was executed because it can have an impact on the performance of the SQL statement. For instance, using a different data format for identical query statements can result in slower performance in of the statements.
Some of the context information is easily viewable in the sys.query_context_settings DMV, such as the date format ( date_format column), of the language under which the statement was executed ( language_id column). Other options, such as the SET options, are not directly visible inside the DMV and are represented by the set_options column. This column returns a bit mask to represent a number of the SET options configured. Right now it isn’t very easy to find out what SET options were used by the statement. One method that you can use is to join the sys.query_query_store DMV to the sys.dm_exec_query_stats DMV on the last_compile_batch_sql_handle column to retrieve the Execution Plan handle of the SQL batch that included the SQL statement, using the query below:
|
1 2 3 4 5 6 7 8 9 10 |
SELECT qsq.query_id, qsqt.query_sql_text, qs.plan_handle FROM sys.query_store_query qsq INNER JOIN sys.dm_exec_query_stats qs ON qsq.last_compile_batch_sql_handle = qs.sql_handle INNER JOIN sys.query_store_query_text qsqt ON qsq.query_text_id = qsqt.query_text_id ORDER BY qsq.query_id |
We can then use the Execution Plan handle as input to the sys.dm_exec_plan_attributes DMF which returns a value that contains the SET options that were used.
|
1 2 |
SELECT * FROM sys.dm_exec_plan_attributes(0x06000500A7754106208BF6BD8300000001000000000000000000000000000000000000000000000000000000) WHERE attribute = 'set_options' |
With the number that was returned, you have do to some subtractions to find out what set options were used: I won’t go into the detail of how you can do this since it is outside the scope of this article, but you can find some information on MSDN here: https://msdn.microsoft.com/en-us/library/ms189472.aspx.
Sys.query_store_plan
This DMV is described on MSDN here: https://msdn.microsoft.com/en-us/library/dn818155.aspx.
The sys.query_store_plan stores information about the Execution Plans that is related to the queries that are captured inside the Query Store. It returns information such as the Engine version used, the compatibility level and whether the plan was trivial.
The Execution Plans inside this DMV are the estimated execution plans rather than the actual ones. The Execution Plan itself is stored in as formatted XML inside the DMV. Using a CAST AS XML we can make the Execution Plan inside the DMV “hyperlinked” so you can easily view the Execution Plan inside SQL Server Management Studio. Below is a simple example of such a query:
|
1 2 3 4 5 |
SELECT plan_id, query_id, CAST(query_plan AS XML) AS 'Execution Plan' FROM sys.query_store_plan; |
Figure 17 shows the results of the query above, we’ll expend on this query a bit more in the section “Querying DMV information” in this article.
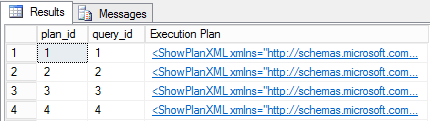
Figure 17 Execution Plans inside sys.query_store_plan
Sys.query_store_runtime_stats
This DMV is described on MSDN here: https://msdn.microsoft.com/en-us/library/dn818158.aspx.
Inside the sys.query_store_runtime_stats , many of the query performance metrics are captured and aggregated. You can join this DMV to the sys.query_store_plan DMV through the plan_id column.
One row for every unique Execution Plan inside the Query Store, during a specific interval, will be returned. The performance metrics inside the DMV are aggregated for the Execution Plan based on the interval configured in the Query Store options (Statistics Collection Interval). So keep in mind that you are not viewing the performance metrics for the single execution of the query, but the aggregated runtime metrics of that query during a specific time interval. This means it is possible to see rows returned which have the same plan_id (and thus the same Execution Plan) as long as they were executed in different interval segments. To show this relationship, I included Figure 18 that shows the different intervals (from the sys.query_store_runtime_stats_interval DMV) and the runtime statistics (from the sys.query_store_runtime_stats DMV)
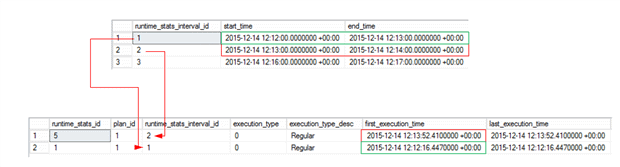
Figure 18 Interval relation with the performance metrics
The performance metric columns are all pretty self-explanatory so I won’t discuss them in detail here.
Sys.query_store_runtime_stats_interval
MSDN link of the DMV: https://msdn.microsoft.com/en-us/library/dn818147.aspx.
The last DMV we will discuss is the sys.query_store_runtime_stats_interval DMV. This DMV records the start and end time of each interval based on the Statistics Collection Interval setting of the Query Store. It uses this information to aggregate the performance metrics inside the sys.query_store_runtime_stats DMV. You can join the sys.query_store_runtime_stats DMV to the sys.query_store_runtime_stats_interval DMV using the runtime_stats_interval_id column.
Querying DMV information
So far we’ve discussed the Query Store related DMVs and I’ve shown some query example how you can grab some information out of them. Let’s expand those examples a bit more and show you two useful queries you can use to grab some performance information out of the DMVs. Keep in mind most of the information returned is also available through the built-in reports inside the Query Store.
Top 10 most expensive queries based on average runtime
|
1 2 3 4 5 6 7 8 9 10 11 12 |
SELECT TOP 10 qt.query_sql_text, CAST(query_plan AS XML) AS 'Execution Plan', rs.avg_duration FROM sys.query_store_plan qp INNER JOIN sys.query_store_query q ON qp.query_id = q.query_id INNER JOIN sys.query_store_query_text qt ON q.query_text_id = qt.query_text_id INNER JOIN sys.query_store_runtime_stats rs ON qp.plan_id = rs.plan_id ORDER BY rs.avg_duration DESC; |
Query parallel plans
|
1 2 3 4 5 6 7 8 9 10 11 12 |
SELECT qt.query_sql_text, CAST(query_plan AS XML) AS 'Execution Plan', rs.avg_duration FROM sys.query_store_plan qp INNER JOIN sys.query_store_query q ON qp.query_id = q.query_id INNER JOIN sys.query_store_query_text qt ON q.query_text_id = qt.query_text_id INNER JOIN sys.query_store_runtime_stats rs ON qp.plan_id = rs.plan_id WHERE rs.last_dop > 1; |
As you can imagine, the queries above can easily be modified in order to return the information that you are interested in. The sys.dm_query_store_runtime_stats DMV contains a wealth of different performance metrics, including IO, memory and CPU usage.
Summary
In this article we took a look at the various, new, Query Store related DMVs. We took a look what information they hold, how they are related and shown some examples how you can retrieve performance information out of them.
This concludes the third article in the Query Store article series. In the fourth article in the series The SQL Server 2016 Query Store: Forcing Execution Plans using the Query Store, we will take a look at how we can force specific Execution Plans through the Query Store.
Load comments