
When you need to configure a SQL Server installation, what is the best way to optimize tempdb for performance? The general advice is that it is possible to minimize the common problem of allocation bitmap contention by setting the initial number of data files for tempdb to a value calculated as a proportion of the number of processors installed in a SQL Server. After this initial setup, it is best to fine-tune this by monitoring how much contention is taking place in actual service.
Background
Every SQL Server has a shared database named tempdb that is for use by temporary objects. Because there is only one tempdb database per instance, it often proves to be a bottleneck for those systems that make heavy usage of tempdb. Typically, this happens because of PAGELATCH, in-memory latch contention on the allocation bitmap pages inside of the data files. The allocation bitmap pages are the page free space (PFS), global allocation map (GAM), and shared global allocation map (SGAM) pages in the database. The first PFS page occupies PageID 1 of the database, the first GAM page occupies PageID 2, and the first SGAM page occupies PageID 3 in the database. After the first page, the PFS pages repeat every 8088 pages inside of the data file, the GAM pages repeat every 511,232 pages (every 3994MB known as a GAM interval), and the SGAM pages repeat every 511,232 + 1 pages in the database.
When PAGELATCH contention exists on one of the allocation bitmap pages in the database, it is possible to reduce the contention on the in-memory pages by adding additional data files, with the same initial size and auto-growth configuration. This works because SQL Server uses a round-robin, proportional fill algorithm to stripe the writes across the data files. When multiple data files exist for a database, all of the writes to the files are striped to those files, with the writes to any particular file based on the proportion of free space that the file has to the total free space across all of the files: This means that writes are proportionally distributed to the files according to their free space, to ensure that they fill at the same time, irrespective of their size. Each of the data files has its own set of PFS, GAM, and SGAM pages, so as the writes move from file to file the page allocations to occur from different allocation bitmap pages spreading the work out across the files and reducing the contention on any individual page.
Note: It is possible to have PAGELATCH contention in tempdb that is not related to the allocation bitmap pages, typically on one of the system tables such as syshobts, and in these cases adding additional files will not help in reducing the in-memory latch contention. The system table contention occurs when you are creating and destroying objects rapidly that they don’t get cached by the tempdb metadata cache. The system table exists once for the database, not once per file, so adding files won’t alleviate the contention.
Existing Recommendations
There are several different published suggestions for calculating the number of files used by tempdb for the best performance. The SQL Server Customer Advisory Team (SQLCAT) team recommends that tempdb should be created with one file per physical processor core, and this tends to be one of the most commonly quoted configuration methods for tempdb. While this recommendation is founded in practical experience, it is important to keep in mind the types of environments that the SQLCAT team typically works, which are typical the highest volume, largest throughput environments in the world, and therefore are atypical of the average SQL Server environment. So while this recommendation might prevent allocation contention in tempdb, it is probably overkill for most new server implementations today. Paul Randal has written about this in the past in his blog post A SQL Server DBA myth a day: (12/30) tempdb should always have one data file per processor core where he suggests a figure of ¼ to ½ the number of cores in the server as a good starting point. This has typically been the configuration that I have followed for a number of years for setting up new servers, and I made a point of then monitoring the allocation bitmap contention of tempdb on the actual workload to figure out if it was necessary to increase the number of files further.
At PASS Summit 2011, Bob Ward, a Senior Escalation Engineer in Product Support, presented a session on tempdb and some of the changes that were coming in SQL Server 2012. As a part of this session Bob recommended that for servers with eight CPUs or less, start off with one file per CPU for tempdb. For servers with more than eight CPUs Bob recommended to start off with eight tempdb data files and then monitor the system to determine if PAGELATCH contention on the allocation bitmaps was causing problems or not. If allocation contention continues to exist with the eight files, Bob’s recommendation was to increase the number of files by four and then monitor the server again, repeating the process as necessary until the PAGELATCH contention is no longer a problem for the server. To date, these recommendations make the most sense from my own experience and they have been what we’ve recommended at SQLskills since Bob’s session at PASS.
Tracking tempdb contention
Before SQL Server 2012, the best way to track allocation contention in tempdb was to query sys.dm_os_waiting_tasks for PAGELATCH waits and then parse out the resource_description column to identify the database_id, file_id, and page_id of the resource being waited on. Robert Davis first showed an example of how to do in his blog post Breaking Down TempDB Contention, since when, the technique has evolved into the version shown in Listing 1
|
1 2 3 4 5 6 7 8 9 10 11 12 13 14 15 16 17 18 19 20 21 22 23 24 |
SELECT session_id, wait_type, wait_duration_ms, blocking_session_id, resource_description, ResourceType = CASE WHEN PageID = 1 OR PageID % 8088 = 0 THEN 'Is PFS Page' WHEN PageID = 2 OR PageID % 511232 = 0 THEN 'Is GAM Page' WHEN PageID = 3 OR (PageID - 1) % 511232 = 0 THEN 'Is SGAM Page' ELSE 'Is Not PFS, GAM, or SGAM page' END FROM ( SELECT session_id, wait_type, wait_duration_ms, blocking_session_id, resource_description, CAST(RIGHT(resource_description, LEN(resource_description) - CHARINDEX(':', resource_description, 3)) AS INT) AS PageID FROM sys.dm_os_waiting_tasks WHERE wait_type LIKE 'PAGE%LATCH_%' AND resource_description LIKE '2:%' ) AS tab; |
Listing 1: Tracking tempdb contention with sys.dm_os_waiting_tasks
The problem with this solution is that you have to be constantly polling the sys.dm_os_waiting_tasks DMV to catch the contention. If the contention is transient, then you may miss it altogether or only capture some occurrences.
Tracking allocation contention with Extended Events
Extended Events were introduced in SQL Server 2008. In SQL Server 2012 the number of events, and the information that they produce, has expanded significantly. Two of the events that were introduced in SQL Server 2008 were the sqlserver.latch_suspend_begin and sqlserver.latch_suspend_end events. These events fire when a latch wait occurs inside the database engine. However, in SQL Server 2008, these are of limited usage because they don’t provide the duration, database_id, file_id and page_id associated with the latch wait. In SQL Server 2012, these columns were added to the sqlserver.latch_suspend_end event, making it possible to predicate the event firing to track only allocation contention inside of tempdb. Listing 2 shows the beginning of the Extended Event session that we are going to build on throughout this section to track allocation contention inside of tempdb.
|
1 2 3 4 5 6 7 8 |
IF EXISTS(SELECT * FROM sys.server_event_sessions WHERE name = 'SQLskills_MonitorTempdbContention') DROP EVENT SESSION [SQLskills_MonitorTempdbContention] ON SERVER; GO CREATE EVENT SESSION SQLskills_MonitorTempdbContention ON SERVER ADD EVENT sqlserver.latch_suspend_end |
Listing 2 – Creating the event session and adding the event
To minimize the performance impact, it is important to define the predicates (filter) on our event session, especially for an event like the sqlserver.latch_suspend_end event that can occur very frequently inside of the engine. We must only capture information about the occurrences that matter to the troubleshooting we are doing. We are going to filter the event on database_id = 2 to focus strictly on tempdb and we’ll also want to filter on duration > 0 to cut down on events that fire without accumulating any wait time inside of the engine. Since the latch contention that we are interested are for PAGELATCH_UP or PAGELATCH_SH (and possibly PAGELATCH_EX), we want to focus on the SH and UP modes when the event occurs.
|
1 2 3 4 |
SELECT map_key, map_value FROM sys.dm_xe_map_values WHERE name = N'latch_mode' AND map_value IN (N'UP', N'SH'); |
Listing 3 – Finding the map_key for the important latch modes
The most important filter is to define a meaningful predicate on the page_id column being generated when the event occurs. It might seem logical to try adding a separate conditions that filter on specific page_ids, but there is a strict limit of 3000 characters on the length of the predicate for a single event in Extended Events so this severely limits the number of page_ids that can be tracked. However, there is a textual comparator within Extended Events, which is a type of predicate that can be used like a function to reduce the length of the predicate, while maximizing the number of pages being tracked. The package0.divides_by_uint64 textual comparator can be used to filter the events by page_id where the page_id is evenly divisible by a fixed value, in this case 8088 for PFS pages and 511,232 for GAM pages. This leaves us with a very simple predicate to track two of the allocation pages in the database, and since the SGAM pages only occur once per GAM interval, or every 3994MB within the data files, we can write additional predicates for the specific page_ids for the SGAM pages within our file sizes.
|
1 2 3 4 5 6 7 8 9 10 11 12 13 14 15 16 17 |
( WHERE ( database_id=2 AND duration>0 AND (mode=2 OR mode=3) AND (page_id<4 OR -- Initial allocation bitmap pages package0.divides_by_uint64(page_id, 8088) OR --PFS pages package0.divides_by_uint64(page_id, 511232) OR --GAM Pages page_id=511233 OR --2nd SGAM page 4GB-8GB page_id=1022465 OR --3rd SGAM page 8GB-12GB page_id=1533697 OR --4th SGAM page 12GB-16GB page_id=2044929 OR --5th SGAM page 16GB-20GB page_id=2556161 OR --6th SGAM page 20GB-24GB page_id=3067393 OR --7th SGAM page 24GB-28GB page_id=3578625) --8th SGAM page 28GB-32GB ) ) |
Listing 4 – Defining the event predicate
Now that we know the event that we want, and the ideal predicate defined for it, we now have to think about the data that we are collecting and how we want to consume it. Extended Events offers a number of targets that can be used to capture the event data being generated by an event session, but in this scenario two of them are ideal for performing analysis of allocation contention in tempdb, the event_file and histogram targets. The event_file is the best target for capturing and maintaining the raw event data being generated by our event session: This is because it allows us to do additional post mortem analysis if necessary, based strictly on the volume of events that could occur on an active system that is encountering allocation contention on tempdb. In addition to capturing the raw data into the event_file, the histogram target can be used to give us a quick look at the distribution of occurrence of latch waits by page_id in tempdb so that we can quickly get an idea of how much contention is occurring.
|
1 2 3 4 5 6 7 8 9 |
ADD TARGET package0.histogram( SET filtering_event_name=N'sqlserver.latch_suspend_end', source=N'page_id', source_type=0), ADD TARGET package0.event_file( SET filename='C:\SQLskills\SQLskills_MonitorTempdbContention.xel', max_file_size=100, max_rollover_files=10, increment=5) |
Listing 5 – Adding the targets for data collection
We could easily stop here with our event session definition and start it so that we can begin tracking our tempdb allocation contention, but this would require that we remember to start the event session every time our instance starts up. Extended Events offers a session level option, STARTUP_STATE, that we can set so that our event session starts automatically when SQL Server starts: This allows us to be able to capture the information consistently inside our environment.
|
1 |
WITH (STARTUP_STATE=ON); |
Listing 6 – Defining session options
Once the event session is created, we need to start it to begin the data collection. The first aim of this is to analyze the level of contention that is occurring based on our environments actual tempdb workload. This will allow us to make an informed decision about the number of files that we would need to add to our tempdb database to reduce this as much as possible.
Testing out the Event Session
An example method of generating allocation contention in tempdb is to create a temporary table, load it with data, and then run the same batch text from multiple sessions concurrently in the environment as shown in Listing 7 below.
|
1 2 3 4 5 6 7 8 9 10 11 12 13 14 15 16 17 18 19 20 21 22 23 24 25 26 27 28 29 30 31 32 33 34 35 36 37 38 39 40 41 42 43 44 45 46 47 48 49 |
USE AdventureWorks2012; GO SET NOCOUNT ON; GO WHILE 1=1 BEGIN IF OBJECT_ID('tempdb..#temp') IS NOT NULL BEGIN DROP TABLE #temp; END CREATE TABLE #temp ( ProductID INT PRIMARY KEY, OrderQty INT, TotalDiscount MONEY, LineTotal MONEY, Filler NCHAR(500) DEFAULT('') NOT NULL ); INSERT INTO #temp (ProductID, OrderQty, TotalDiscount, LineTotal) SELECT sod.ProductID, SUM(sod.OrderQty), SUM(sod.LineTotal), SUM(sod.OrderQty + sod.UnitPriceDiscount) FROM Sales.SalesOrderDetail AS sod GROUP BY ProductID; DECLARE @ProductNumber NVARCHAR(25), @Name NVARCHAR(50), @TotalQty INT, @SalesTotal MONEY, @TotalDiscount MONEY; SELECT @ProductNumber = p.ProductNumber, @Name = p.Name, @TotalQty = t1.OrderQty, @SalesTotal = t1.LineTotal, @TotalDiscount = t1.TotalDiscount FROM Production.Product AS p JOIN #temp AS t1 ON p.ProductID = t1.ProductID; END |
Listing 7 – Example query to cause tempdb contention
While this doesn’t make practical sense, it will easily create excessive allocation contention inside tempdb when used as the input query. We will execute it using SQLCMD at the command line to fire up Multiple concurrent sessions to use tempdb. Keep in mind that it requires concurrent activity to produce the type of tempdb allocation contention that we are aiming to reduce. In the past there have been a couple of articles and blog posts on other sites that have tried to refute the need for multiple tempdb files by running serial tests on a single connection. Unfortunately, this type of test doesn’t generate the type of in-memory latch contention that we are aiming to reduce. Because the tests weren’t designed to create and measure the impact of allocation contention inside of tempdb, it is difficult to draw any meaningful conclusion from them.
In the test query, the parameters are used only to avoid returning results sets back to the client during the execution. Merely by running the example from as few as three query windows inside of SQL Server Management Studio at once, you will see that PAGELATCH_UP waits on the allocation pages in tempdb are being generated on most environments. With this we can then begin looking at how many files it takes to eliminate the tempdb contention based on the actual latch waits occurring. I typically use sqlcmd.exe to run multiple sessions for demos during our Immersion Events, and with five concurrent sessions running for a minute we can check on the allocation contention using the histogram target’s aggregated data by page_id with the example code in Listing 8 below.
|
1 2 3 4 5 6 7 8 9 10 11 |
SELECT n.value('(value)[1]', 'bigint') AS page_id, n.value('(@count)[1]', 'bigint') AS wait_count FROM ( SELECT CAST(target_data AS XML) target_data FROM sys.dm_xe_sessions AS s INNER JOIN sys.dm_xe_session_targets AS t ON s.address = t.event_session_address WHERE s.name = N'SQLskills_MonitorTempdbContention' AND t.target_name = N'histogram' ) AS tab CROSS APPLY target_data.nodes('HistogramTarget/Slot') AS q(n); |
Listing 8 – Querying the histogram target
To make use of this test across multiple sessions save the example code into a .sql file and then call it from the command line in a .cmd file similar to the example in Listing 9.
|
1 |
sqlcmd -S. -i"TempdbClient.sql" |
Listing 9 – Using sqlcmd.exe
This can then be expanded by using another .cmd file to start up multiple copies of the test concurrently just as I do in to the example in Listing 10.
|
1 2 3 4 |
start RunTempdbClient.cmd start RunTempdbClient.cmd TIMEOUT /T 60 /NOBREAK TASKKILL /IM sqlcmd.exe /F |
Listing 10 – Building a workload generator
The above will start two different sessions of the test workload, and then automatically kill those sessions after a 60 second timeout expires. Additional sessions can be added by adding additional start RunTempdbClient.cmd commands into the script file to scale the workload for various test scenarios. Using this method along with some additional code for collecting results into a table and resetting the Extended Events session between tests a full repeatable test harness can be created to demonstrate the method of tuning tempdb file count based on the workload being performed.
On my test VM, which is configured with four vCPUs, 8GB RAM and uses two VHDs stored on two OCZ Vertex 3 240GB SSDs in RAID 1 for the virtual hard disk storage (average read and write latency for all tests was under 5ms), I used this test harness to measure the allocation contention in tempdb under multiple configurations, with 2, 3, 4, 5, 6, 7, 8, 9, 10, 15, 20, 30, and 50 concurrent connections starting with a single tempdb file that was created at 32MB in size (space usage isn’t heavy with this example workload), and then with 2, 4, 6, 8, and 12 tempdb files, all configured at 32MB in size and with an instance restart between changes in tempdb configurations to ensure that tempdb was clear at the start of each test run. The results of these tests can be seen in Figure 1, which shows the average number of latch waits that occurred across 5 different iterations of the tests for all of the configurations possible on the test VM.
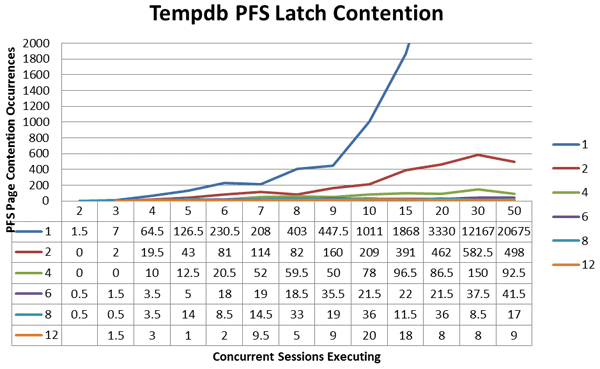
Figure 1: Tempdb latch_suspend Events on allocation pages
The data shows that the number of files needed to reduce the allocation contention is very dependent on the level of concurrent workload being performed. This, of course, is a contrived workload that is merely designed to drive latch contention on the allocation bitmap pages in tempdb. For these tests, all of the tempdb data files were created on the same virtual hard disk in the SQL Server: This is because this workload doesn’t actually write a large amount of data into the data files while it is executing, and the allocation contention is in-memory latch contention that is not related to physical I/O operations to the data files. In a production environment where tempdb is actually going to have a large number of physical I/O writes to tempdb, it may be best to spread the tempdb files across multiple disk arrays physically to reduce the I/O contention for writing to the data files as a part of the workload. Keep in mind that the physical file layout is not going to affect the PAGELATCH contention in any way; it will only affect the physical writes occurring to disk. The information in Figure 1 only shows the count of the latch waits actually occurring it doesn’t show the accumulated wait duration in milliseconds that the latch waits caused in the environment. To look at the accumulated wait duration, and the impact that each of the file configurations has on reducing the latch wait time on the allocation bitmap pages in tempdb, I ran a separate set of tests using the same workload, but only at the 50 concurrent session level, which drove the worst allocation contention against tempdb. However, this time each of the tests was allowed to run for fifteen minutes so that a larger number of wait events could occur, and more wait time could accumulate for aggregation. The results for each of the tests were aggregated from the event_file target using the new Management Studio UI for Extended Events but they could also be aggregated using a query like the one in Listing 11.
|
1 2 3 4 5 6 7 8 9 10 11 12 |
SELECT SUM(n.value('(data[@name="duration"]/value)[1]', 'int')) AS duration FROM (SELECT CAST(event_data AS XML) AS event_data FROM sys.fn_xe_file_target_read_file( 'C:\SQLskills\SQLskills_MonitorTempdbContention*xel', 'See its not used', -- No metadata file required in 2012 NULL, NULL) ) AS tab CROSS APPLY event_data.nodes('event') AS q(n) |
Listing 11 – Querying the event_file target to aggregate wait duration
Using the duration information and charting it out, we can see that we reduced our wait times drastically by going from a single file to two files. It went from the equivalent of 1992 seconds (which is off the chart due to the skew it created making the other results impossible to interpret) down to just under 24 seconds. Moving from two files to four files reduced the wait time down to 4.7 seconds, and moving to six files (yes on a four vCPU system that is a VM) reduced the wait time to just under 2 seconds.
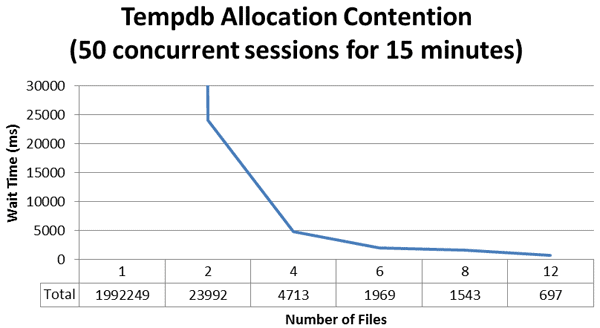
Figure 2 – Wait duration in milliseconds – 50 concurrent sessions for 15 minutes
Where exactly is the ideal configuration for this environment? Looking at the results we can see that at twelve files we had the least amount of overall contention based on the number of latch suspend events that occurred as well as the total duration of wait time that was accumulated. However, if we keep things in perspective, at four files, or a 1:1 ratio, we had 4.7 seconds of total wait time for this specific workload. If we change the workload to only 5 concurrent sessions, the results are different.
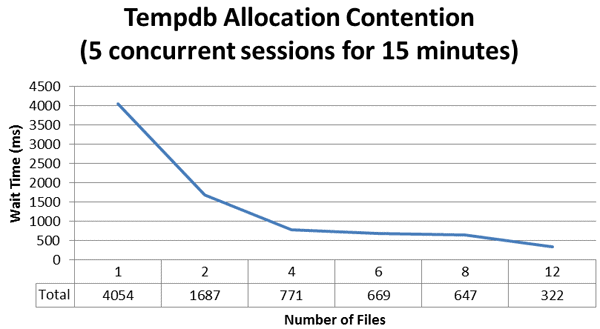
Figure 3 – Wait duration in milliseconds – 5 concurrent sessions for 15 minutes
By comparing Figure 2 to Figure 3 you’ll see that, at 1/10th of the workload, the tempdb allocation contention isn’t anywhere near as bad. With a single file, the latch wait duration is less than a four file configuration for the higher workload. With two files there is less than two seconds of total wait duration over the fifteen minute test period, which would make this somewhat difficult to track down with the sys.dm_os_waiting_tasks DMV, and probably wouldn’t have a significant affect to the system throughput. You could still see a reduction in contention by going to four files, but then after that it levels off for six and eight file configurations.
Summary
The advanced diagnostics provided by Extended Events in SQL Server 2012 gives us better insight into the bottlenecks that are occurring inside of our SQL Server environments. Through the use of Extended Events we can now take the guesswork out of configuring tempdb and know with more certainty the benefit of the configuration changes that we have made . By subsequently monitoring with Extended Events, we can check whether any workload increases or code changes are leading to such an increase in allocation contention in tempdb that we would then need to change the configuration.
This document contains proprietary information and is protected by copyright law.
Copyright © 2026 Red Gate Software Limited. All rights reserved
Load comments