
Power BI app is used to provide updateable visualizations of an organization’s business data; its graphs, plots, tables, reports and other types of visualization. It is designed to make it easier and quicker to deploy summarizations of business data for that business to gain insights from. Once your dashboard is deployed to the Power BI app, it can be viewed from anywhere, at any time. The Power BI app also supports row-level security to secure the data access. In addition, you can, with periodic data refresh, update the report dynamically with the latest data. To achieve all this functionality, your data or dashboard should be in the Power BI app, and you will need to use the Power BI Gateway too.
In this article, we will first describe how to create and publish a Power BI desktop report in Power BI App, explaining what components and accounts are needed to link and publish Power BI desktop dashboard to the Power BI app. Then we will show how to refresh Power BI dashboard periodically and explain how to connect Power BI app and Power BI desktop. Finally, we will create user roles in Power BI desktop and assign roles to users in Power BI app to implement row level security.
Getting Started
You will need access to
- Power BI Desktop: in order to connect to a SQL data source and create the visualization report.
- Power BI Gateway: to act as a bridge between Power BI app and the data source.
- Power BI App: which is a Web-based visualization tool to view your data anytime, anywhere.
- SQL Server Database: to create an example database table. You can create this table using some other data source as well.
- An organizational email account: to sign in Power BI app and both Power BI desktop and gateway.
Power BI Desktop
Using Power BI desktop, we can connect to different type of data sources and in one report we can connect to more than one data source , create relationship between data objects, massage the data using DAX query, perform real-time data analysis, integrate R script (For details about integrating R packages into SQL server, Please refer this link), and create rich visualizations. Power BI app provides the means of giving your colleagues access to these.
Power BI App:
Power BI App is a web-based application; a place to view your published application. Using Power BI app, you can share your application to many people. Power BI App uses HTML5 technology, so your application is compatible with mobile devices. In Power BI app, we can also edit the existing report or dashboard.
Publishing a Power BI Desktop Report in Power BI App
Here we will create a report in Power BI desktop. In Power BI desktop, we can easily create charts and reports. Power BI desktop provides several types of visualization component. We can also create our own visualization component using the Power BI API. To view reports in a web browser, we will publish our reports in Power BI app.
To create any chart, we need some data. We will run the following SQL script in a SQL database. It creates an employee table and adds few records in table.
|
1 2 3 4 5 6 7 8 9 10 11 12 13 |
CREATE TABLE [dbo].[employee]( [name] [varchar](50) NOT NULL, [lastname] [varchar](50) NOT NULL, [salary] [int] NULL, JobCategory [varchar](50) NOT NULL, ) INSERT INTO [employee]([name],[lastname],[salary],JobCategory)VALUES('Tom','Kelle',500,'Doctor') INSERT INTO [employee]([name],[lastname],[salary],JobCategory)VALUES('Mike','Moore',150,'Plumbing') INSERT INTO [employee]([name],[lastname],[salary],JobCategory)VALUES('Sara','Davis',500,'Lawyer') INSERT INTO [employee]([name],[lastname],[salary],JobCategory)VALUES('Natala','Smith',250,'Nurse') INSERT INTO [employee]([name],[lastname],[salary],JobCategory)VALUES('Mitchelle','Taylor',200,'Roof') INSERT INTO [employee]([name],[lastname],[salary],JobCategory)VALUES('Tom','Anderson',200,'clerk') INSERT INTO [employee]([name],[lastname],[salary],JobCategory)VALUES('Peter','Williams',300,'business') |
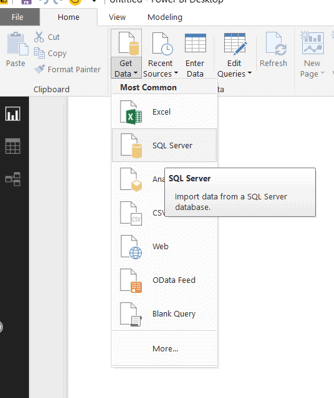
To create a report, we need to bring our data into Power BI desktop. Open Power BI desktop and click on ‘Get Data’ and select ‘SQL server’ as the data source.
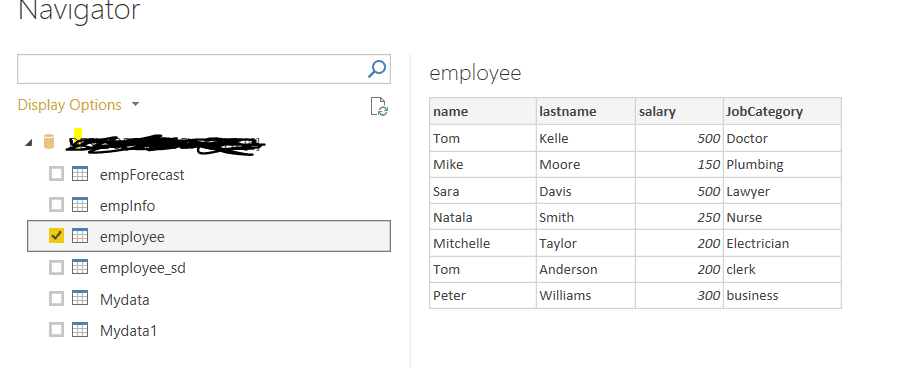
Connect to the database in Power BI, and then select the employee table.
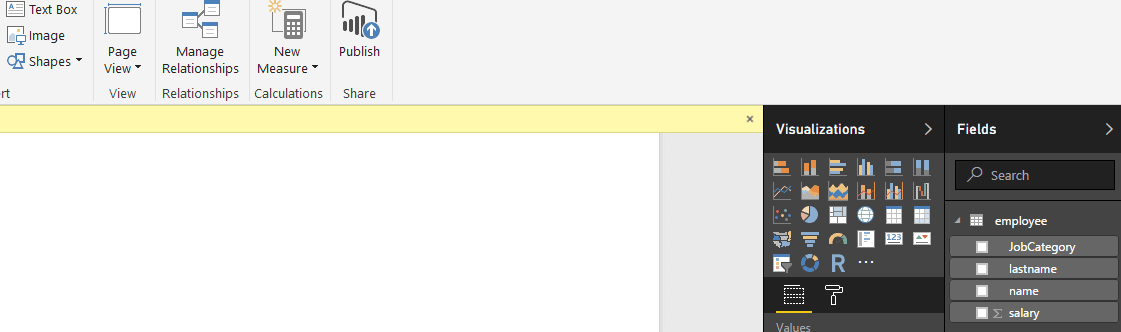
Your Power Bi desktop screen should look like the screenshot below. Now we can create a Power BI report using various visualization components.
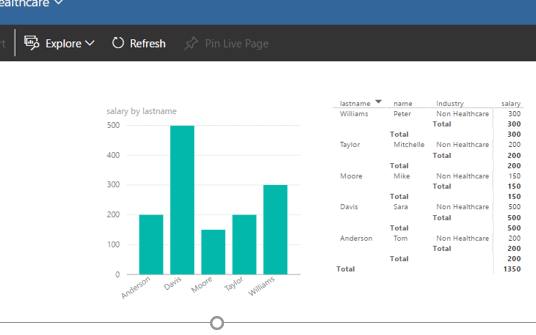
Here we will use a plain ‘straight’ table. Double-click on ‘straight table’. A blank table will display in the report section. Select the appropriate fields in the straight table. Check ‘lastname’ and ‘salary’ fields from the dataset.
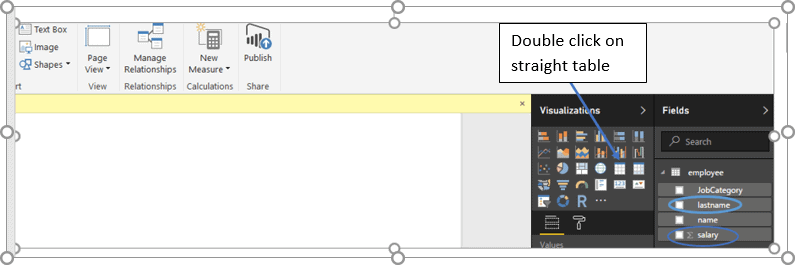
Selected fields appear in the report area. It is very easy to load data and create visualization in Power BI. Power Bi also identifies the dimension and measure from the dataset. Based on the data type of the field, Power BI identified the ‘salary’ field as a measure, as you’ll see from the ∑ symbol in ‘salary’ field.
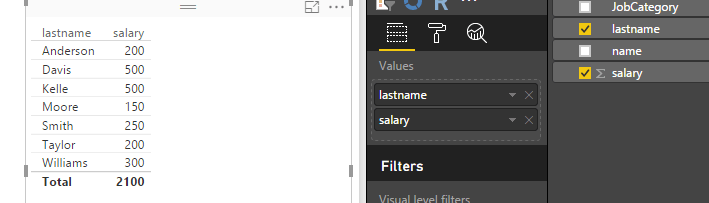
In table format, you can see the employee ‘salary’ based on employee ‘last name’. We can now save the Power BI desktop report with the name “employee”. In this example, the dataset name is also “employee”. This duplication of name does not matter. The Name of the Report and dataset can be the same.
Once we have Power BI desktop, Power BI app and the account set up, we then follow these next steps to publish dashboard to Power BI app.
Publish the app.
First, open Power BI desktop and sign in to Power BI desktop.
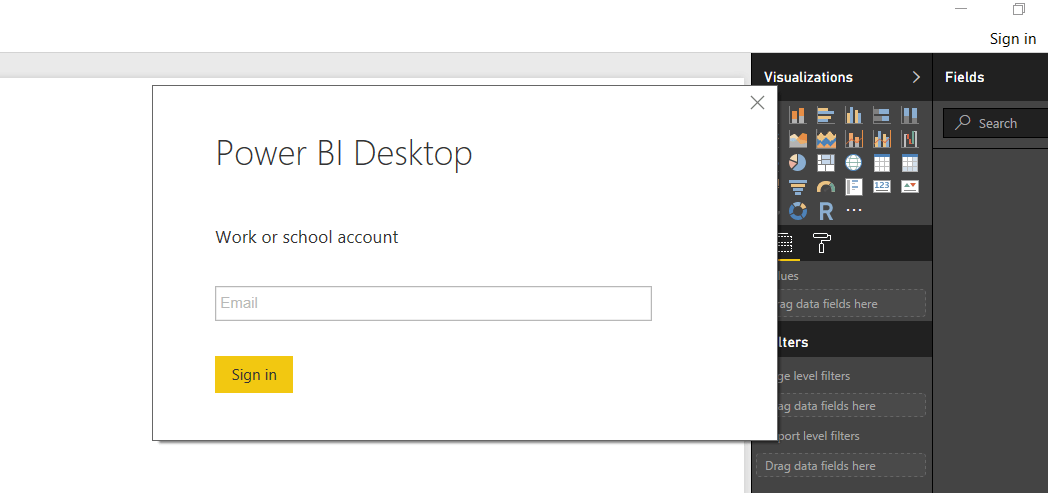
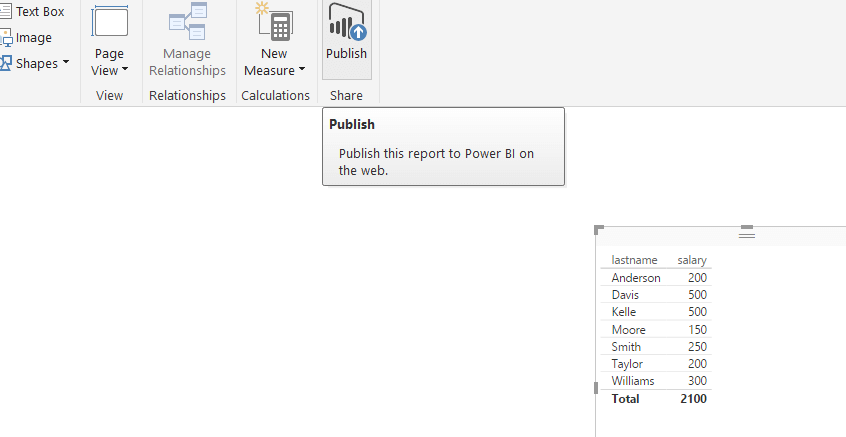
To sign in, use your org/school account in power BI desktop and in Power BI app. From ‘home’ tab, click on ‘publish’ button.
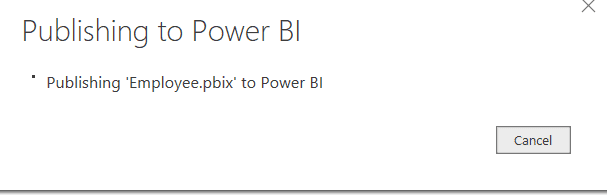
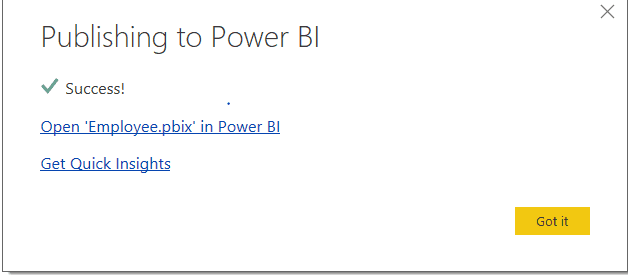
Now Power BI desktop reports that the dashboard is published.
Verifying that the published report has been properly published
We now verify that all is working. Follow these steps to make sure that we can see our Power BI desktop report in the Power BI app.
- Open your browser and type app.Power BI.com; then login to your account. We will need to use the same account on Power BI desktop and Power BI app so that the document created In Power BI desktop is avilable in the Power BI app.
- In the left panel, you will see ‘My workspace’.
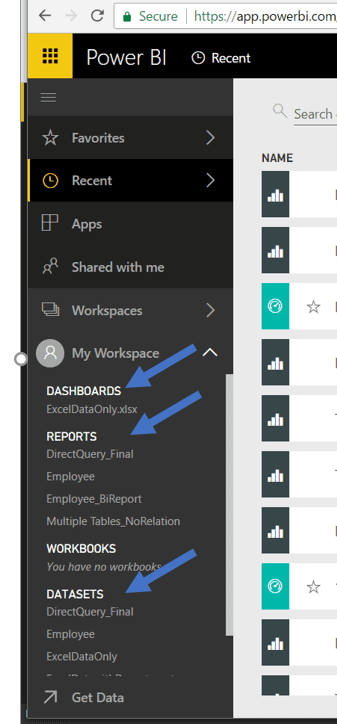
- Under ‘My Workspace’, you will see a few options.
- ‘Datasets’: Our dataset name “Employee” will display under Datasets section.
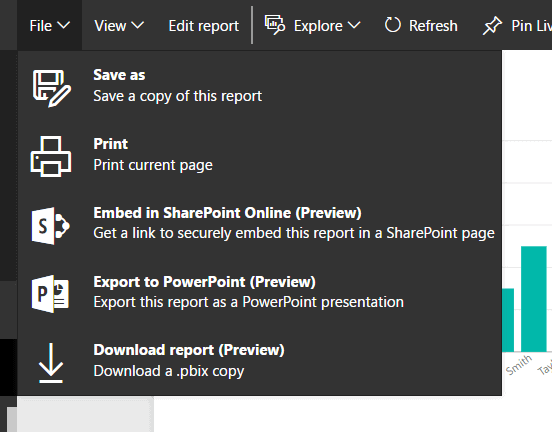
- ‘Reports’: Our report name ‘employee’ will show under Reports section. Open the Employee Report from File menu. You can print the report, and export the report to PowerPoint.
- ‘Workbooks’: If we deploy an Excel workbook to Power BI app, ‘Excel file’ will show under the ‘workbook’ section.
- ‘Dashboards’: we can create a dashboard using one or more reports.
- Go to ‘Reports’’Employee Report’ and click ‘pin visual icon from any chart’ .
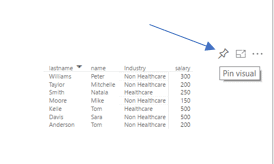
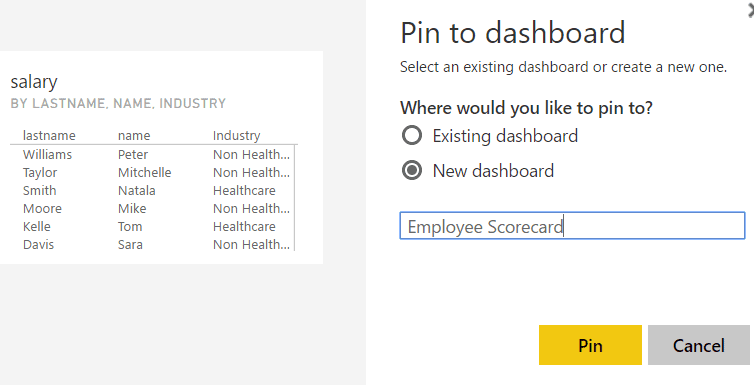
- click on ‘new dashboard’, giving the dashboard the name “Employee Scorecard” and click “PIN”. From multiple different reports, we can pin the chart and create a new dashboard in Power BI app.
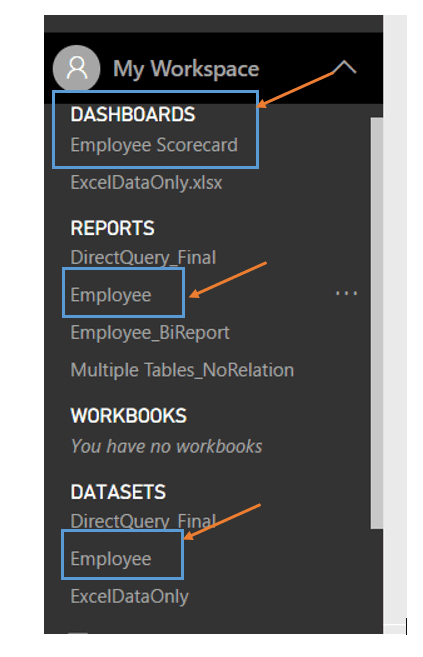
- In the Power BI app, you can see the dashboard, report and dataset that we have created.
Schedule refresh in Power BI
Now that we have deployed the dashboard to Power BI App, we can set the dashboard data to refresh periodically and the business users can then see latest data. If we do not refresh report data in Power BI app then data will be stale in the Power Bi app. To have the latest data in a report, it is far better to automate the refresh process rather than relying on a business user to login to the Power BI app every day and perform a manual refresh.
In the Power BI app, we can schedule this refresh action, but to schedule the refresh, Power BI app needs to connect to Power BI desktop and to the data sources of Power BI desktop. We need Power BI gateway for this connectivity.
This is very smart way to connect data. Your data remains within your data center, Power BI gateway is also within your premises. To retrieve data, Power BI app connects to Power BI gateway.
Installing Power BI Gateway
Power BI Gateway is a bridge between on-premise data source and Power BI App. To retrieve data from the data source, we need to install Power BI gateway.
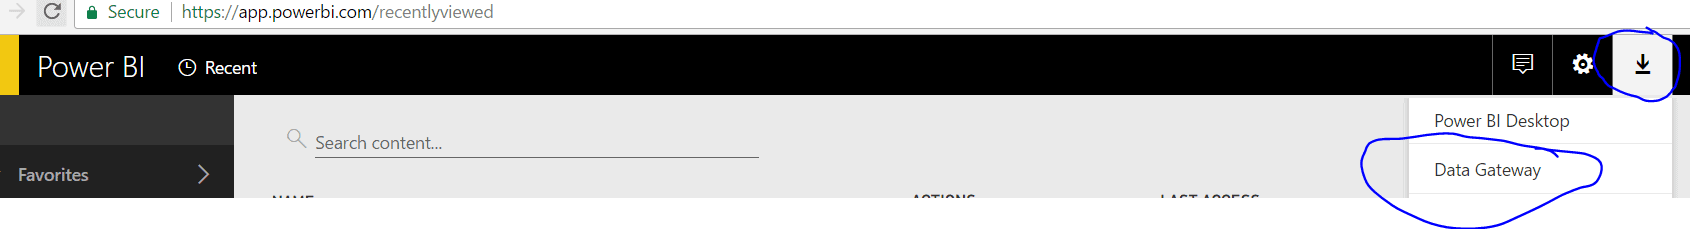
- In Power BI App, there is an option to install Power BI gateway. Open app.Power BI.com and click on download button on right side and you will see the ‘data gateway’ option.
- Once you click on the ‘Data Gateway’ option, the new window will open and you can install the Data gateway.
There are two modes in Power BI gateway, ‘On-Premise data gateway’ can be shared and used by several people, while ‘personal gateway’ is used by only you.
While installing Power BI gateway, you need to provide service name under which gateway service will run.
At the end of installation, you need to provide Power BI app account details. Power BI gateway can be installed on the same machine, where your data source is located or can be install on different machine.
Scheduling a Report:
Once Power BI gateway is installed, we can now schedule a report. Scheduling, in the Power BI app, will help us to refresh our data and keep the report data up-to-date.
- Open app.Power BI.com, sign in with your work or school account.
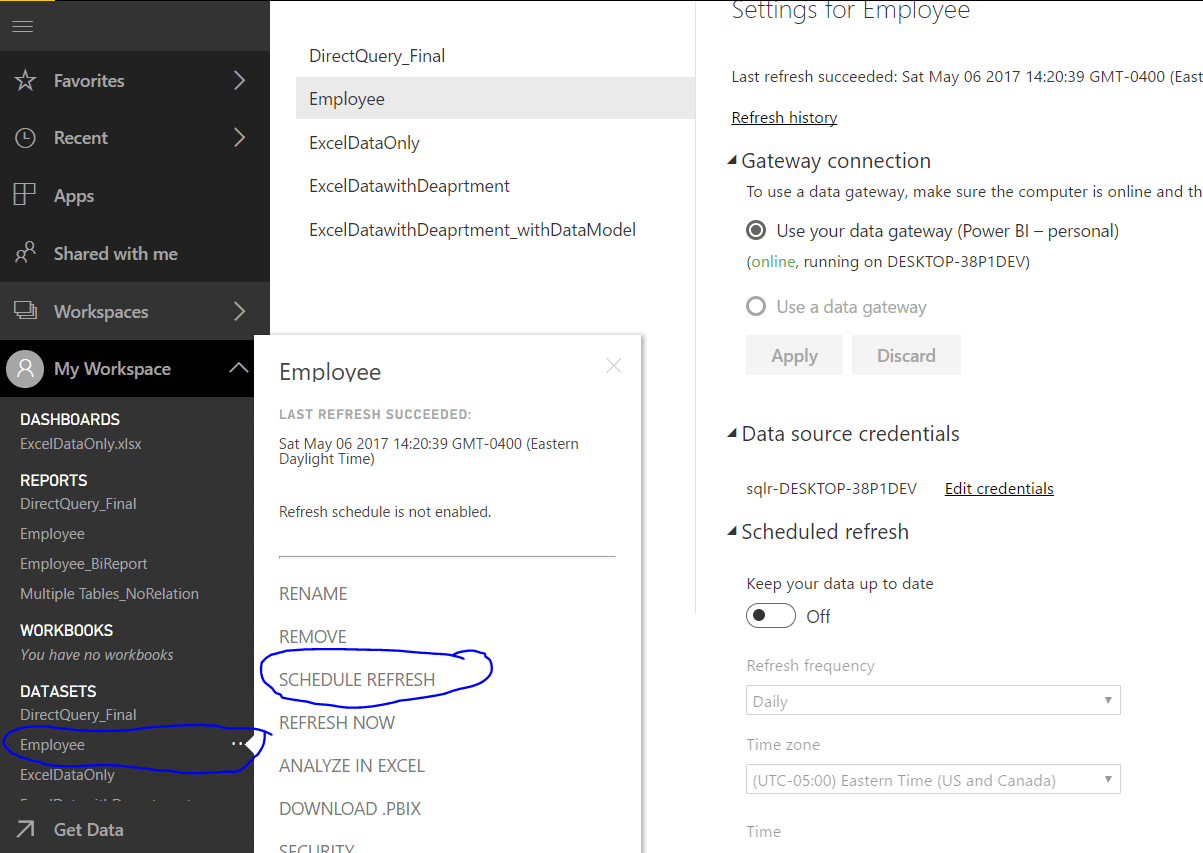
- In left panel, you need to navigate to ‘My workspace’ ‘database’
- Click the ellipse(…) on ‘Employee’ dataset
- Click on ‘schedule refresh’
Now we need to configure various schedule properties
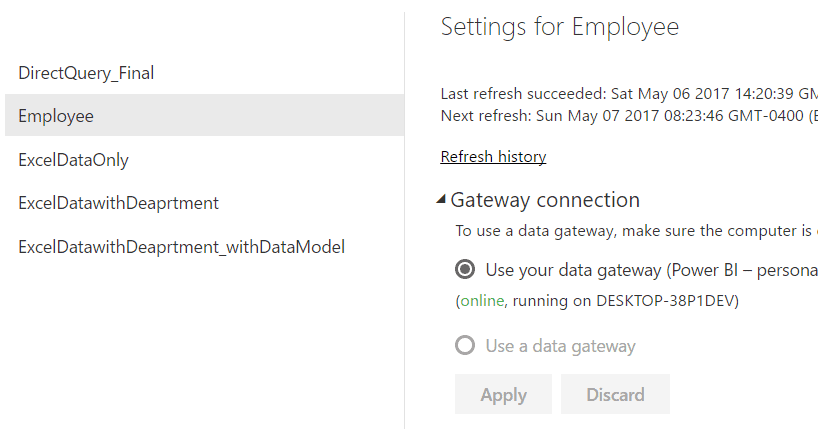
Gateway Connections
There are two options, ‘Use your data gateway’ and ‘Use a data gateway’
- ‘Use your data gateway’: If your gateway and Power BI app is using same account; this option will identify the gateway automatically.
- ‘Use a data gateway’: You should assign the gateway name manually.
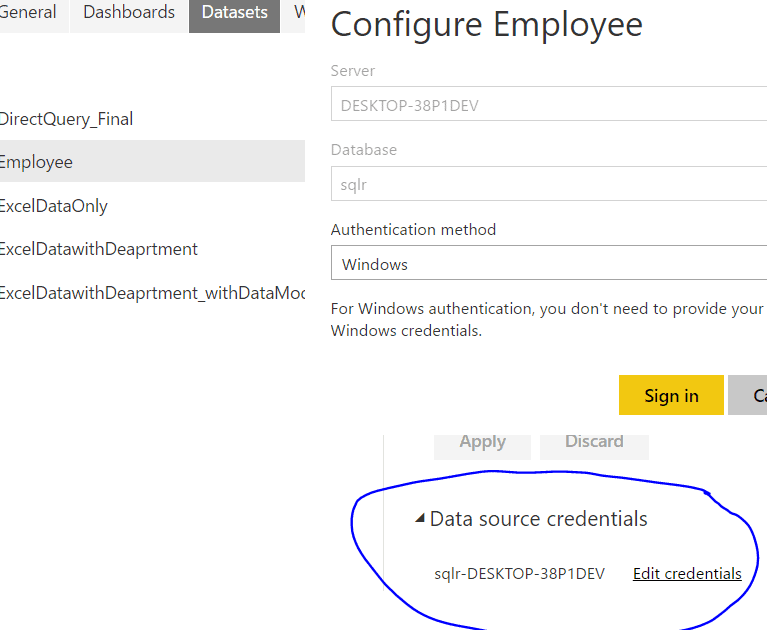
Data Source Credentials
Data source credential is useful to connect to report data source.
Under Data Source credentials, click edit and provide data source connections. Once these credentials are provided, click the ‘Sign in’ button.
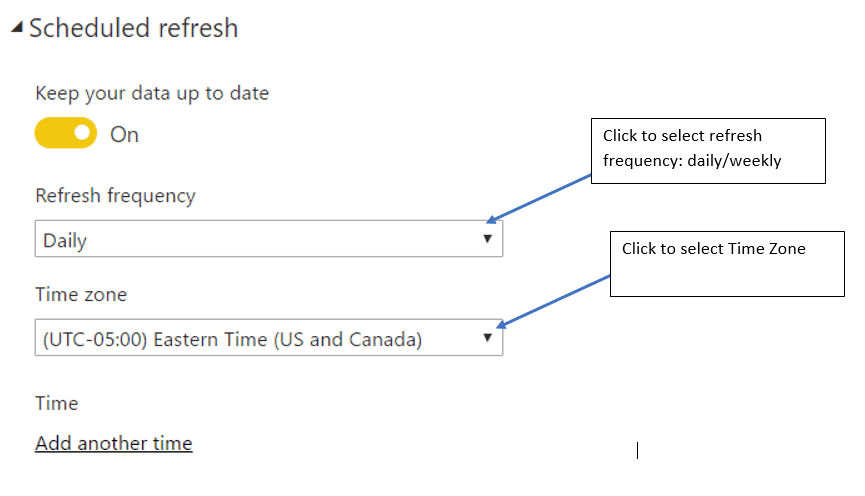
Scheduled Refresh
Schedule the ‘refresh frequency’ drop-down list to be either daily or weekly; Select the time zone and the time to start refreshing the data. The ‘Time zone’ set up will help to refresh data based on preferred time zone. Finally, click the ‘Apply’ button to schedule the refresh.
If the gateway is not running, then the request from Power BI app to the data source will fail and you will get this message. 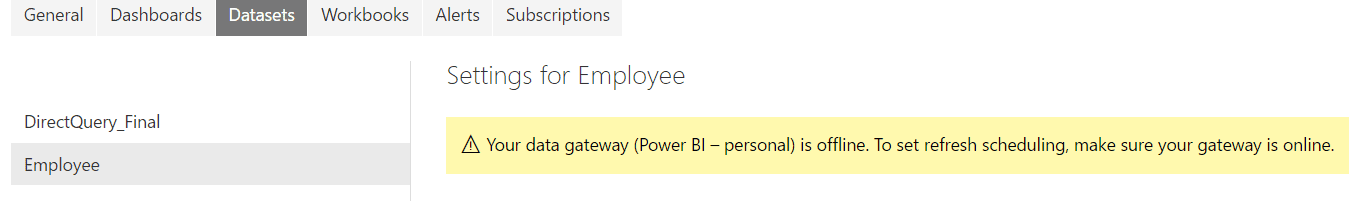
In order to start or stop the gateway, Open the Command prompt with administrator access and run this command to start the service …
|
1 |
net start PBIEgwService |
… or this command to stop the service:
|
1 |
net stop PBIEgwService |
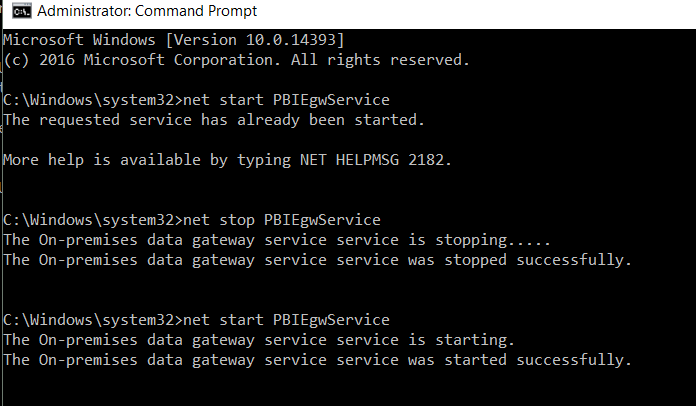
You can also open “On Premised data gateway” desktop app and start/stop the service.
If you have followed these steps correctly, your Power BI app should connect to the data source using Power BI gateway and so the Power BI app should auto-refresh the data at the scheduled time.
Data Security using Power BI Desktop
Once you have created the dashboard in Power BI desktop and published the dashboard to Power BI App, the next step is to share the dashboard with several users. Before you do this, you need to implement data security. Power BI supports row-level security. Defining row-level security is a two-step process. First you must create a User Role in Power BI Desktop and then you can assign users to the user role in the Power BI app
Define Role with filter criteria.
You can create and manage roles only in Power BI desktop. You cannot create Roles in Excel and use them in Power BI app. In this example, we will create a user role and determine access based on the “industry” field. This ‘industry’ field is not available in our data source. Power BI desktop allows us to create this as a new derived column.
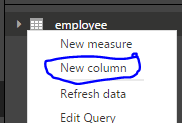
In Power BI desktop, click ellipse(…)next to the table name and select ‘New column’.
Create a new calculated field. Use the following DAX expression.
|
1 |
Industry = if(employee[JobCategory] ="Doctor","Healthcare",if(employee[JobCategory]="Nurse","Healthcare","Non Healthcare")) |

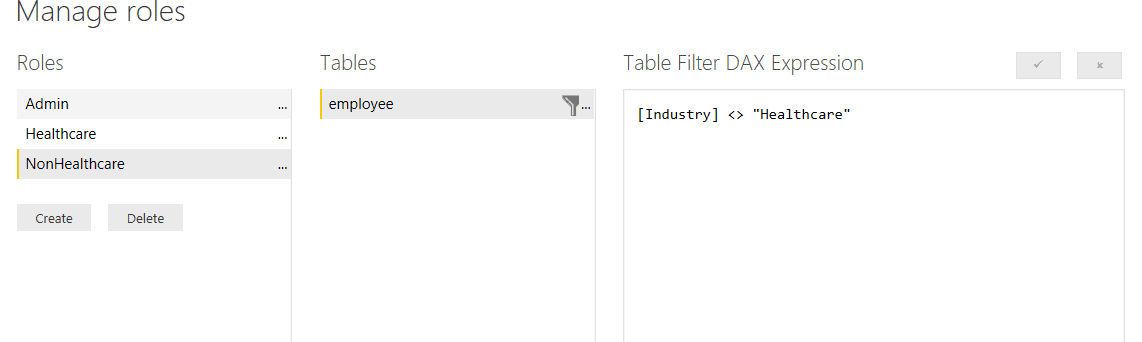
Now, in Power BI desktop, click on the ‘Modelling’ tab on top. You will then see two options under the security section, called ‘Manage Roles’ and ‘View as Roles’. First, click on ‘Manage Roles’ and a new popup window will open. In this popup windows click on the ‘create’ button and on the left side of window and then assign a role name.
Click on the ellipse(…)icon next to table name and click on ‘Add Filter’.
Here, I am creating a ‘Healthcare’ Role using the ‘Industry’ field. 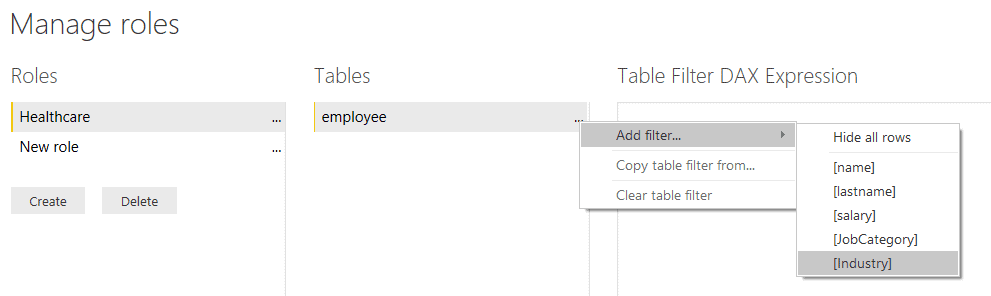
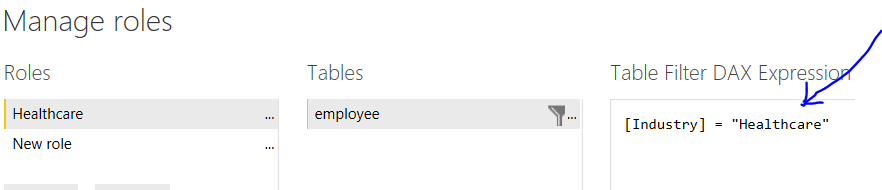
In the DAX expression in the ‘Table Filter DAX Expression’ column, we are applying a healthcare filter.
Similar way, I have created Non Healthcare role, where my DAX expression is Industry <>”Healthcare”. We are not adding any filter in the ‘admin’ role.
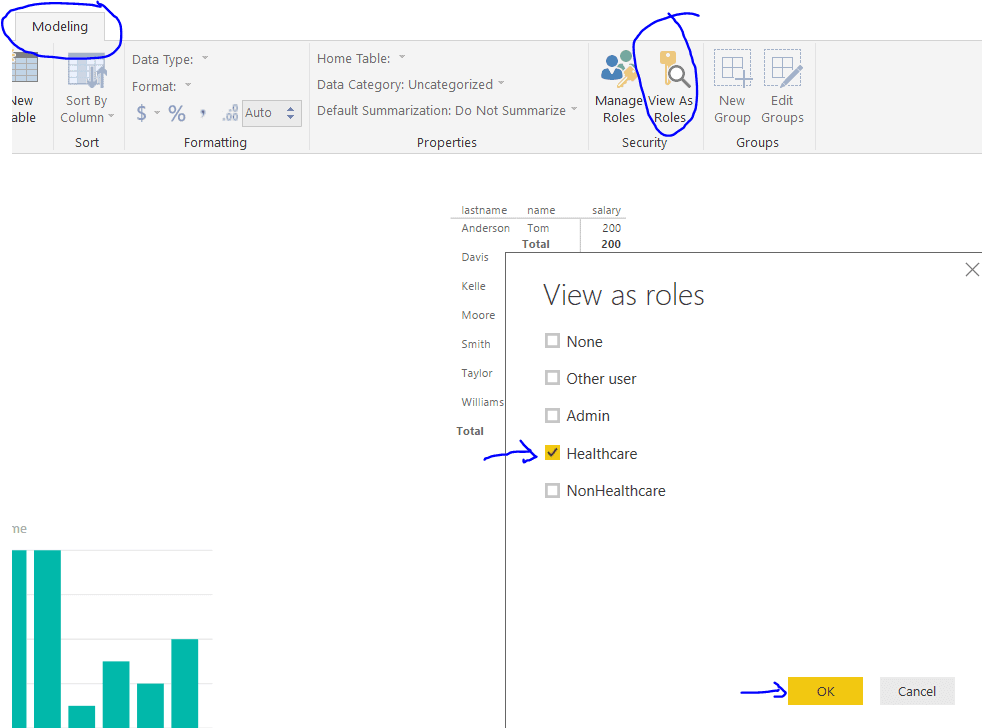
Now, once all Roles are defined, we can verify our Role script within Power BI desktop only
Go to ‘Modelling’Click on “View as Role” and select ‘Healthcare’.
- Once you click the ‘Ok’ button, the data will filter only for the healthcare industry.
- Once everything looks ok, please save the report and publish the report to Power BI app.
.
Associate users to one or more roles.
The next step is to assign one or more roles to users. Role assignment to user is not possible in Power BI desktop, this feature is available only in the Power BI app.
- Go to Power BI app. Open app.Power BI.com, login using your account.
- In left side panel, you will see dataset and Report name ‘Employee’.
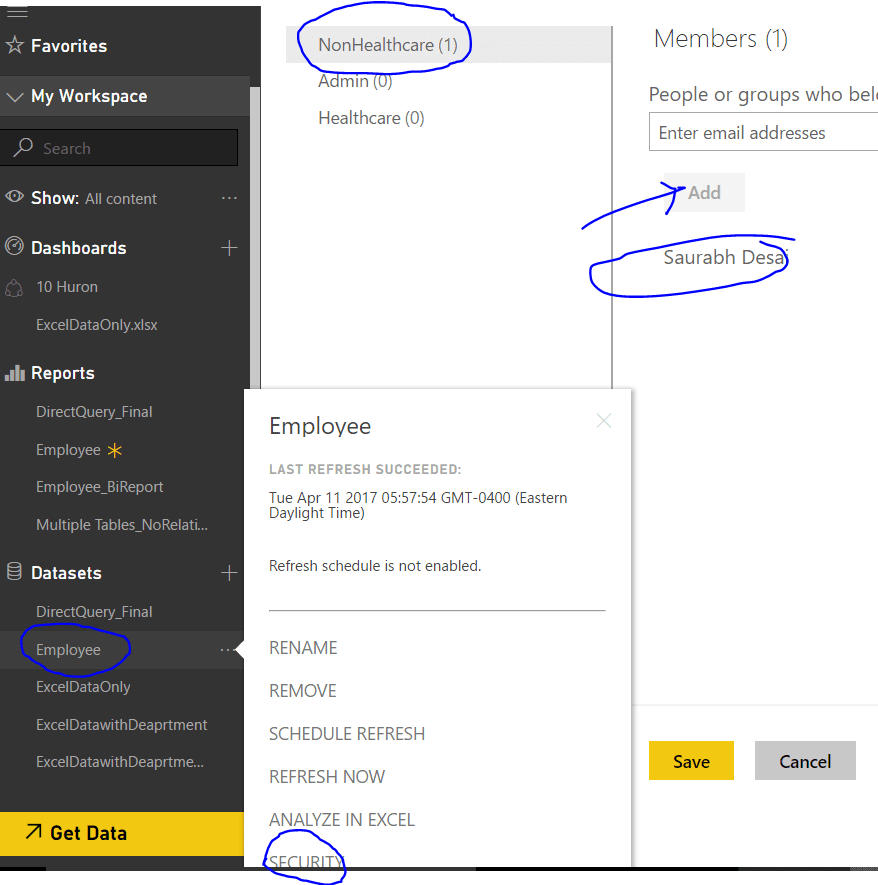
- Click on ‘Dataset’’Employee’ ellipse(…) icon ’Security’
- Select a role name under which we would like to add users. In Email address field, we can see only those email address which are part of our organization.
- Type the user’s email address and click the ‘Add’ button. Once we are done with adding users, click the ‘save’ button.
- To validate the Roles in Power BI app, click on’ Role Name’ and select ‘Test as Role’.
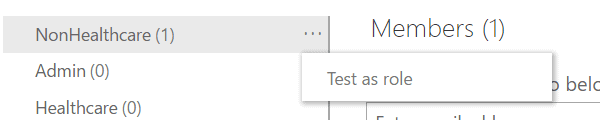
We can see only non-Healthcare data in our dashboard. We have successfully implemented row level security in our dashboard.
Conclusion
In this article, we have seen the entire Power BI process from connecting to the data, creating the report, publishing it, securing the data and scheduling the refresh of the report. Power BI desktop and Power BI app work together to provide a user-friendly tool for both developers and business users: With a few clicks, you can create derived columns, schedule the data refresh and secure the data. Power BI gives the users of the data in the business a way to create and distribute reports and visualizations from the data without requiring complex IT operational support and assistance, and provides IT developers a means to respond rapidly to changing business requirements.
This document contains proprietary information and is protected by copyright law.
Copyright © 2026 Red Gate Software Limited. All rights reserved
Load comments