
SQL Server Reporting Services (SSRS) is a server-based reporting tool, ideal for paginated reports. It represents a centralized approached to data governance, with all of your report files located on a central server. However, there are some self-service features available, such as users being able to fill in parameters, run reports on demand, and even create their own reports.
By default, reports in SSRS are displayed using the HTML 5 rendering engine, which Microsoft added back in 2016. Despite the rendering being web-based, you can export reports to a number of file formats, including PDF, CSV, Word, and Excel. These files can be scheduled to go out in a regular email or to be saved to a file share.
Future articles will cover topics like how to build and format your reports, visual controls, advanced features, security, and deployment. Before talking about how to use SSRS, I’ll spend some time reviewing the Microsoft reporting landscape, which has changed dramatically over the past four years. Deciding which tool to use has become a more complex proposition.
Microsoft Reporting Landscape
Currently, there are four primary tools for rendering reports within the Microsoft ecosystem:
- SSRS
- SSRS Mobile Reports (formerly Datazen)
- Power BI
- Excel
Each of these tools has an ideal use case, but there is significant overlap in capabilities
among all of them. Your choice in a reporting tool is going to depend on your existing
skillset, the type of users you are supporting, and how those users wish to consume the reports.
As a simple example, more and more users are consuming reports outside of the office or on their mobile devices. That trend is going to impact which solution you choose. Here is a review of the options available.
SSRS
SSRS was originally released in 2004 as an add-on for SQL Server 2000. Since then it has gone through many changes and enhancements. Fundamentally, however, it is the same product at its core. SSRS is a canvas-based reporting tool where you add reporting objects (tables, charts, text, images) to a blank canvas until you have your final report.
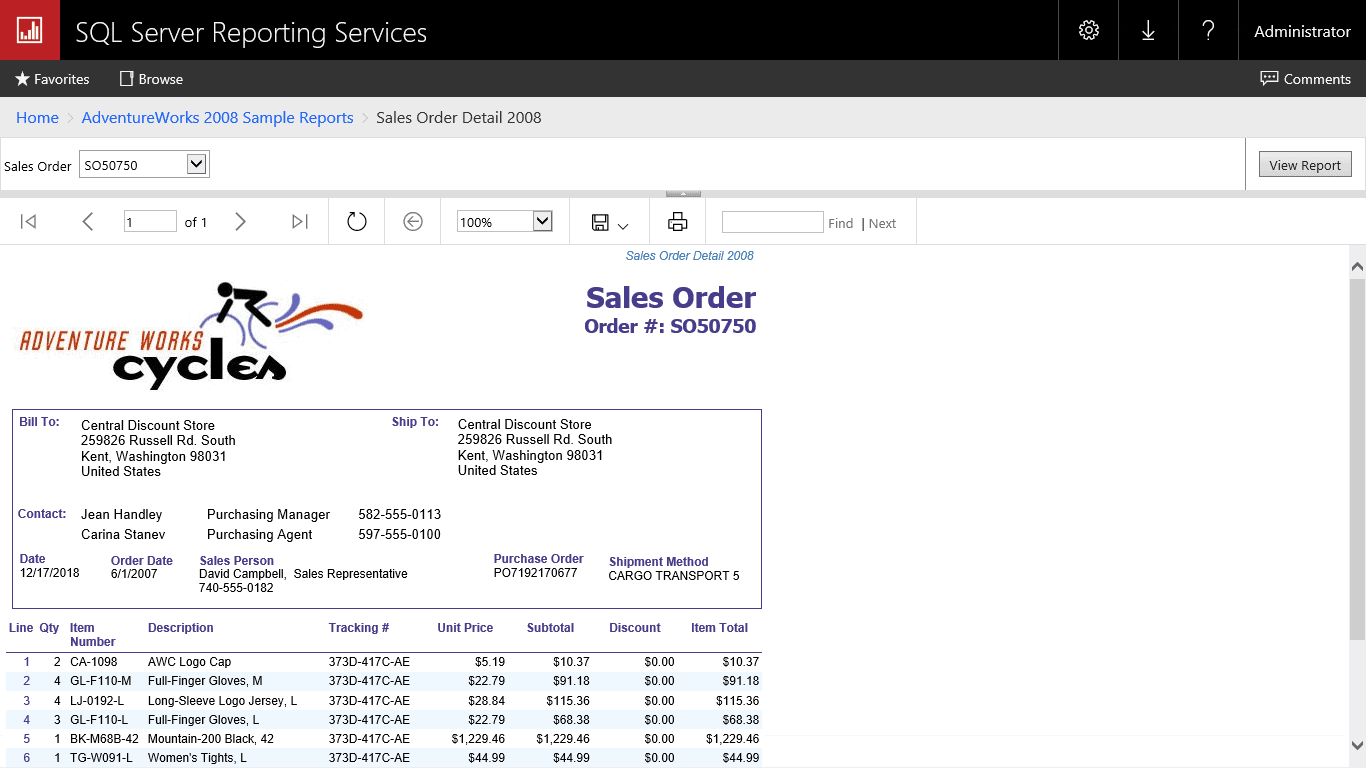
SSRS reports are traditionally accessed via a central web portal. Permissions can be specified on a site-wide level, folder level or even on individual reports. This allows for a granular set of permissions, which can be important if you are dealing with financial data or audited reports.
SSRS Mobile Reports
Even though SSRS Mobile Reports are ostensibly part of SSRS, I think of them as a different product. Partly because they serve a completely different use case and because they initially were a different product! SSRS Mobile Reports were originally a product called Datazen. In 2015, Microsoft acquired the product from ComponentArt and rolled the software into SSRS.
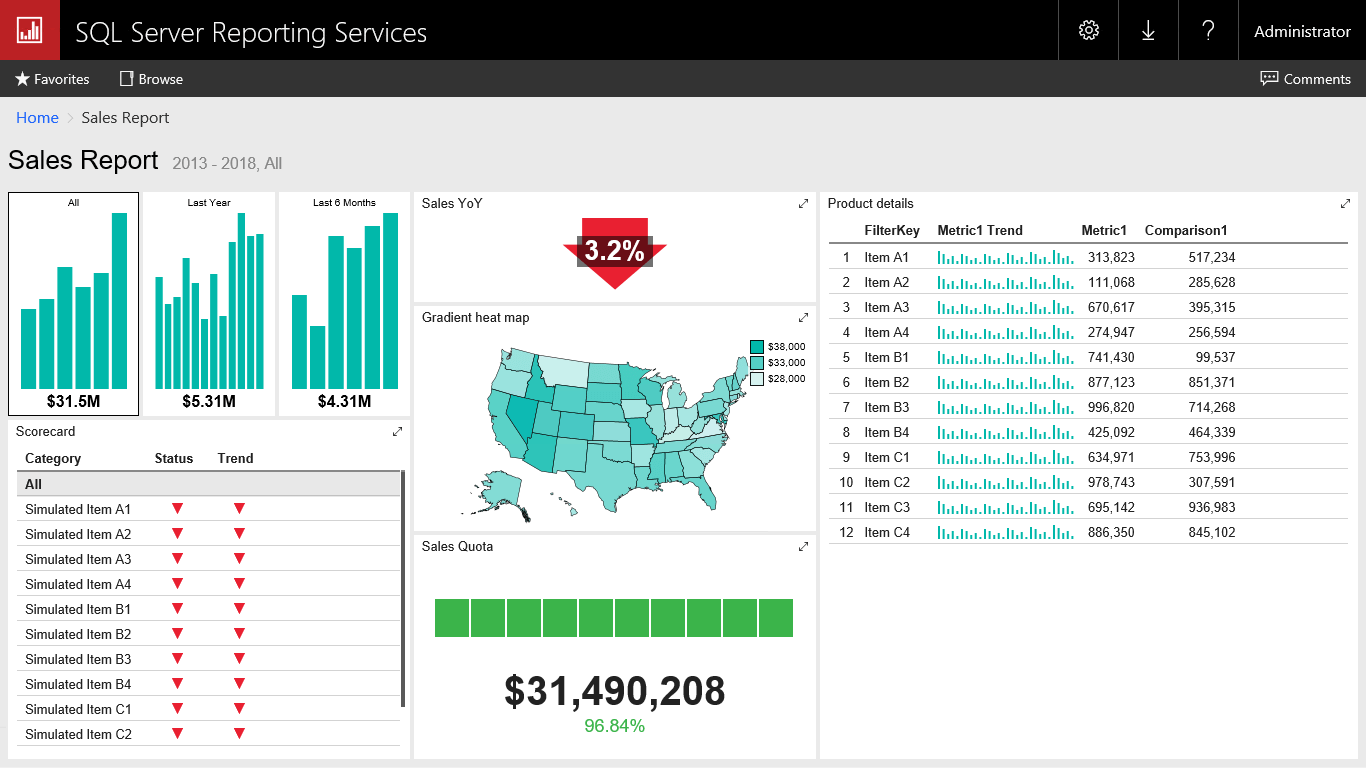
The primary use case of SSRS Mobile Reports is self-explanatory. Optimizing SSRS reports, which are rigid and document-oriented, for mobile devices can be quite the challenge. Instead, SSRS Mobile Reports takes a grid-based approach with charts that are fluid and work at a variety of sizes.
Power BI
If SSRS is now entering its teenage years, Power BI is practically a toddler. Power BI was initially a loosely related set of Excel add-ins: Power Pivot, Power Query, Power View, and Power Map. However, in 2014 the tool was combined and rebranded as a cloud-based product. While the underlying data engines are the same, Power BI today is an entirely different product from the Excel 2010 add-ins.
It can be a struggle at times to explain what use case Power BI was designed to solve. That’s because it was not so much designed and as it was rapidly iterated. Power BI represents a new Microsoft, releasing changes every single month and responding directly to customer feedback. Gone are the days of releasing a new version of a product every 2 years.
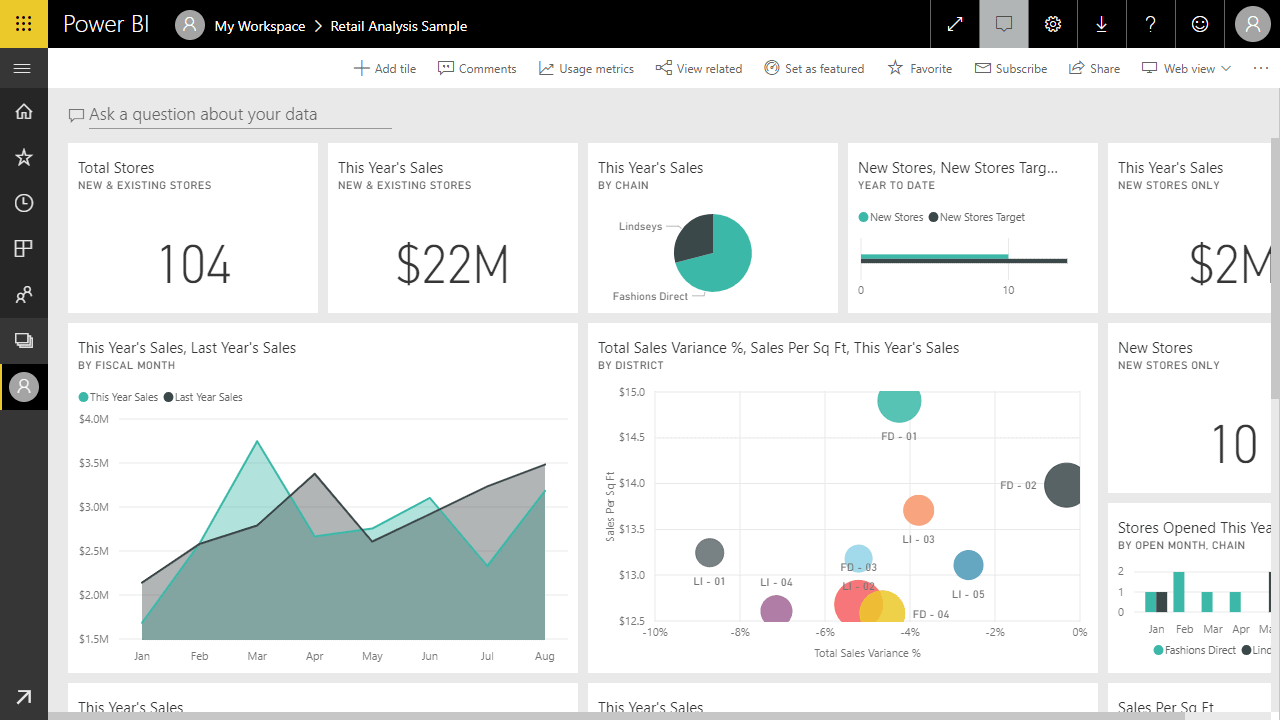
If I were forced to explain what Power BI is about, I would say this: Power BI is a full reporting pipeline, aimed at business users and BI developers alike. It is a cloud-first SaaS (software as a service) product designed to cheaply support business intelligence throughout the organization. It excels at analytic, interactive reporting.
Excel
Excel is an incredibly popular spreadsheet tool included in the Microsoft Office suite. If your business users work with data, there is a good chance that they use Excel. Excel is perfect for manipulating and organizing numbers in a spreadsheet and has a powerful formula language behind it. It also has robust charting and graphing capabilities.
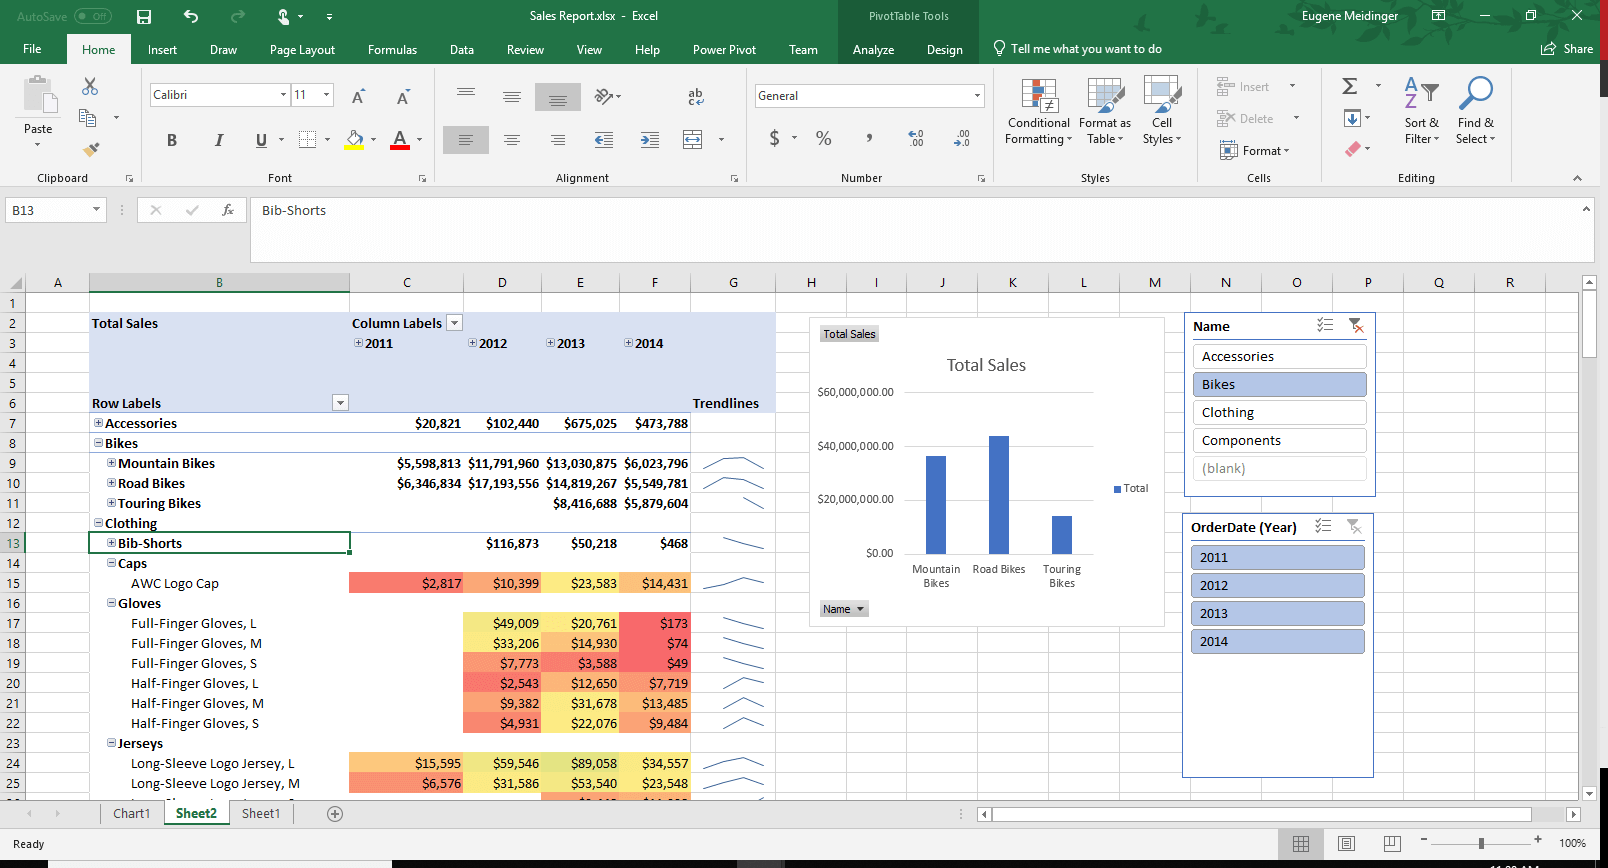
If SSRS represents a centralized approach to reporting, Excel represents the opposite. Excel is file-based, and those files have a tendency to proliferate. Sometimes, these files are pejoratively referred to as “spreadmarts,” when company data is stuck in flat files instead of a relational database. That being said, it is quite possible to centralize your Excel reports using SharePoint or OneDrive.
What are the Benefits of SSRS?
I’m going to ask you a dumb question: could you use a fork to spread butter on toast? In my mind, the answer is “Maybe? Sort of?”
It’s important to make sure that you pick the right tool for the right job. SSRS has a specific set of things it is very good at and a specific set of things it isn’t. First, take a look at the areas where SSRS shines.
Pixel Perfect Control
More than any other Microsoft reporting tool, SSRS gives you a significant amount of fine-grained control over your report outputs. You have control over exactly where each report component is located. You can also control formatting details such as font, size, color and background color.
If you need something to print just right, SSRS is an ideal solution. This lends it to
operational documents such as invoices, workorders, and anything else that might get mailed out to a customer.
Extracting Data
SSRS makes it very easy for you to get data out to your end users. If you have a line-of-business application with limited built-in reporting, you can get a report running against it in minutes. Once you’ve created the report, users can extract the data to whatever format they need (Word, Excel, PDF, etc.). I should note that in large-scale operations, running reports directly against an OLTP system is not advisable for performance reasons.
Data Governance
SSRS makes it easy to control who has access to your reports and data. It is possible to specify permissions on the whole server, specific folders of reports or on a single report. Permissions inherit down, like a regular file system, unless you explicitly break inheritance to specify custom permissions.
In addition to permissions, you have a central server to house and control your reports. This is critical when you need an authoritative source of truth for your reporting. Users can trust that they are reading the latest version of any given report.
In addition to the administrative side of things, SSRS provides a powerful development environment with SSDT. SQL Server Data Tools (SSDT) is based on Visual Studio, a very popular Integrated Developer Environment or IDE. SSDT makes it incredibly easy to store your reports in source control since your reporting artefacts are just XML files. Source control makes it possible to collaborate on a team or rollback to earlier versions of a report. This is a capability that is not available with Excel or Power BI reports.
What are the Downsides of Using SSRS?
At my prior employer, we used SSRS exclusively for a long time. It is a mature tool capable of covering a large number of needs. That being said, it’s not a one-size-fits-all tool. Now take a look at some areas where SSRS is a bit weaker.
Interactivity and Data Exploration
SSRS is much better at printing or exporting than it is at direct interactivity. There are some ways to get around this by using parameters, drill-through reports or action links; however, your options are still quite limited. Compare this to Power BI, where, by default, if you click on a visual, all of the other visuals automatically cross-highlight or cross-filter.
Because of the limited interactivity, SSRS is not ideal for data exploration. You have limited options for slicing and dicing the data. SSRS makes more sense when you know what you want the end result to look like. If you to play around with the data, you are much better off with Excel or Power BI.
Learning Curve
While SSRS isn’t difficult to learn, it can be a bit unintuitive. Getting started is very easy, with a wizard guiding you through each step. After that, it’s not difficult to drag and drop new objects and change properties to existing objects. Going beyond the basics can be a struggle, however.
What I found most challenging when learning SSRS was dealing with container objects and grouping. For example, it took me quite a while to understand how to add summary rows versus detail rows. As another example, where something is placed on the report dramatically affects which dataset it is pulling from or if you are displaying detail information or summary information.
Initial Pricing
Whether SSRS’s pricing is a strength or a weakness depends a lot on context. Compared to tools like Qlikview or Tableau, SSRS can be quite cheap. Instead of paying per user, you are paying per core just like SQL Server. SQL Server 2017 costs $1,859 per core for Standard or $7,128 per core for Enterprise edition.
If you have a lot of low-frequency users or can reuse an existing SQL Server, then this can be the way to go. That being said, most organizations will host SSRS on its own server for performance reasons. This means you can easily be paying $7,500 just for SSRS licensing.
If you are looking to start small and grow out organically, Power BI might be a better fit. Power BI is licensed by user at $10 per user, per month. Even Excel is pretty affordable with an Office 365 E3 license costing $25 per user per month, which is often already paid for by organizations.
When Should You Use SSRS?
Given these pros and cons, when does it make sense to use SSRS? As I said before, you can’t just look at what the tool can do. You also must consider if it is a good fit for your organization.
Printed Documents
If you need to print something out, SSRS is a no-brainer. While I’ve seen people use Excel for creating invoices, I wouldn’t advise it. For anything that requires branding, strong formatting control, or printing control, SSRS comes out on top.
SSRS has support for more advanced printing features as well, such as footers, headers, watermarks, and page numbers. You can easily configure the margins and layout of your report to get it exactly the way you want.
Detail Heavy Reporting
SSRS is excellent for displaying lots of textual and numerical data. You can format information to be quite readable. SSRS is an ideal fit for any operational reporting. Think anything that needs printed on a daily basis: workorders, invoices, purchase orders, etc.
Excel, by contrast, is great for displaying lots of numbers but the formatting and layout piece can get messy quickly. Finally, Power BI just wasn’t designed for this kind of work. While it does have table and matrix controls, it is optimized for displaying charts and for interactive reporting.
Strong SQL Skills
If your organization has strong T-SQL and SQL Server skills, SSRS is a good fit. This is because SSRS is licensed the same as SQL Server and is administered as a SQL Server component. Additionally, there is an active SQL community and plenty of resources to learn more about it.
Simple Mobile Reports
Up until 2016, SSRS was a poor choice for mobile reports. While it was always possible to expose the web portal to the outside internet, trying to read SSRS reports on a small mobile browser was a pain.
With the acquisition of Datazen, that changed. Now it is easy to quickly take a shared dataset and create something that looks good on a phone or tablet. Additionally, the SSRS Mobile tooling provides dummy data so you can start with your report design and work your way backwards.
Summary
This article briefly reviewed the reporting tools available in the Microsoft space. It covered the strengths and weaknesses of SSRS and wrapped up with ideal use cases for it.
Ultimately, SSRS is great if you need to get data out of your system or need to have fine-grained control over your reporting documents. If you are looking to create interactive reporting, or to start cheap, Excel or Power BI are a better fit.
In the next article, I will show you how to get up and running with SSRS as quickly as possible.
Load comments