
Memory leaks are relatively easy to introduce into your programs when coding in C or C++ (no-one could have enjoyed having to write destructors for every single one of their C++ classes). However, when you code in a .NET language, such as C#, you are working in managed code, with automatic garbage collection, so memory management becomes a bit of a non-issue, right?
That certainly pretty much describes my mindset when I developed the brand new C# 2005 desktop version of my company’s sales and CRM application. I was new to C#, and while I was aware that there could still be problems if references weren’t cleaned up properly, I hadn’t given memory management much thought during development. I certainly wasn’t expecting it to be a major issue. As it turns out, I was wrong.
The problems begin…
I knew I was in trouble the first time my customer called with specific memory use numbers from the Windows Task Manager. Jack is a salesperson by trade, but by volunteering to beta-test my new desktop application, he had unknowingly put himself in line for a crash course in memory leak awareness. “The memory is up to five hundred thousand K since restarting this morning”, he said, “What should I do?”
It was a Friday afternoon and I was at an out of town wedding for the weekend. Jack had noticed this issue the day before and I had advised the temporary fix of close-out-and-come-back-in. Like all good beta testers he was happy to accept the temporary solution, but like all excellent beta testers he wasn’t going to accept having to do a temporary fix over and over.
Jack wasn’t even the heaviest user of the application and I knew that the installed memory of his machine was above average, so going live wouldn’t be possible until I could trace and fix this leak. The problem was growing by the minute: the scheduled go-live date was Monday and I’d been on the road, so I hadn’t been able to look through the code since the memory issue had arisen.
Fighting memory leaks armed only with Task Manager and Google
I got back home on Sunday evening and scoured the search engines, trying to learn the basics of C# memory management. My company’s application was massive, though, and all I had was the Task Manager to tell me how much memory it was using at any given time.
Displaying an invoice seemed to be part of the problem; this was a process that involved a large number of different elements: one tab page, a usercontrol on the page, and about one hundred other controls within that usercontrol, including a complicated grid control derived from the .Net ListView that appeared on just about every screen in the application. Every time an invoice was displayed, the memory use would jump, but closing the tab wouldn’t release the memory. I set up a test process to show and close 100 invoices in series and measure the average memory change. Oh no. It was losing at least 300k on each one.
By this point it was about 8pm on Sunday evening and needless to say, I was beginning to sweat. We HAD to go live the next day. We were already at the tail end of our original time estimate, other projects were building up, and the customer was already starting to question the wisdom of the entire re-design process. I was learning a lot about C#’s memory management, but nothing I did seemed to keep my application from continuing to balloon out of control.
Enter ANTS
At this point, I noticed a banner ad for ANTS Profiler, a memory profiler for .NET. I downloaded and installed the free trial, mentally composing the apologetic ‘please give me a few more days’ email I would need to write the next morning if I didn’t find a resolution.
How ANTS worked was pretty clear as soon as I opened it. All it needed was the path to the . exe, after which it launched the system with memory monitoring turned on. I ran through the login process in my application, and then used the main feature in ANTS to take a ‘snapshot’ of the application’s memory profile before any invoices or other screens had been shown.
Browsing that first profile snapshot, I was stunned at the amount of information available. I had been trying to pinpoint the problem using a single memory use number from the Task Manager, whereas now I had an instance-by-instance list of every live object my program was using. ANTS allowed me to sort the items by namespace (the .NET ones as well as my own), by class, by total memory use, by instance count, and anything else I could possibly want to know.
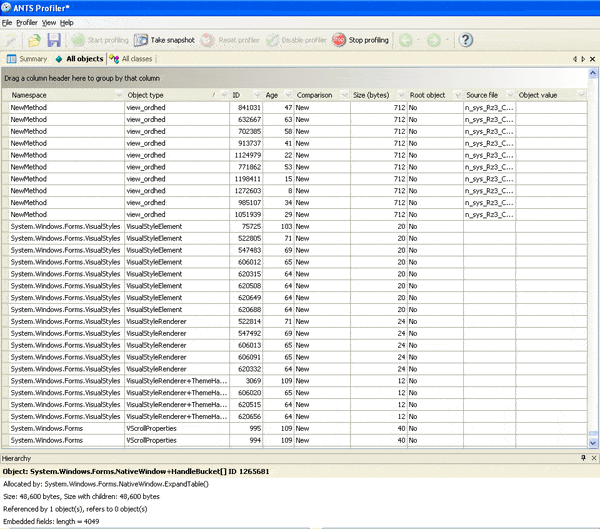
Armed with this information, I mentally put my apology email on hold, brought up my application, ran the process that displayed 100 invoices, and then took another snapshot. Back in ANTS, I checked the list for instances of the main invoice display usercontrol. There they were; 100 instances of the control along with 100 instances of the tab and 100 instances of everything else, even though the tabs themselves had all been closed on the screen.
The obvious problem: objects not being removed from an array
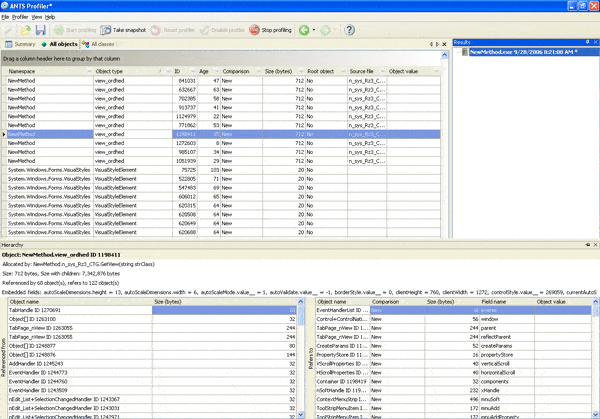
In my research I had learned that the .NET memory management model uses an instance’s reference tree to determine whether or not to remove it. With a bit more clicking in ANTS, I found that it could show me all of the references both to and from every instance in my program.
Using ANTS to navigate forward and backward through the maze of linked references, I was quickly able to find a static ArrayList to which all displayed tabs were added, but from which they were never removed.
After adding a few lines of code to remove each tab from this collection as it was closed, I re-ran the profiler and the 100 invoice process and voilà; the tabs, the main usercontrol, and nearly all of the sub-controls were gone. It got even better too: the memory increase after each invoice was down to a fifth of what it had been, which changed the memory leak from a major concern down to a minor annoyance. The next day we went live, and although issues of all sizes arose, none of them was caused by the leak.
The subtler problem: events listeners and the ListView object
Later that week, however, Jack’s calls resumed: “The memory is still slowly creeping up; what’s going on?” I didn’t know, but at least I knew where to look now. I used ANTS to see if I could locate the remaining leak. What I found was that one of the sub-controls of the main invoice usercontrol, the ListView-based one that formed a primary part of the interface, was being held in the reference tree by what appeared to be standard event handlers like OnClick and MouseMove, hooks that had been added using the Visual Studio IDE and that would have been, I thought, cleared automatically.
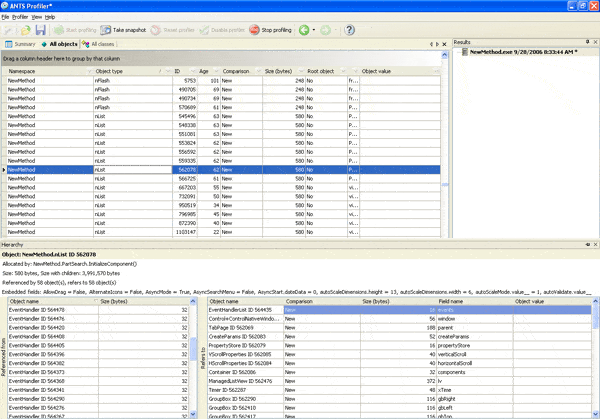
This was really puzzling to me, and I wrote to Red Gate Software, the developers of the ANTS system, asking for some additional help. Their support staff promptly responded and explained that in situations with lots of complex references and event handlers, the .NET runtime can leave event handlers in place when they should be disposed. They suggested manually removing each handler in the Dispose method of the usercontrol that was causing the problem.
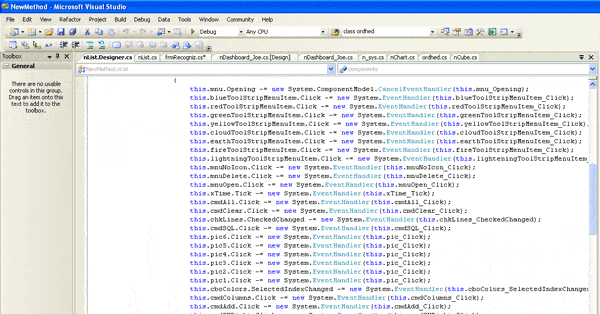
I added the 20 or so minus-equals statements to remove each handler, and for good measure, I added a System.GC.Collect()statement after the tab closing process.
Re-running the ANTS profiler and the 100 invoice process, I found that the memory use remained rock solid. Then, when re-checking the ANTS snapshot, I could see that all of the invoice-related controls had been released, and the memory use numbers in the task manager never moved.
I re-compiled and uploaded the new version. Now it was my turn to call Jack.
Summary
What did I learn from all this? Firstly, that the “it’s managed code so we don’t have to worry about memory leaks” assumption falls short of the mark.
Although automatic memory management in .NET makes our lives as .NET developers a whole lot easier, it is still easy to introduce memory leaks into your application. Even in managed memory, there can be issues. The memory manager cannot free memory that is still ‘live’ – and it will still be considered live if it is referenced directly or indirectly through the “spider’s web” of references that link the various objects. Also, when complex reference trees and event handlers are involved, the memory manager doesn’t always deregister these event handlers, and so the memory will never be released unless you forcibly release it.
Secondly, I learned that tracking down these sorts of issues equipped only with Task Manager was simply not possible – certainly not in the timeframe I had. Tools such as Task Manager (and Performance Monitor) were able to tell me that my application was using up a lot of memory, but I needed a dedicated memory profiler like ANTS Profiler to really show me what objects made up that memory and why they were still there.
To try out the latest version of ANTS Memory Profiler, visit the Red Gate website.
Load comments