
A couple of weeks ago I upgraded my ANTS Profiler license to a so called bundled license. In addition to my beloved profiling tools, this also gave me a licensed copy of Reflector Pro.
Aside from Visual Studio, I think that the classic .NET Reflector, is the most widely used tool for .NET developers, architects and perhaps even the IT-guys. To be able to gain insight in dependencies and the possibility to disassemble most assemblies on a method-level, is a valuable asset. As I’ve been using Reflector long before Red Gate branded it, I wondered how I could have missed the Pro advert and was curious as to what extras this version brought to the table.
The monolith
Recently I was working at one of my client’s offices on a piece of internally developed software. To be more specific, this was a web-based application which had been progressively developed over a period of about 4 years. The application was, at first, developed with exclusive internal usage in mind but, because of its success, it was patched up so that licenses could be sold to external customers. To make things worse, the application contained code developed by several unrelated developers and there was no documentation other than a user manual.
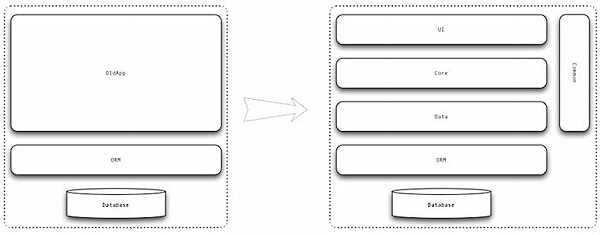
I first got involved with the application, about 10 months ago, when I was asked to assess the state and architecture of the ‘beast’ and to write a report with recommendations on how the application could be made more scalable, (unit) testable, easier to maintain and above all, more stable. Architecturally, the main issue with the web application, was that it wasn’t designed with any layering in mind resulting in a horrible monolith. Our mission was – actually still is – to introduce an architecture that clearly separates presentation from business logic and business logic from persistence related operations; your basic 3-tier architecture.
Our mission
Recently a small team was assembled, including me, in order to restructure and refactor the application. Our first task was to identify where the presentation layer made direct use of generated ORM (Object Relational Mapper) classes, LLBLGen Pro in this case. The next step was to define suitable repository classes, their interfaces and POCO business objects, to substitute the original objects. We then re-factored the UI to use these intermediate classes, located in the new business layer, which in turn pulled data from and pushed data to our new data layer. In other words, we moved the ORM into the data layer where it belongs.
Obviously, this process was done in small steps, in order to reduce the risk of introducing new bugs. As we progressed, we realized that it was essential to do frequent functional testing, because there were no automated tests in place before we started work. Where possible, we added unit tests were as we progressed. What complicated our work, was that none of the team members had a lot (if any) experience with LLBLGen Pro as an ORM. This was further complicated by the sometimes over-enthusiastic way that the original developers chose to do their data-binding in the past.
During some of the refactoring steps we realized that we needed to rewrite the existing data access code, in an attempt to make data retrieval logic more transparent, more efficient, and reusable. It was then that we started to get unexpected and extremely generic exceptions out of the ORM, namely NullReferenceExceptions and IndexOutOfRangeExceptions.
Debugging into external assemblies with Reflector Pro
Generally, when such exceptions occur, their causes are easily pin-pointed and often just as easily resolved. This however, requires that you know the code you’re debugging and that you can debug the code. Even though we had access to the generated ORM code, the exceptions stemmed from inside the core assemblies provided by LLBLGen Pro. I started investigating the origin of the errors by using the original Reflector tool, but this resulted in trial and error bug-fixing, which wasn’t all that fruitful and to be honest pretty frustrating. I needed a new plan.
After doing some research I stumbled upon .NET Reflector Pro and learned about how it can let me debug into external assemblies. If any occasion called for that functionality, this was it. I started by specifying what referenced assemblies I wanted to debug through, using the smooth Visual Studio add-in. Right away, it disassembled the specified assembly and generated a new, temporary version which also contained debug information. After confirming the question to substitute my existing reference with the new temporary assembly, my project was updated and I could simply start debugging by pressing F5. Now, when the exceptions occurred, I could immediately see and step through actual disassembled C# code. I could even place breakpoints in it!
Once I figured out which passed-in parameter values caused the painfully generic exceptions, I was able to fix the issues in a matter of minutes. About an hour after upgrading to Reflector Pro all bugs were fixed and I was ready to move on! I simply switched my project back to reference the original assemblies, cleared the temporary assembly cache, and continued my refactoring as normal.
My conclusion
In retrospect, perhaps we should have taken the time to better study the documentation provided for LLBLGen Pro, but in the heat of the moment tunnel vision strikes you and progress is all that seems to count. On the other hand, investing time to learn more about a tool that will probably be phased out before long and replaced with Microsoft’s own Entity Framework or NHibernate, would also be a pity, not to say demotivating.
Reflector Pro quickly gave me all the information I needed to resolve my bugs in a matter of minutes. Due to its transparency and simplistic interface, it even feels a bit magical. If you know how to debug your own code, there’s nothing new to learn. I feel that that is quite an accomplishment.
Along with my beloved ANTS Profiler, Reflector Pro is now part of my .NET tool-belt and I’m glad to have such a powerful tool at hand when needed in the future. I guess most experienced developers and architects have been caught in situations where clients have lost source code of critical applications and services. Think about how easily you could have resolved these issues if you had the appropriate tooling. Perhaps Reflector Pro is not the kind of tool you would use on a daily basis, but it is definitely a life saver when the need arises… and we all know that this happens when you don’t have the time, possibility or patience to really delve into the inner workings of that legacy code.
Load comments