
In today’s world of high processor speeds, and vast amounts of available memory, many programmers seem to ignore the limitations on these resources in applications.
This can often lead to scalability and performance problems that can often be solved with very little difficulty. This article discusses common pitfalls and problems when creating applications in .NET. It will cover some nomenclature first and then present several common issues that I have come across in a wide variety of applications. It also describes some common ways of solving these problems.
Future articles will delve deeper into some of the specific techniques or problems covered here
Beware of optimising needlessly
You are better off writing readable code, and then focussing your efforts on optimising just those parts that need it. This is just as true on Just In Time (JIT) compiled platforms, such as .NET, as with native code.
If you over optimize your code, you risk limiting the ability of the compiler to perform compiler optimizations, such as loop interchange thereby leading to a decrease in performance as the compiler may select different optimizations depending on Platform.
NOTE: See http://en.wikipedia.org/wiki/Compiler_optimization for information about the wonderful things your compiler can do for you
In my experience, it is best to ensure you have a scalable architecture, and leave optimisation for a subsequent stage in which you can identify, measure, and fix those performance hotspots. For a great overview of different architectures and their different behaviours, get a copy of Computer Architecture, a Quantitative Approach by John L. Hennessy and David Patterson
A big Oh
It took me a long while to fully grasp the big-O notation (also known as Big-Oh, Landau notation or asymptotic notation), and how it could be used to understand the scalability of your code. It’s well worth your time in investigating it.
Basically the big-O notation is used to describe how an algorithm uses resources (time and memory) depending on the size of its input. So, what do I mean if I say that a function has a time complexity of O(n2)? I mean that the amount of time spent in the function grows roughly in proportion to the square of the size of the input. When n is small, this is not necessarily significant, but this changes as n grows.
Consider the following function:
1: static void SomeFunction(int[] array)
2: {
3: Thread.Sleep(100000);
4:
5: for (int i = 0; i < array.Length; i++)
6: {
7: for (int j = 0; j < array.Length; j++)
8: {
9: Thread.Sleep(10);
10: }
11: }
12: }
This function has a time complexity of O(n2). If we pass in an array of 1 element, then the function will spend longest in the sleep on line 3 of our function. The same is true if we pass a 100 element array. However, if we pass in a 1000 element array, the same amount of time is spent in line 9 as line 3.
As the number of elements in the array grows beyond 1000, the sleep on line 9 becomes more and more dominant and the sleep on line 3 loses its influence on the run time of the function.
Below is a table outlining several common function complexities, illustrating how they grow with the size of the input:
| >O(1) | O(lg N) | >O(n) | O(n lg n) | O(n2) | O(n3) | |
|---|---|---|---|---|---|---|
|
1 |
1 |
1 |
1 |
1 |
1 |
1 |
|
10 |
1 |
3 |
10 |
33 |
100 |
1000 |
|
50 |
1 |
6 |
50 |
282 |
2500 |
125000 |
|
100 |
1 |
7 |
100 |
664 |
10000 |
1000000 |
|
1000 |
1 |
10 |
1000 |
9966 |
1000000 |
1000000000 |
|
10000 |
1 |
13 |
10000 |
132877 |
100000000 |
1012 |
|
1000000 |
1 |
20 |
1000000 |
19931569 |
1012 |
1018 |
We have been talking about time complexities so far but it is also important to remember the same can be true of memory usage as well.
You will often find that to decrease a function’s time-complexity, you need to increase its memory complexity. Can you come up with a function that has an O(1) time complexity (i.e. the function’s execution time does not vary however large the number given) and a different function with an O(1) memory complexity, to tell if a number under 10000 is prime or not? What are the respective memory and time complexities of both of these functions?
Get real
The problem is, back in the real world, that my function is 5000 lines of code, calls other functions and has 20 parameters; there is no way I can figure out the time/memory complexity of my function!
Fortunately, you don’t need to figure it out by hand. The way that I do it is to use a profiler and run the application with one set of inputs, and rank the functions in order of their execution times. ANTS Profiler is my personal favourite as it supports line level timings. I then repeat the process, varying the size of the inputs.
Next, I compare the two lists and look at the differences in function rank. Functions that have moved up relative to the others are the ones that are likely to have scalability problems, and can be investigated further. A note of caution about this: although you do not need to go to the extremes of input size differences you do need to make sure they are large enough.
Think about the function introduced above; if I started with a 10 element array input and only tested up to a 100 element array, then I would conclude that the sleep on line 3 is dominant. However, if I pass in a 10 element array and a 10,000 element array then I will see the function’s rank change.
What to look for
In addition to the quick test outlined above, I have, over the years, learned the hard way about what to avoid and what to look out for when solving performance problems.
Loops
The most obvious source of poor performance is loops, whereby the number of iterations around the loop cannot be determined at compile time. These loops generally scale as a function of some piece of input.
Watch out for places where you call a function in a loop, and where that function also has a complexity of O(n) or above, as you can then end up with a function with a complexity of O(n2) without realising it. This is probably the main cause of poor scalability in .NET applications.
How you fix the problem really depends on your application, but I always find that it’s useful to think about the following “rules” when trying to solve performance issues related to loops.
Do less work
This seems fairly obvious, but I always ask myself if there is a way to move some of the processing out of the function, and pre-compute or cache some of the information I am computing. This often comes at the expense of using some extra memory, so be careful!
Divide and conquer
Is there some way I can split the input into parts, do the heavy lifting on the relevant part, and then merge the results back together again? A prime example of this sort of algorithm is merge sort. If you can rewrite your algorithm so that the “heavy lifting” is O(n), then your algorithm should end up with a complexity of O(n lg n).
Modelling
Can you model your problem in a similar way to another problem? Does your problem resemble a sort or is it more like a flow optimization? If so, then find an algorithm which performs well and adapt it to solve your problem. If you have never looked at it then I would suggest getting a copy of “Introduction to Algorithms” by Cormen, Leiserson, Rivest and Stein. It sits on my desk and is well thumbed. I find it much easier to follow than Knuth.
Dynamic programming
You should consider using dynamic programming when your problem can be split into multiple sub-problems; however, these sub-problems are not independent. In other words, each sub- problem shares a sub-sub-problem with other sub problems, as illustrated below:
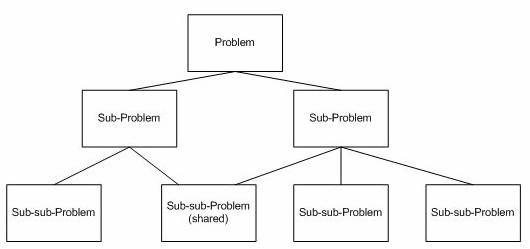
A divide and conquer approach will do more work than is necessary in these cases and can be optimised by storing the solutions to these sub-sub problems in a lookup table, computing them the first time they are used, and then reusing the result next time rather than computing it again.
Translate the problem
The implementation of a solution to a problem is often dictated by the way the data is presented and stored – can you change the way that the data is stored? Does this make solving your problem any easier?
If all else fails, fake it
Sometimes there is nothing you can do about performance. After all, you can only factor a prime number so quickly! In these cases you need to make sure that you tell your user that you are making progress and allow them to cancel the operation. Users are willing to wait for a while for results as long as you let them know!
Usability is hugely important. When you cannot do anything about performance, have a look at Jacob Nielsen’s website http://www.useit.com/ for lots of information about usability
Blocking functions
If your application is interactive, as is the case with a website or windows forms application, then be very careful when calling blocking functions, for example when making a web service request, or executing a query. If the web service runs on a remote machine, or the query has not been properly tuned, then never run these on your main thread. Use the ThreadPool class or BackgroundWorker class and show a progress indicator using the main thread.
Database queries are one of the most common causes of poor performance. They behave in a similar way to function calls and their performance often depends on the number of records in the tables accessed. Check that your queries scale properly by using a SQL Profiler and varying the number of records in the tables. Also, examine your query execution plans and make sure that the indexes you have on your tables are relevant and that your database’s statistics are up to date, so that the correct indexes are used. Optimizing queries can be tricky and the exact optimisations to use differ from query to query. You are generally best-advised of to talk to an expert. Luckily there are plenty willing to give their advice for free at sites such as SQLServerCentral.com.
In the past, rewriting a query and ensuring that the correct indexes are available has allowed me to decrease a query’s execution time form over 30 minutes to two or three seconds. It’s well worth spending a few hours testing the scalability of your queries.
Threads can end up in knots
Another common problem that I have encountered involves optimisations that use multiple threads to perform some processing. This can work really well, but if your threads access the same data structures a lot then you need to be careful.
Each access should be mutually exclusive, enforced by mutexs. Otherwise, you may encounter race conditions. However, the acquisition of these mutexs can, itself, be the cause of performance problems. If a thread holds on to a mutex for too long then it will stop other threads accessing the shared resource and cause them to block, possibly leading to performance issues.
Conversely, acquiring and releasing a mutex constantly has its own overhead and can slow program performance down.
There are several solutions to this sort of problem (normally called a contention problem).
Batch it up
The first solution is to look at how your program accesses the data structure in question. Can you batch up several accesses to the structure and only acquire the lock once? If your process is:
- Acquire the lock
- Do something
- Release the lock,
- Repeat as necessary
You should investigate whether you can change it to
- Acquire the lock
- Do something 10 times
- Release the lock
When taking this approach, just be careful not to do too much at once, as this can block other threads.
It’s good to share
If two or more threads are trying to read from the same data structure at the same time then you might want to look at using a ReaderWriterLock class rather than C#’s native lock keyword.
Lock free
If your levels of lock contention are high, but you very rarely get update clashes, then you might want to look into using a lock-free data structure. These are great in some situations, but if you get a large number of update conflicts you will see a large drop in performance while using these.
NOTE: A lock-free data structure is one that is built to support concurrent access and writing to data without a lock being acquired. This can be achieved through transactional memory or through atomic actions such as Compare and Swap.
Conclusion
Improving the performance of your application often boils down to rephrasing the problem you are trying to solve. There are two approaches to this – do less, or do it differently. Doing less generally involves storing and caching information, and doing something differently involves rephrasing the computation in terms of some other problem. Take for example the Radix sort whereby, given a list of numbers, say 12, 15, 24, 2, 108, 1067, we sort by the least significant digit first, resulting in: 12, 2, 24, 15, 1067, 108, we then sort by the tens column: 2, 108, 12, 15, 24, 1067, the hundreds column: 2, 12, 15, 24, 1067, 108 and finally the thousands column: 2, 12, 15, 24, 108, 1067. This odd sorting algorithm seems fairly counter intuitive but, when sorting using a most-significant-digit-based radix sort, each sub-problem is independent from other sub-problems, allowing for effective use in highly parallel systems.
This article is admittedly lacking in the hard and fast rules you can apply to your code – unfortunately, performance improvements are often trade offs. There is the old saying that you don’t get something for nothing and this is equally true for computer science as for any other area of life. The choices you make when developing you applications will affect your user’s perception of the application’s quality so it is definitely worth spending a little time ensuring you get the quick performance and scalability wins – of which there are often many.
Load comments