
Introduction
Automatic memory management in .NET makes development a lot easier; however, it’s still easy to introduce memory leaks into your application. For example, in a complex application, it’s easy to forget to unregister event handlers, and these are notorious for holding on to objects which you don’t need to keep in memory any more. This typically leads to an increase in memory usage which, if it remains unchecked and unresolved, can lead to your application exhibiting poor performance, or even running out of memory and crashing. This is where a memory profiler becomes necessary.
The basics
ANTS Memory Profiler is a memory profiler for .NET applications – including ASP.NET web applications – that will help you locate memory leaks, investigate your application’s memory usage and perform health checks on your code. In essence, ANTS Memory Profiler will help you identify how to reduce your application’s memory footprint.
Let’s illustrate this point by using ANTS Memory Profiler 5 to locate a memory leak in a desktop application called QueryBee. It is a simple WinForms application for running queries against SQL Server databases. It is made up of a database connection dialog…
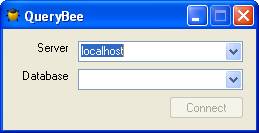
Fig. 1: QueryBee – database connection dialog.
…and a query window to query the database.
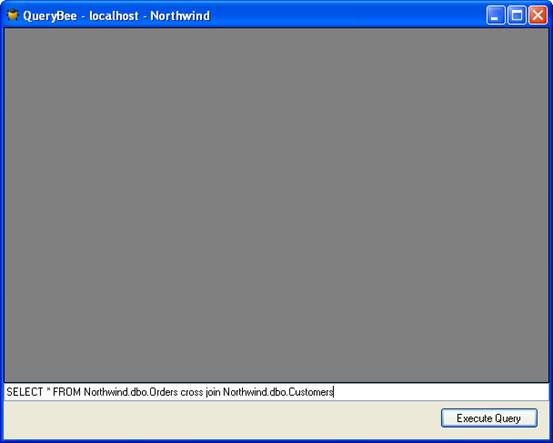
Fig. 2: QueryBee – the query window.
We know our QueryBee application is leaking memory because, every time we open a query window and close it again, our memory usage keeps on increasing.
This is the profiling strategy we’re going to use:
- Wait for QueryBee to open.
- Take a first snapshot without using the application – this first snapshot will be used as a baseline.
- Interact with QueryBee – connect to database, enter a SQL query in the query form, and execute the query and close the form.
- Take a second snapshot.
- Examine the comparison the profiler shows us after it has finished taking and analyzing the second snapshot.
Let’s get started.
On opening up ANTS Memory Profiler, we are presented with a setup dialog (Fig. 3).
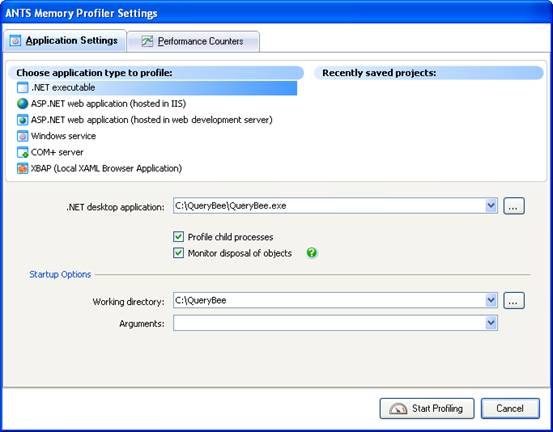
Fig. 3: The ANTS Memory Profiler 5 setup dialog.
All we need to do is point it at QueryBee and click Start Profiling. The profiler starts up QueryBee and begins collecting performance counter data (Fig. 4).
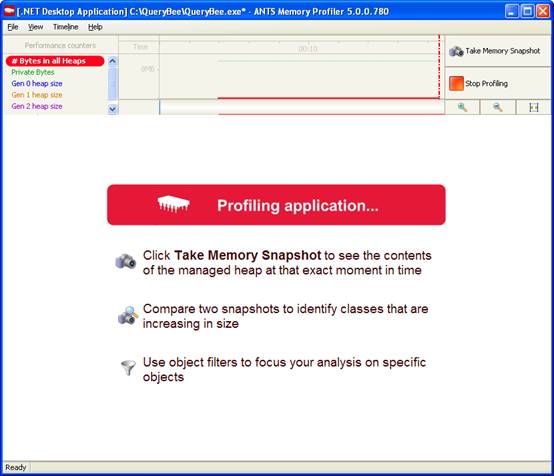
Fig. 4: Whilst profiling, ANTS Memory Profiler collects performance counter data. The profiler is now profiling our application.
At this point, we take a baseline snapshot by clicking on the Take Memory Snapshot button in the top-right corner. The profiler forces a full garbage collection and takes a snapshot of the heap memory it is using, and we get a first set of results (Fig. 5)
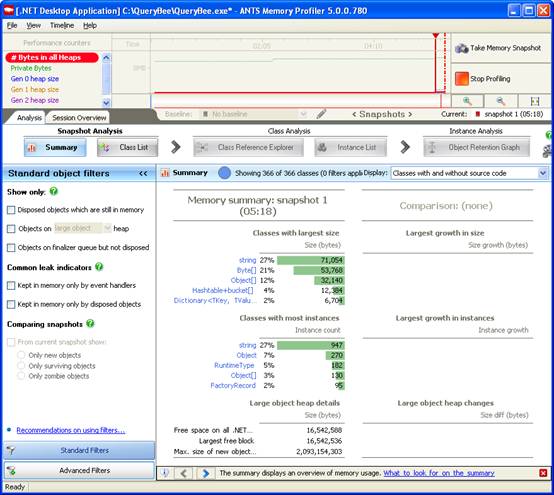
Fig. 5: Results from our first snapshot – summary screen.
Now, we go back to QueryBee and perform the tasks which we think cause the memory leak: we get QueryBee from the system tray, we select a database, enter a SQL query in the query window, execute the query, and obtain some results.
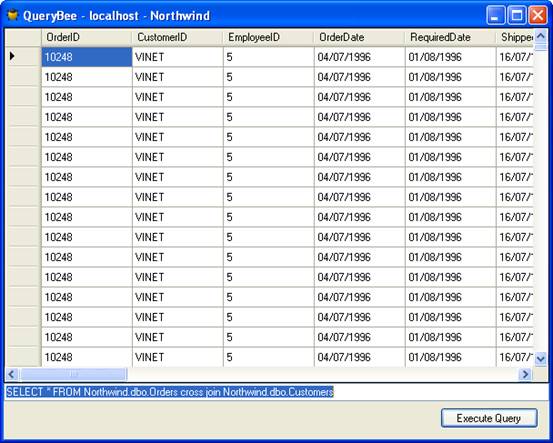
Fig. 6: QueryBee – the results are displayed in a grid.
Now that we’ve got the results, we close the form.
At this point, the window is gone, so we expect the memory usage to fall back to where it was around the first snapshot, but that is not the case.
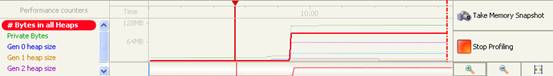
Fig. 7: Despite closing our query window, the memory usage is still rising.
So What’s Happening Here?
So what’s happening here? We take a second snapshot and get the results (see Fig. 8).
(We’re not planning on taking any further snapshots, so we click on the Stop Profiling button.)
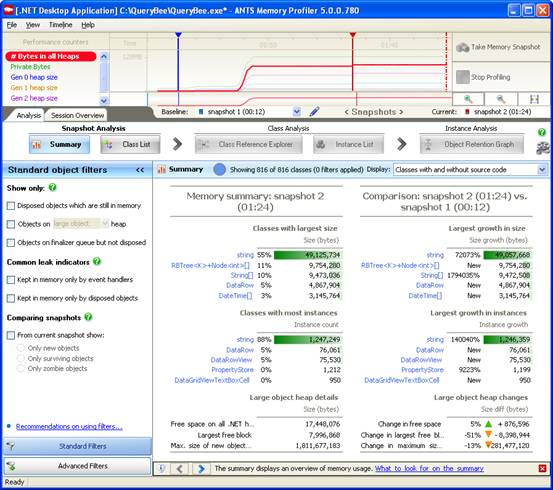
Fig. 8: The summary pane compares the results of the two snapshots.
We switch to the Class List to find out more. The Class List gives us a fuller picture of what’s in the snapshot.
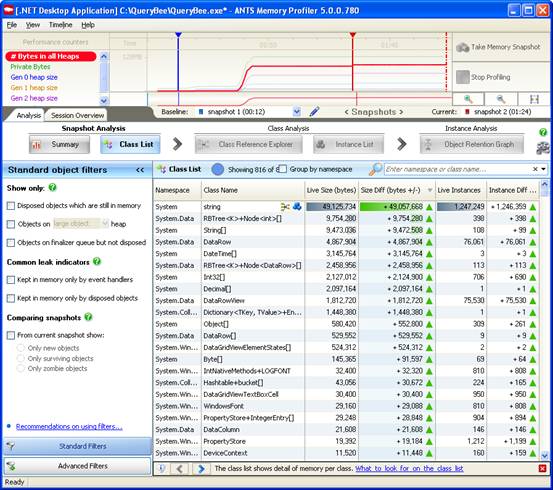
Fig. 9: The Class List allows you to compare memory usage in both snapshots in more detail.
We sort by Size Diff to see what has increased the most in size since our baseline.
We have 816 classes in our class list, so let’s use the Filter panel on our left to reduce the number of classes in the list. Because we have taken two snapshots, one very useful filter is the Comparing Snapshot filter. We only want to see new objects that have been created since the baseline, so we select the Only new objects filter.
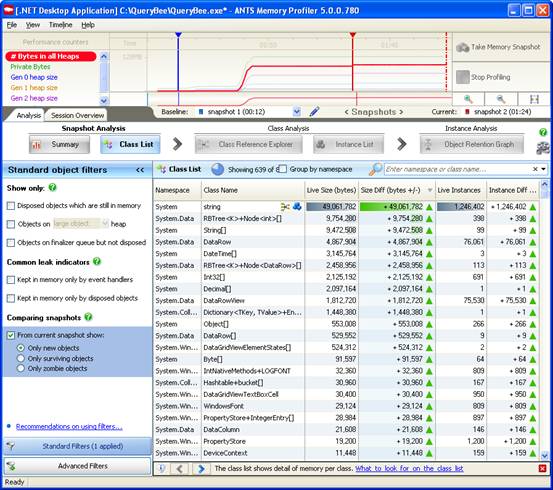
Fig. 10: We’ve now applied one filter to see only new objects that have been created since our baseline snapshot.
We can see the impact of this filter on the bar above the class list – we’re left with 639 classes. We have already removed about a quarter of the classes. That’s a pretty good start.
Let’s reduce this further by applying another filter.
We know that we call Dispose() a number of times in our application. Memory leaks often occur when an object cannot be garbage collected, even if Dispose() has been called, because it is still being referenced by another object. So, let’s apply the filter Disposed objects which are still in memory.
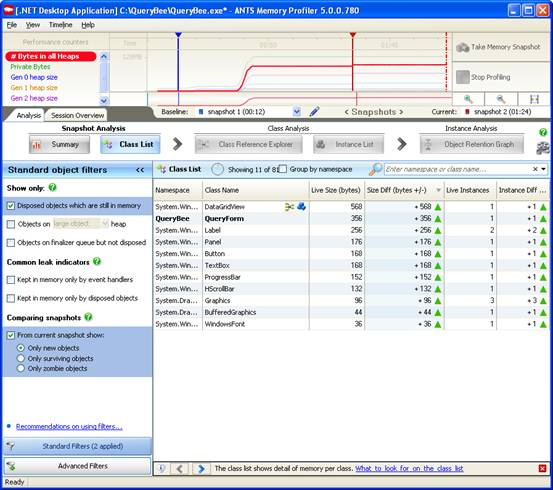
Fig. 11: We now apply a second filter, and that has dramatically reduced our number of classes.
That’s had a huge impact on the number of classes left. Scanning down the list, we can also see that there is an instance of our QueryForm class in the list.
That’s not right. We closed that form after the query had completed. To find out why it is still being held in memory, we’ll look at this instance of QueryForm, by clicking on the blue icon next to it.
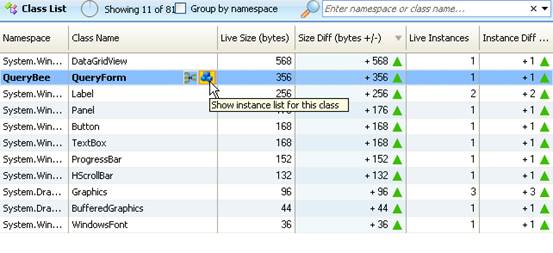
Fig. 12: We access the Instance list by clicking on the blue icon next to QueryForm.
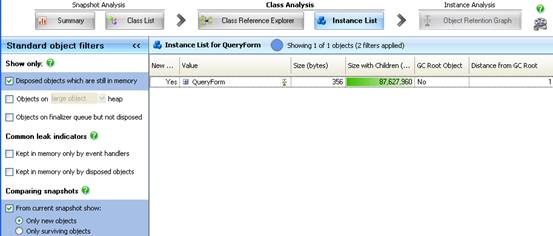
Fig. 13: On its own, QueryForm is not that big, but the Size with Children column is showing that the one instance of QueryForm is holding on to over 80 MB.
We find that QueryForm is not that big, but the Size with Children column is showing that the one instance of QueryForm is holding on to a reasonable chunk of memory.
So, we know we’re leaking QueryForms, but we need to find out why. Let’s create an Object Retention Graph by clicking on the icon.
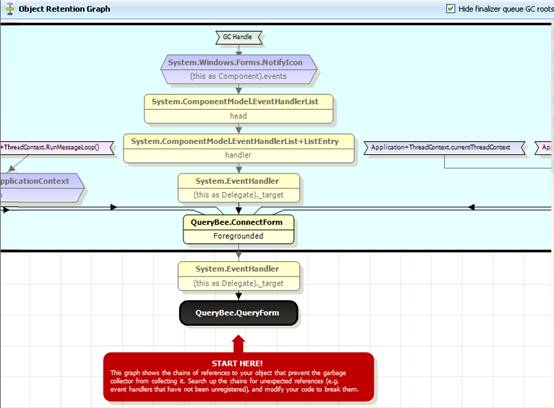
Fig. 14: This Object Retention Graph shows us what is still referencing our QueryForm.
This Object Retention Graph shows what is still referencing our QueryForm. Once we figure this out, we’ll be able to go back into our code to break the chain of references that is keeping the QueryForm in memory.
There’s a handy hint in red telling us to start at the bottom and work our way up the graph until we find a reference that needs to be broken. We’ll just need to break the chain at one point to allow the garbage collector to clean up everything below that.
First, the graph is telling us that this System.EventHandler is referencing QueryForm and, if we step up one more level, it’s telling us that the event handler is referenced by our ConnectForm instance – this is the form that asked us for the database connection details. In other words, the ConnectForm is holding on to the QueryForm via an Event Handler.
If we look at this node more closely, we see that it’s actually being referenced by the ConnectForm‘s Foregrounded field.
Let’s find this Foregrounded event in our code. We right-click on the QueryBee.ConnectForm node and open the ConnectForm source code in Visual Studioâ¢.
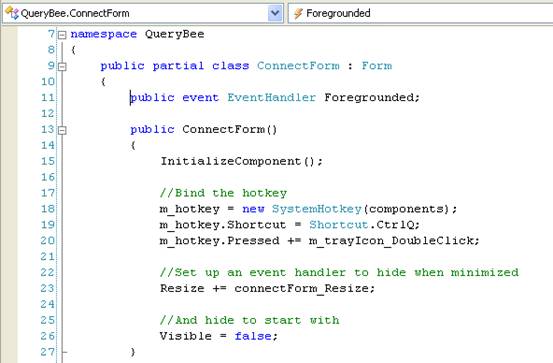
Fig. 15: Foregrounded event in the ConnectForm source code.
The profiler automatically jumps to the Foregrounded event. We check where it is being used, by right-clicking on Find All References.
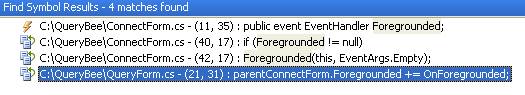
Fig. 16: The Foregrounded event is used in three places.
We’ve got three usages and we find that the last usage is where QueryForm registers for the Foregrounded event, but it doesn’t look like it unregisters. If we fix that, then the memory leak should go away.
The place to unregister that event is in the QueryForm‘s Dispose() method.
![]()
Fig. 17: QueryForm.cs file.
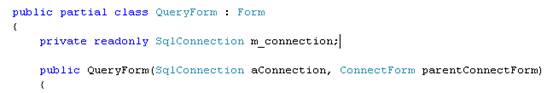
But since QueryForm doesn’t have a reference to the ConnectForm, we are going to have to store that in a member field.
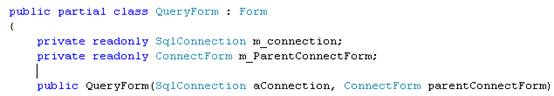
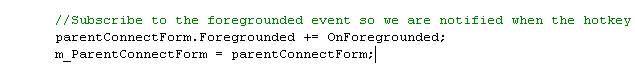
Fig. 18: QueryForm.cs file.
Now we can modify Dispose() in the QueryForm.Designer.cs file.
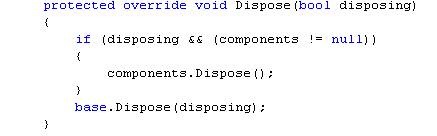
Fig. 19: QueryForm.Designer.cs file: Dispose() before modification.
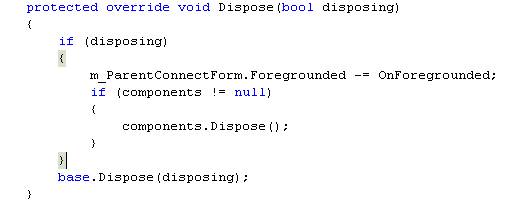
Fig. 20: QueryForm.Designer.cs file: Dispose() after modification.
We’re done, so we rebuild our application in Visual Studio.
So. Have we Really Fixed it?
Back in ANTS Memory Profiler, we start up a new profiling session. We want to find out that the reference to the QueryForm has disappeared.
Notice that it remembered our settings from last time, so all we need to do is click Start Profiling.
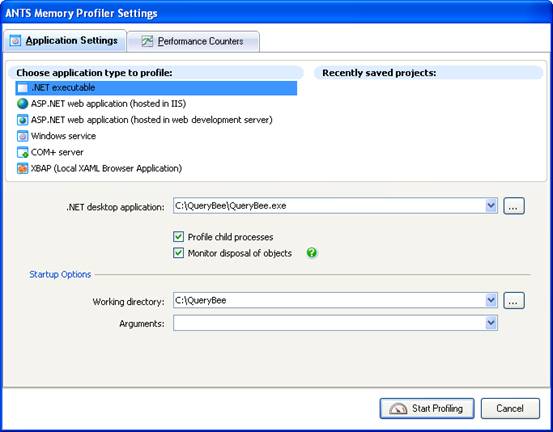
Fig. 21: The settings dialog remembers settings from last time.
QueryBee opens up and we take a first snapshot to use as a baseline.
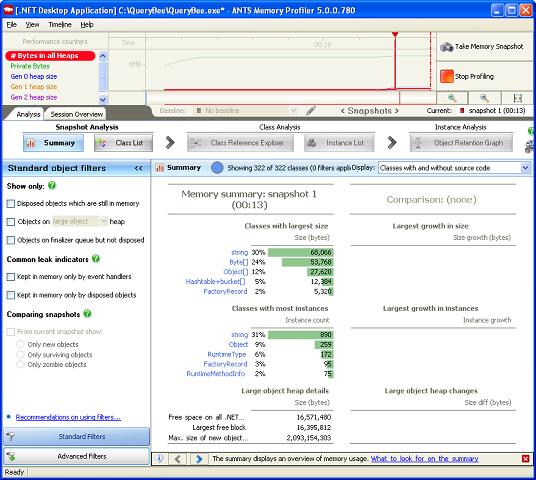
Fig. 22: Results from first snapshot.
We connect to a database and execute a SQL query.
Now, we’ll take an extra snapshot, because we want to be able to verify that the query form has disappeared. This will give us results for snapshot 2.
Finally, we close the query window with the results grid and we take a third snapshot.
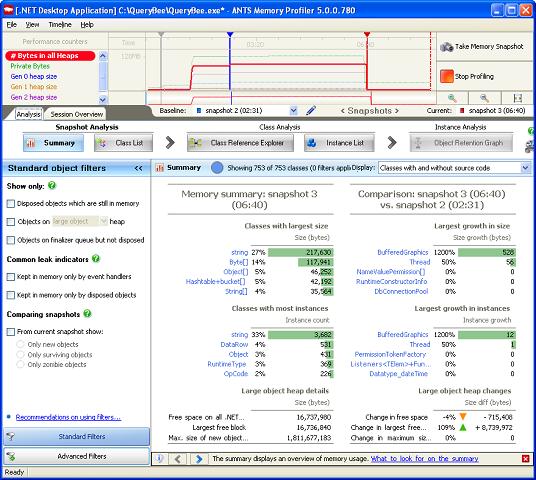
Fig. 23: Summary screen comparing snapshots 2 and 3.
We switch to a comparison between snapshots 1 and 3, using the snapshot selection fields just under the timeline.
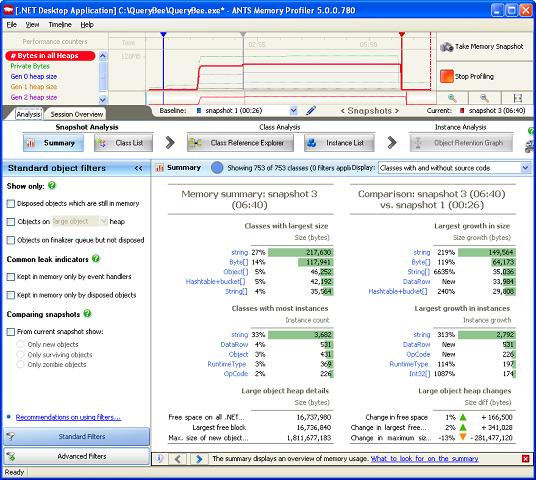
Fig. 24: Summary screen comparing snapshots 1 and 3.
Let’s see if there’s a QueryForm still in the class list.
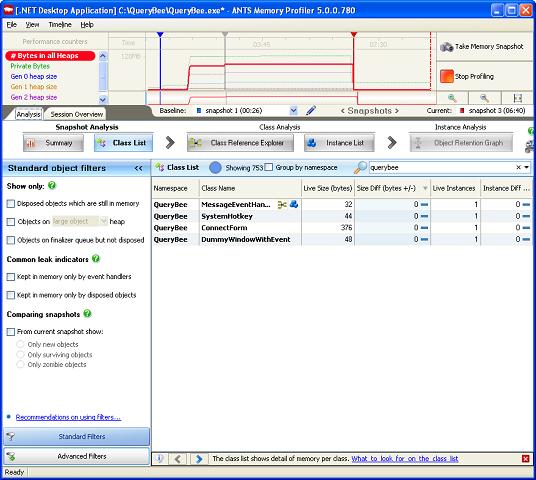
Fig. 25: The timeline shows a sudden drop in memory.
No, it’s gone. We’re no longer leaking the form.
As you saw, it was fairly easy to track down a form which was being leaked.
If you would like to try this on your own application, you can download a free 14-day trial from Red Gate’s website.
Load comments