
You created a brand-new API developed on the REST principles and set up under the ASP.NET world. Now you want to test it. More specifically, you want to create and run some stress tests for your API in to understand how fast it is and how much load it supports.
The .NET team has discontinued their cloud-based load testing service a while ago under Visual Studio 2019 due to the lack of community adoption. Users in the community now had to think about the one million-dollar question: What is the best load/stress testing tool for my .NET projects? The answer starts right before the “.NET projects” part. Most people load testing nowadays are doing that against web APIs or, at least, web applications (that handle endpoints the same way with different media types).
Because of this particular point, these types of tools are mostly agnostic because some of them provide very platform-specific features like the JSR223 (a scripting language for Java apps) assertions that JMeter supplies, for example.
In this article, you’re going to dive into the universe of Apache JMeter, one of the most used agnostic load test tools in the software development community by testing it against a REST application created in ASP.NET.
JMeter setup
JMeter is made with Java 8+, so it requires the JDK (Java Developers Kit) on your machine before using it. Be sure to download and install it. The installation for JMeter is a little bit different from the usual installer approach. Instead, you must go to the JMeter Download page and download the binary zipped file.
Unzip it and navigate to the bin folder in which you will find a file called jmeter.bat. Double-click it and the window shown in Figure 1 will show up.
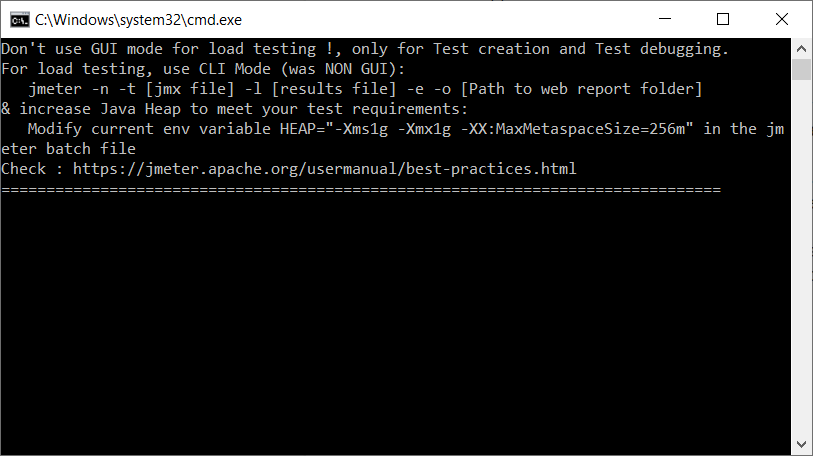
Figure 1. Starting up Apache JMeter tool
The GUI tool is going to load in the background until it pops up as shown in Figure 2.
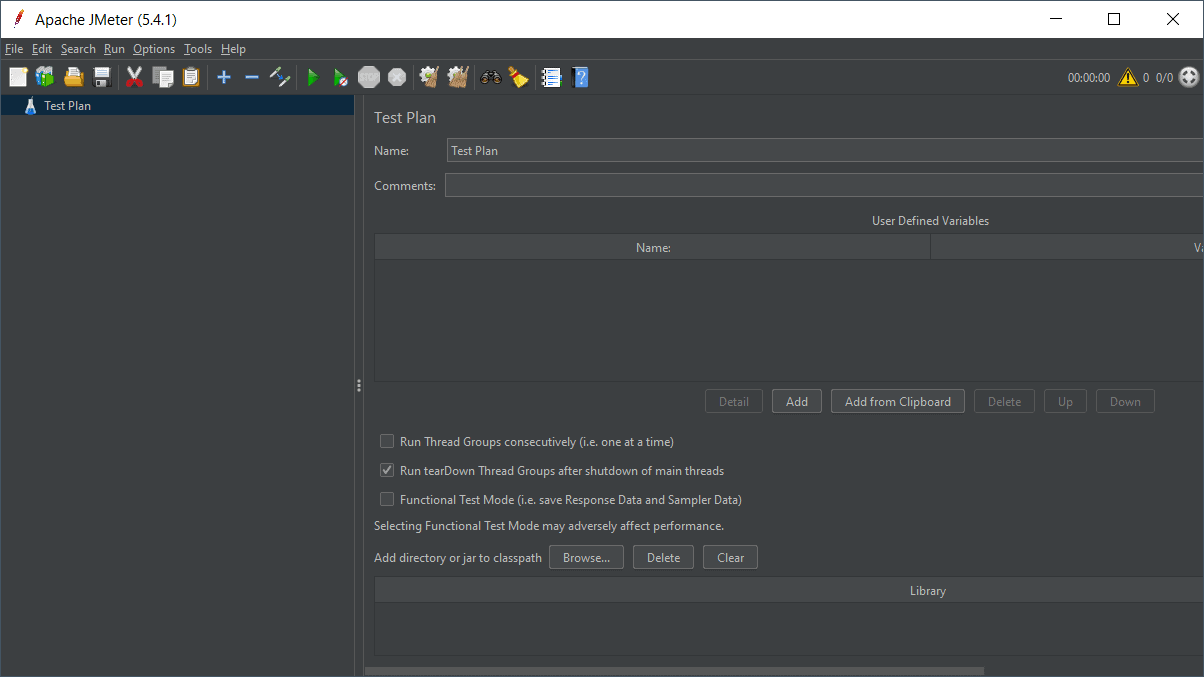
Figure 2. Apache JMeter initial screen
Take some time to look at the options and menus displayed on this screen.
The .NET application
For simplicity, this example will not create an API application from scratch since it’s not the focus of the article. You can test whatever web application or live API on the web that you have handy. However, to get the feeling of local tests, use a CRUD API I’ve developed before in another article: Creating ASP.NET Apps with React.
You may find the source code here. Please, clone it to your machine, cd into the \ReactASPNET\ReactASPCrud\ReactASPCrud\ folder, and run the following command:
|
1 |
dotnet run |
This command will start up the application at http://localhost:5000. Leave it there and get back to the tests.
JMeter test plans
In JMeter, everything starts from a Test Plan. That’s the very definition of how JMeter groups things together as a composition of runnable tests. You can have as many test plans as you want for a single project.
JMeter loves groupings. Typically, since you’re dealing with stress testing, you have to deal with loops. Loops are used to check if the given resource can handle all the concurrent load that you’d eventually have in a real-world scenario. That’s why you always start by adding a new Thread Group to your Test Plan. Figure 3 demonstrates the menus you may access to add a Thread Group.
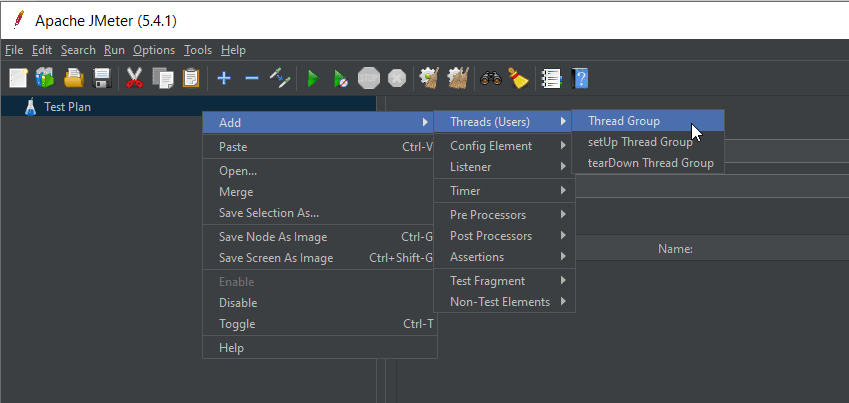
Figure 3. Adding a new Thread Group to your Test Plan
You may see a bunch of fields under the Thread Properties section. Among all these fields, there are three of them that are more important:
- Number of threads (users): as the name suggests, this field represents how many users you envision to be using the same endpoint at the same time. Usually, you’re going to add a value way higher than the average of concurrent users you have in order to stress your system.
- Ramp-up period (seconds): this field considers a ramp-up strategy over time which tells JMeter how long to wait until loading the next user (request).
- Loop count: how many iterations this thread group test may have?
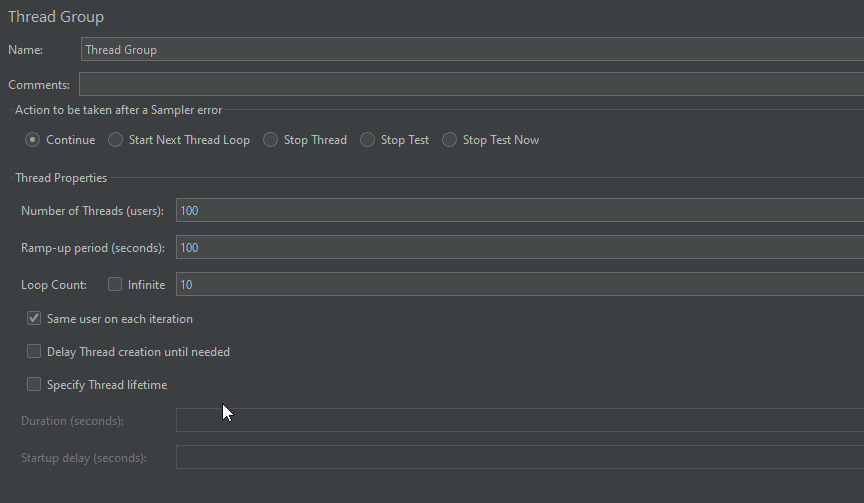
Figure 4. Configuring the Thread Properties of your Thread Group
Great! Now that you have your Thread Group set up, you need to determine what this group will iterate over. You can iterate over many different types of requests, such as JDBC, JMS, FTP, etc. However, since you’re dealing with a REST API, the HTTP requests are the next elements to configure.
But first, take a shortcut through a very nice config called HTTP Request Defaults. Figure 5 shows how to access this option.
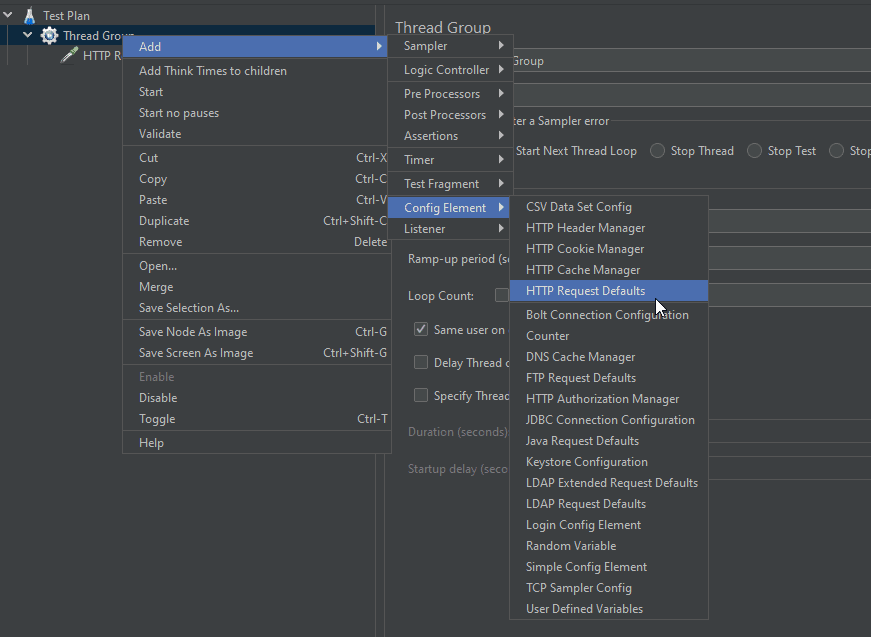
Figure 5. Adding a new HTTP Request Defaults
This option helps you globally configure HTTP properties that are most commonly used such as the URL root address of your API, HTTP Authentication settings, IP, port, etc. This is a great option when you have to test many API endpoints within the same Thread Group without having to explicitly duplicate the information.
Go ahead and fill in the options as shown in Figure 6.
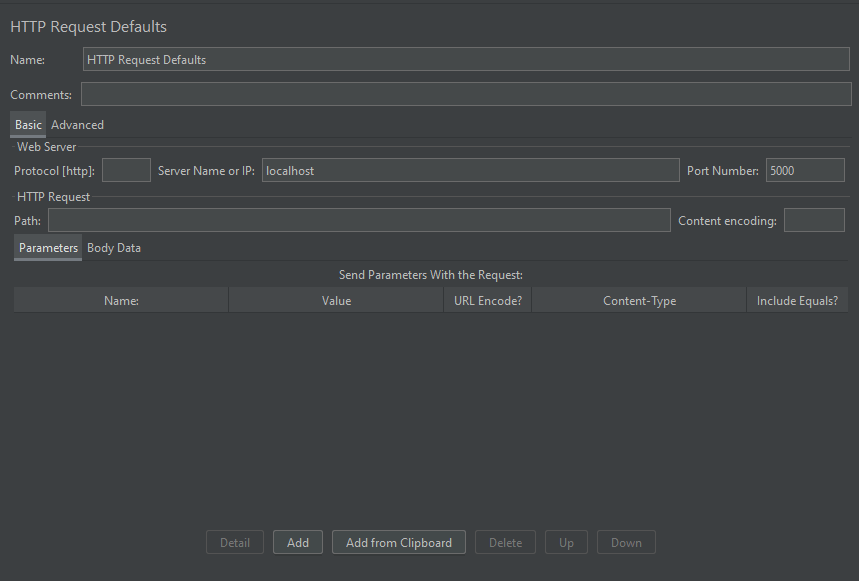
Figure 6. Setting up HTTP Request Defaults options
You may also notice that these configs are being stacked on top of each other on the left panel of the JMeter GUI tool. It stacks things in a nested way in order to keep the hierarchy of your settings, so pay attention to that.
Now that you have a default configuration for your HTTP requests, move on to add the first API endpoint to test. Start with the most simple one: the users’ listing at https://localhost:5000/api/users.
Figure 7 shows how to add a new HTTP Request Sampler element.
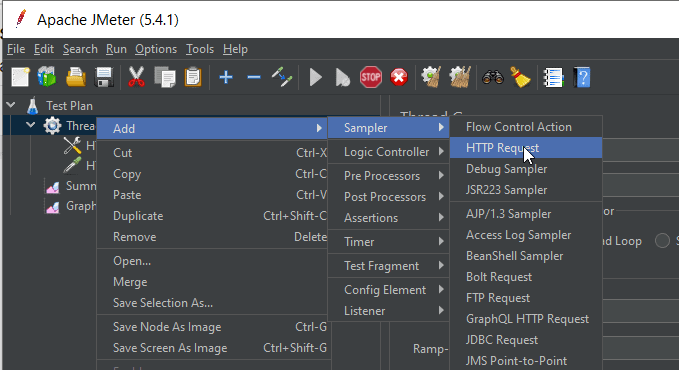
Figure 7. Adding a new HTTP Request to the Thread Group
Figure 8 demonstrates how you may fill in the fields. Remember that the Server Name/IP and Port Number were already provided within the previous Defaults setting, so there’s no need to set it again.
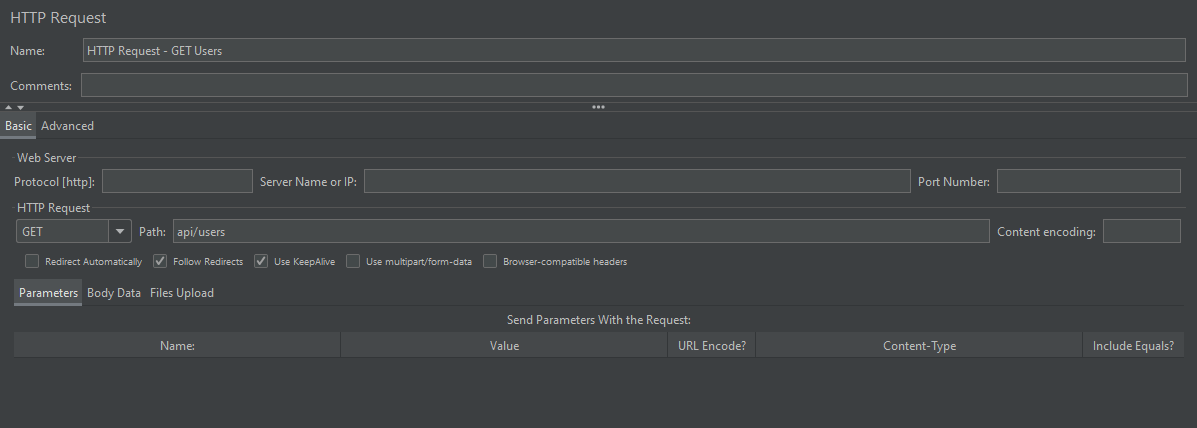
Figure 8. Setting the HTTP Request endpoint details
This is basically everything you need as a minimum setup for an HTTP request suite. However, in order for you to check the results of the stress test, you need to ask JMeter to measure the right metrics. JMeter can deal with a bunch of different and useful result listeners. Take a look at the two most used ones.
Figure 9 and 10 shows how to add a new Summary Report and a new Graph Results listeners, respectively. Go ahead and do that to your Test Plan as well.
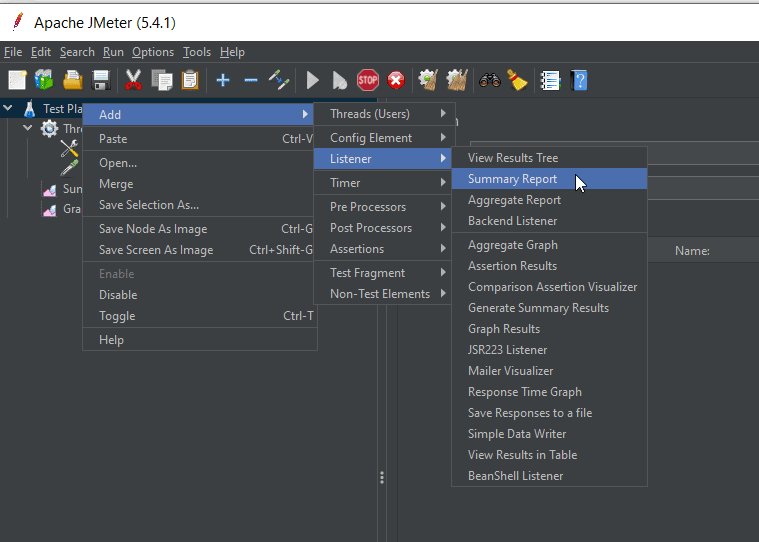
Figure 9. Adding a new Summary Report to the Test Plan
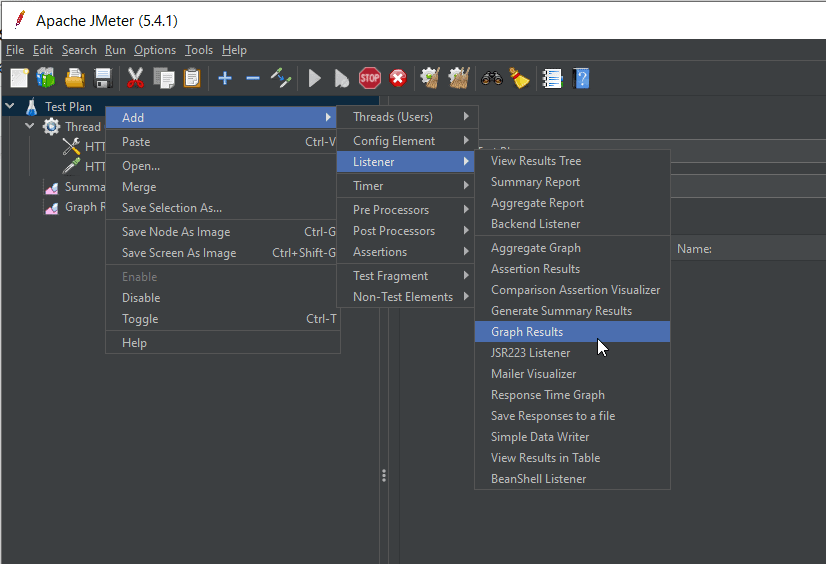
Figure 10. Adding a new Graph Results to the Test Plan
There’s no better way to see what these two listeners can rather than run the Test Plan. Before that, make sure to save your current test settings by hitting Ctrl+S on the keyboard. It’ll trigger a new window (Figure 11) for you to select the directory to save the tests as a file with a .jmx extension.
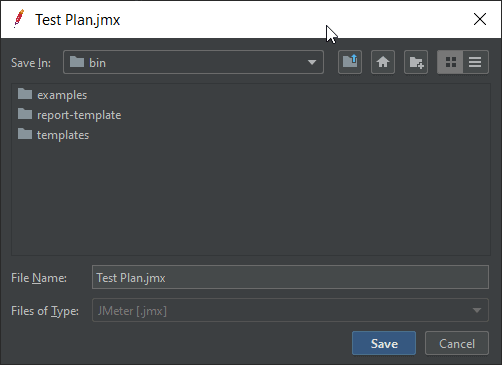
Figure 11. Saving the current test suite
You can then add this file to your project repository, and other members of your team can load it on their own JMeter tools as well.
Now, click the Start button on the top bar or hit the Ctrl+R keyboard shortcut to execute the Test Plan. As the logs start to show up on the terminal window where you started the local API application, you’ll get to see the summary of the execution when you click the Summary Report item on the left panel. That’ll display the screen shown in Figure 12.

Figure 12. Displaying the Summary Report whilst running the tests
That is useful information since you can see not only the number of samples running at the time but also the average of users, the maximum number of samples at any time during the execution, the error rate, and more.
If you open the Graph Results item, that may show similar results as in Figure 13.
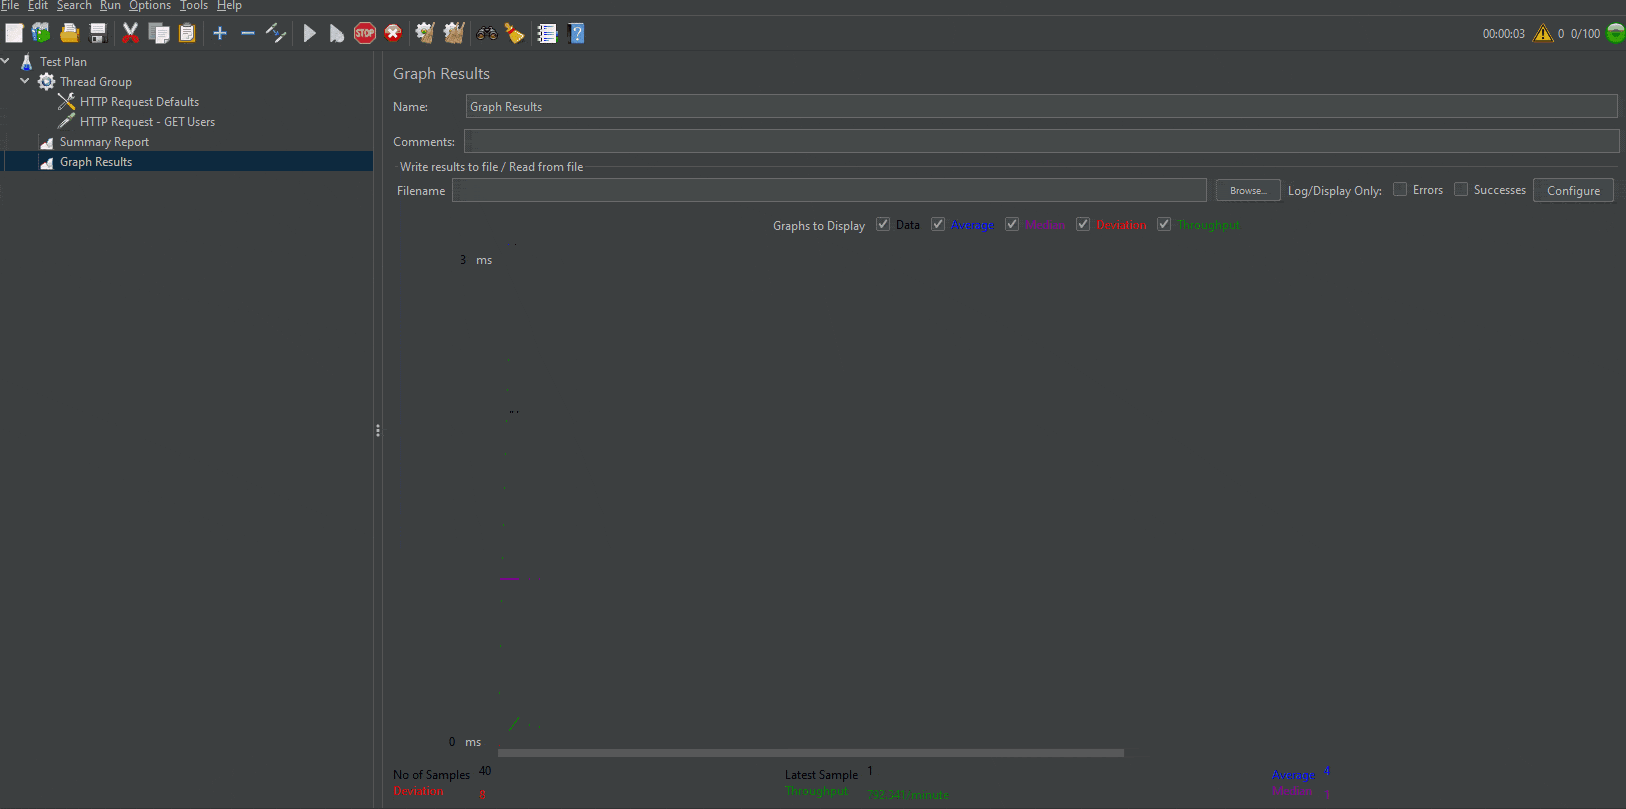
Figure 13. Animated results from the Graph Results whilst running the tests
This graph not only brings important information about the number of executed samples, but also graphically displays the throughput vs the deviation of the tests. The higher the throughput, the more the application can deal with heavy loads of requests. The opposite is true for the deviation. In this example, the average was around 650 requests/minute.
Extra listeners
There are a couple more nice listeners to consider when developing your JMeter tests. Take some time to explore them as well. The first one is the View Results Tree. You can add it the same way you added the previous ones, via Add > Listener > View Results Tree.
Before you rerun the tests, make sure to clean up the previous execution. You can do that by clicking the “gear and two brooms” icon on the top bar. Then, rerun the tests. You may see a similar result to the one shown in Figure 14.
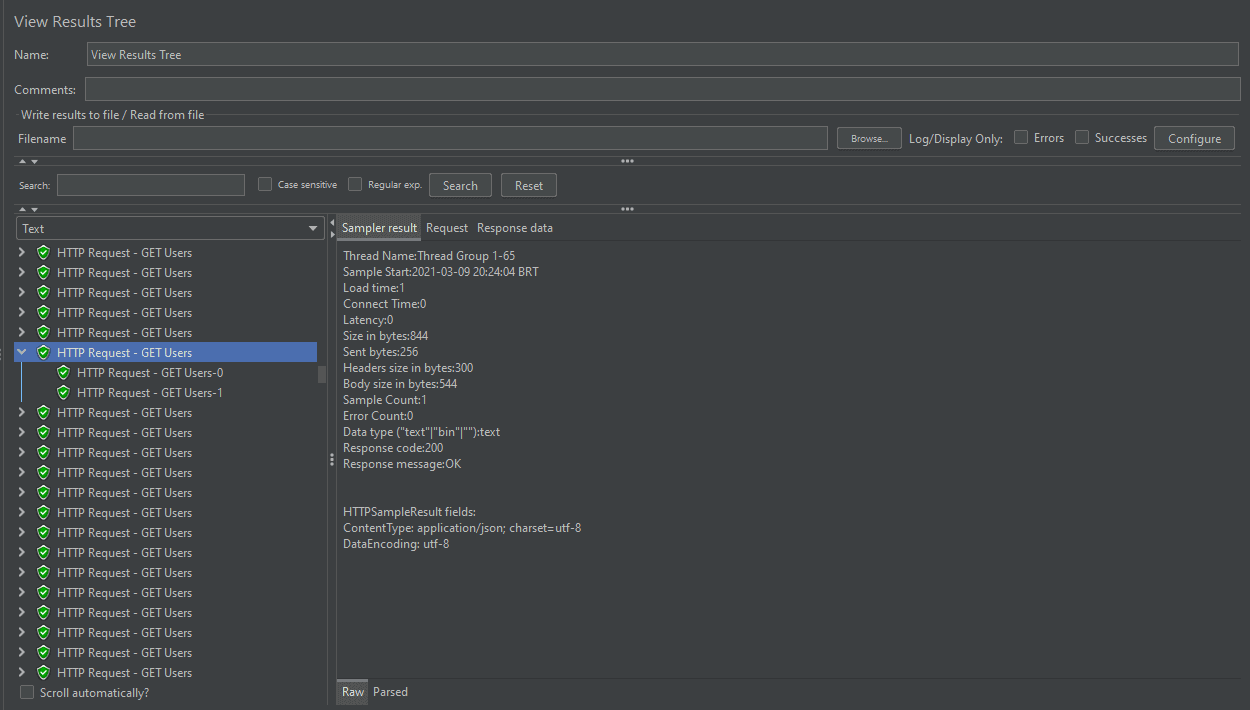
Figure 14. Displaying the View Results Tree results
Here, JMeter is going very granular by displaying each one of the request’s information as well as HTTP headers, body size, response code and message, and many more. This is great when you need to search for a very explicit error in specific scenarios.
Another significant measure can be displayed by the Response Time Graph as shown in Figure 15. It works by plotting a graph with two axes: the time vs the number of requests. This graph shows the request/response throughput through the time execution.
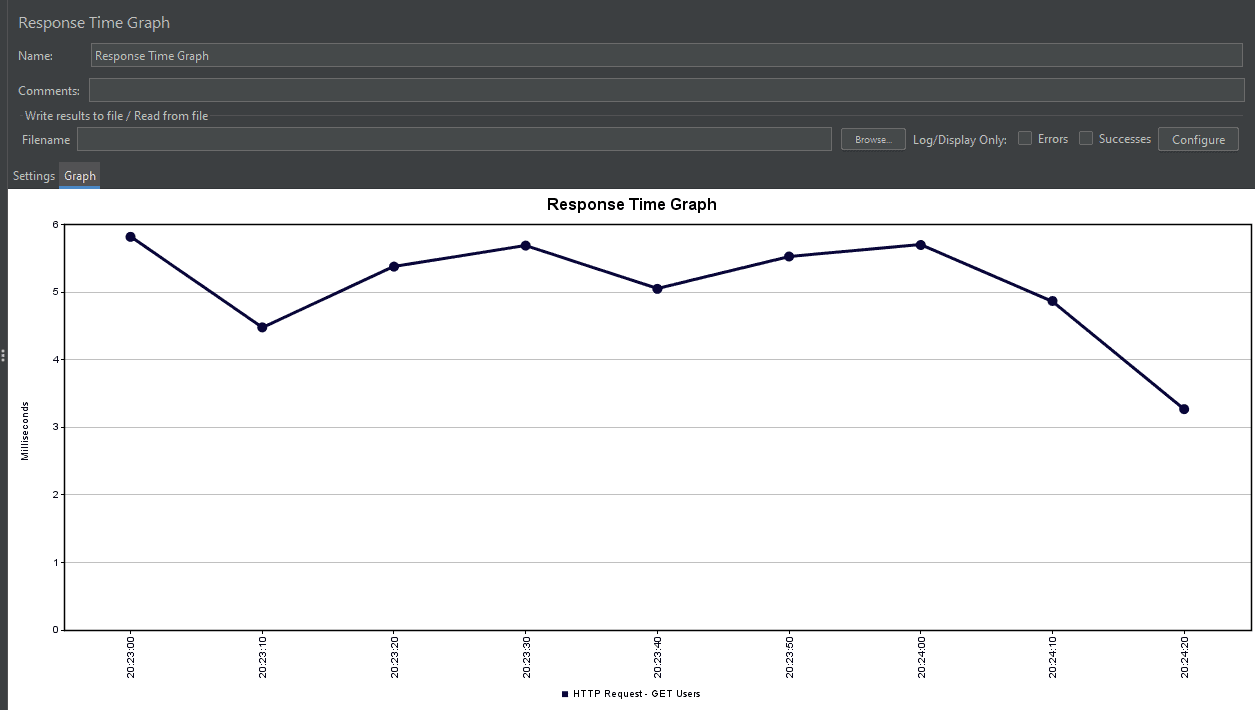
Figure 15. Displaying the Response Time Graph results
Again, you can add this type of listener via the same steps as before.
Response assertions
During the tests, it is common to have scenarios where you’d like to check for a specific HTTP response status or even if the response body attends to a specific condition. For situations like that, JMeter provides you with the Assertions. Start with the HTTP response status assertion configuration.
Figure 16 shows how to add a new one to your Thread Group.
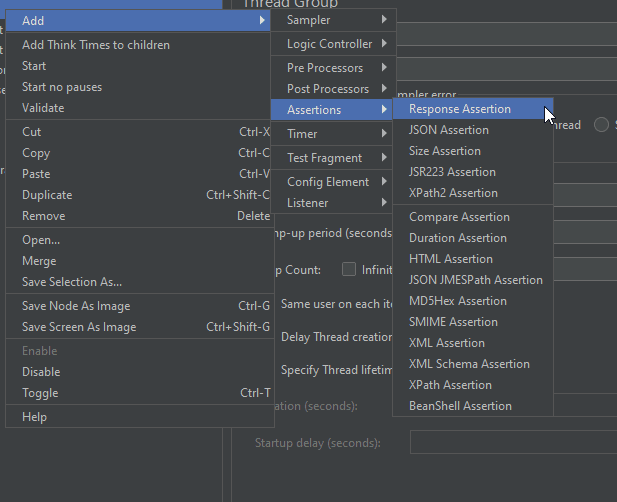
Figure 16. Adding a new Response Assertion checker
Make sure to check the Response Code option in the Field to Test config. The Pattern Matching Results must be set as Equals as shown in Figure 17.
To add a new pattern click the Add button on the bottom side of the screen and add the 200 as the value for the Patterns to Test option.
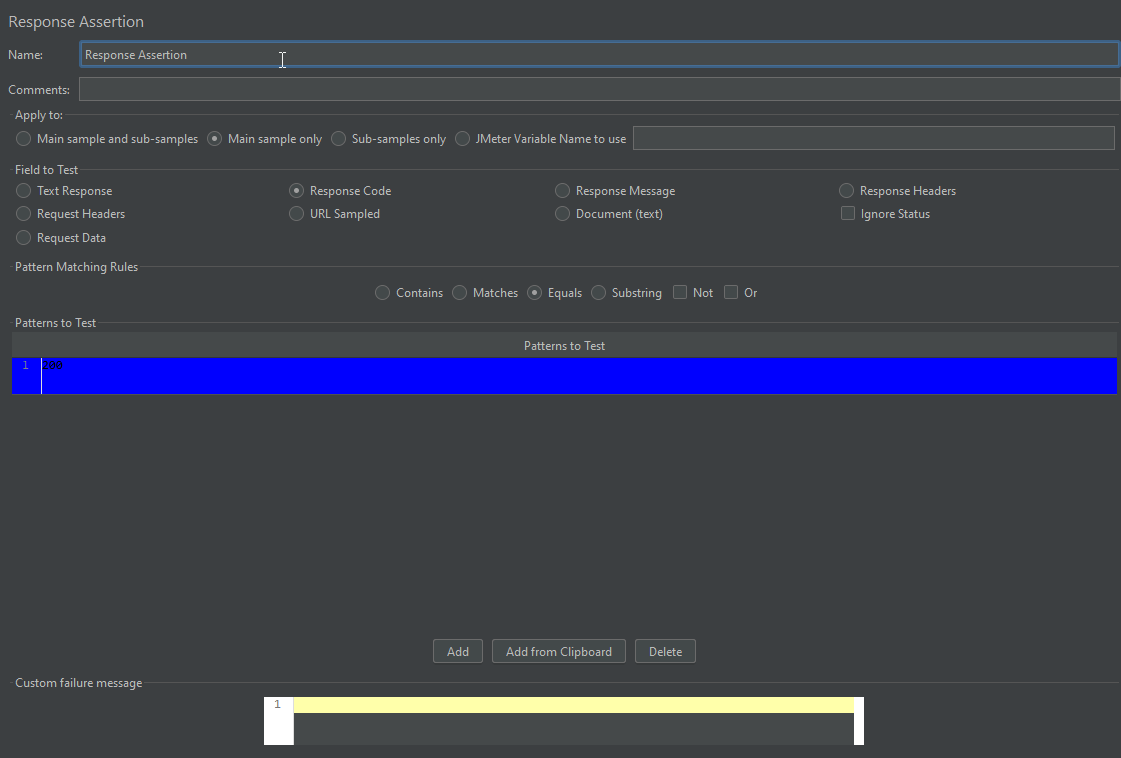
Figure 17. Setting up the Response Assertion
That’s it! Whenever you receive an HTTP status code other than 200 the View Results Tree listener will show the error.
Another interesting assertion available for APIs that make extensive use of JSON is the JSON Assertion. To add it, go to the same menu Add > Assertion > JSON Assertion and configure it as shown in Figure 18.
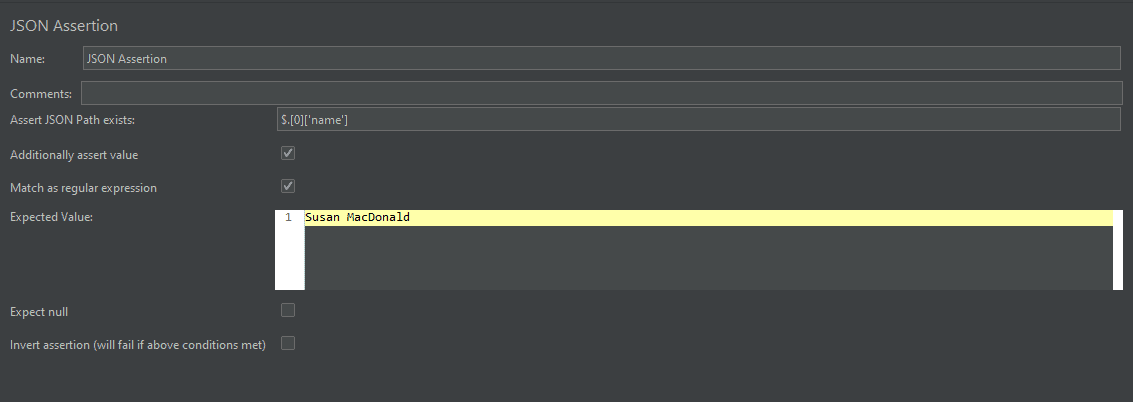
Figure 18. Setting up the JSON Assertion
The Assert JSON Path exists field receives an expression to catch a specific value from the JSON response.
Listing 1 shows an example of the users’ list currently returned by the API. Since the data is always randomly generated at start-up, your test would fail. Make use of this to test the failing assertion. The JSON Assertion states that JMeter must check if the name property of the first list item is equal to “Susan MacDonald”. Don’t forget to check the Additionally assert value checkbox.
Listing 1. JSON response from the users API
|
1 2 3 4 5 6 7 8 9 10 11 12 13 14 15 16 17 18 19 20 21 22 23 24 25 26 27 28 29 30 31 32 33 34 35 36 37 |
[ { "id":1, "name":"Mary Gay", "email":"mary@yahoo.com", "document":"0562264851", "phone":"+1 888-452-1232" }, { "id":2, "name":"Neil Strip", "email":"neil@outlook.com", "document":"-654353851", "phone":"+1 888-452-1232" }, { "id":3, "name":"Jonathan O'Neil", "email":"jonathan@outlook.com", "document":"0424625040", "phone":"+1 888-452-1232" }, { "id":4, "name":"Joe Spenser", "email":"joe@outlook.com", "document":"1415116364", "phone":"+1 888-452-1232" }, { "id":5, "name":"Jonathan O'Neil", "email":"jonathan@hotmail.com", "document":"-367589335", "phone":"+1 888-452-1232" } ] |
Figure 19 shows the View Results Tree execution results.
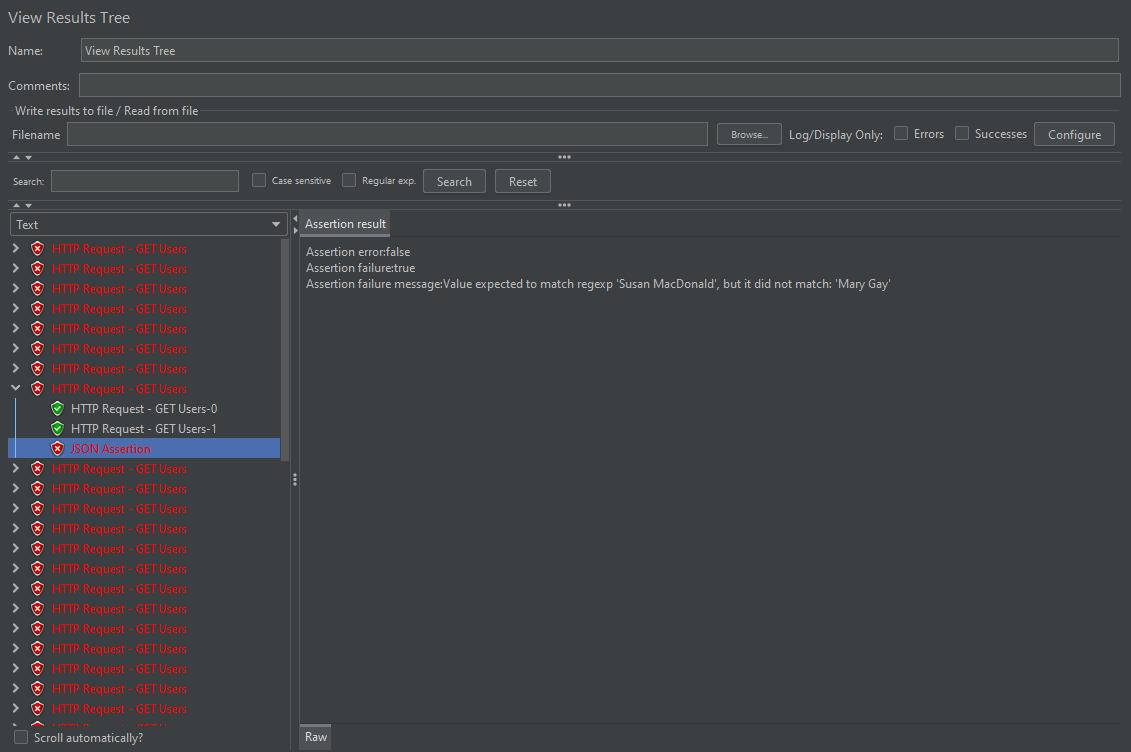
Figure 19. Displaying the wrong JSON assertion results
As you can see, the assertion failed because the expected value doesn’t match the received one, which is “Mary Gay”.
If you update the JSON Assertion accordingly, then your tests will pass.
Load/stress testing .NET apps with JMeter
As you’ve seen, JMeter is a powerful tool that comes with many built-in functionalities for various scenarios. Apart from that, JMeter’s community provides you with an enormous amount of open-source plugins that you can add to give even more flexibility and power to your load tests. One of them that is very useful is the JSONFormatter that helps with beautifying your HTTP JSON responses.
Last but not least, make sure to refer to its official docs for more on what it is capable of doing.
This document contains proprietary information and is protected by copyright law.
Copyright © 2026 Red Gate Software Limited. All rights reserved
Load comments