

In Part 1 of this series, we covered the operational overlap between DevOps and Site Reliability Engineering (SRE). While DevOps emerged from the need for agile and automated software delivery cycles, SRE has its roots in teams doing systems engineering. SRE emphasizes stability, observability, and proactive failure management. On the surface, they might appear to serve different priorities (speed versus stability), but both aim to build resilient systems that deliver value continuously and reliably.
Now, in Part 2, we shift focus from theory to practice. We will explore how organizations can harmoniously integrate both practi: the agility of DevOps and the resilience of SRE. During integration, it requires deliberate changes to culture, tooling, metrics, and collaboration patterns. We’ll examine how cross-functional teams can work in tandem. Additionally, we will cover how a unified performance framework can combine DORA metrics with SLOs and error budgets.
We’ll also look at real-world practices that teams can adopt. This guide will equip you with practical steps to build software at scale without compromising reliability.
Culture as the Foundation
Organizational culture determines how teams react under pressure, how they collaborate, and how they learn from failures. Without a shared culture rooted in trust, transparency, and ownership, even the most advanced tooling or process redesigns won’t succeed. When integrating DevOps and SRE, culture is the first and most crucial frontier.
Shared Ownership and Blameless Culture
Both DevOps and SRE emphasize a culture of ownership. Instead of assigning blame when things go wrong, high-performing teams focus on continuous learning. This mindset is supported by practices such as blameless postmortems, which encourage open discussions about incidents without fear of retribution. Even while working in high-stakes scenarios.
That doesn’t mean avoiding individual accountability. If someone accidentally deletes the production sales database and causes, for example, a $10,000-a-minute outage, the goal isn’t to gloss over what happened. It’s to understand why the system allowed a single person to cause such a failure, and how to prevent it in the future. A blameless approach focuses on improving processes to avoid the same mistakes from repeating themselves in the future.
A practical step is to institute joint retrospectives that involve both development and SRE teams. For example, after a production outage, a team may hold a postmortem that includes:
- A timeline of the incident
- Decisions made at each point
- Communication gaps
- Remediations and follow-up tasks
Such retrospectives, when shared transparently across teams, prevent knowledge silos and foster a shared understanding of system fragility. This learning cycle improves future resilience and helps ensure that the same mistakes aren’t repeated.
Practical Example
A practical example of implementing a blameless culture is by automating postmortems after high-severity incidents. Below is a GitHub Actions workflow (in YAML) that triggers when a GitHub issue labeled sev1 is closed. It automatically creates a new postmortem issue using a Markdown template. For more details, see GitHub Actions syntax reference and this GitHub repo.
|
1 2 3 4 5 6 7 8 9 10 11 12 13 14 15 16 |
name: Trigger Postmortem on: issues: types: [closed] jobs: create-postmortem: if: contains(github.event.issue.labels.*.name, 'sev1') runs-on: ubuntu-latest steps: - name: Create Postmortem Issue uses: peter-evans/create-issue-from-file@v4 with: title: 'Postmortem - ${{ github.event.issue.title }}' content-filepath: '.github/PULL_POSTMORTEM_TEMPLATE.md' |
What’s in the postmortem output?
A basic postmortem Markdown template (e.g., the PULL_POSTMORTEM_TEMPLATE.md referenced in the previous code sample) may include some basic system information, to which you would add details and follow ups after studying and discussing the issues that occurred:
|
1 2 3 4 5 6 7 8 9 10 11 12 13 14 15 16 17 18 19 20 21 22 23 24 25 26 27 28 29 30 31 32 |
## Postmortem - Checkout API Outage **Date/Time of Incident:** April 12, 2025 – 14:32 UTC **Lead Investigator:** @jdoe ### Summary The checkout service returned 500 errors to all users due to a misconfigured database migration. ### Impact - 14,000 users affected - 21 minutes of downtime - Estimated revenue loss: $8,200 ### Timeline - 14:32 – Deployment started - 14:34 – Error rate spike detected - 14:36 – Incident escalated via PagerDuty - 14:50 – Rollback completed ### Root Cause A missing column in the production database schema caused the application to crash when writing new orders. ### Lessons Learned - Need stricter schema validation in CI - Migration tested in staging did not match production ### Action Items - [ ] Add schema diff checks to pre-deploy hook - [ ] Update staging database snapshot weekly - [ ] Schedule follow-up review – @alice (Due: Apr 19) |
This makes postmortems consistent, quick to generate, and easy to share across teams. You can customize the Markdown template to include other fields like severity ratings, customer comms, or Slack channel logs.
Explanation of the YAML Code Snippet for GitHub Actions:
name: Trigger Postmortem: Names the GitHub Actions workflow so it’s easily identifiable in the Actions tab.on: issues: types: [closed]:This configuration tells GitHub to run the workflow when an issue is closed, which aligns with how incidents are often tracked — each as a separate issue.if: github.event.issue.labels contains 'sev1': Ensures the workflow only runs if the issue being closed has asev1label. This label typically marks high-priority incidents (e.g., a major outage), making sure postmortems are only generated for significant events.runs-on: ubuntu-latest: Specifies the operating system for the GitHub Actions runner. Usingubuntu-latestensures compatibility with most community actions and scripts.steps: This section defines the actual work done by the job. In this case:- name: Create Postmortem Issue: A human-readable step name for clarity.uses:peter-evans/create-issue-from-file@v4: A third-party GitHub Action used to create a new GitHub issue using a predefined markdown file. This action automates the creation of structured postmortem documentation.with: parameters:title: Dynamically sets the new issue title by referencing the original issue title — helpful for tracking and traceability.content-filepath: Points to the markdown template(.github/PULL_POSTMORTEM_TEMPLATE.md) used to create the postmortem content. This file typically includes standard fields like Impact, Timeline, Root Cause, Lessons Learned, and Action Items.
Cross-Functional Teams
Siloed teams, each working on their own piece of the system without knowledge or concerns for the other teams, leads to communication breakdowns and delayed responses. Integrating DevOps and SRE means breaking down these silos by building cross-functional teams that work together toward common goals, enhancing both agility and reliability. Effective communication between teams fosters proactive problem-solving and quick adaptation to changing system conditions.
A powerful model is the DevOps-SRE rotation. In this model, developers take on on-call duties (even for a few days per sprint) under the mentorship of experienced SREs. This approach helps developers better understand operational challenges, encourages them to write more resilient code, and ensures that everyone has a stake in the system’s stability.
When developers switch roles, they gain direct experience with real-world issues that SREs face in production environments, from handling incidents to managing alert fatigue. Similarly, SREs get a chance to familiarize themselves with the design and functionality of new features, which helps in scaling and maintaining those features effectively. This reciprocal learning strengthens the bonds between development and operations, fostering empathy and creating a more resilient system overall.
Another effective approach is embedding SREs within development squads for specific feature sprints. During this time, SREs can:
- Review infrastructure implications of new features
- Perform capacity planning to ensure scalability and availability
- Identify Service Level Indicators (SLIs) and Service Level Objectives (SLOs) relevant to the new functionality
These practices ensure that operational requirements are considered early in the development process. It leads to smoother deployments and fewer performance-related surprises in production.
To integrate developers and SREs into a cohesive on-call rotation, you can create on-call schedules using tools like PagerDuty or Opsgenie.
Example of a Terraform snippet to provision a rotation for DevOps and SRE teams using PagerDuty:
Earlier, we mentioned how integrating DevOps and SRE teams can include shared on-call responsibilities, such as having developers rotate into on-call schedules under SRE mentorship. If you’re implementing that model, you’d typically use something like PagerDuty schedules to manage alternating on-call duties automatically.
However, in many real-world cases, teams prefer a fallback-style escalation, where an SRE is paged first, followed by a developer if the SRE doesn’t respond in time. This model ensures that operational expertise is the first line of defense while still encouraging cross-functional awareness and shared responsibility.
The following Terraform snippet creates a PagerDuty escalation policy using static user references. It escalates to the developer only if the primary SRE does not acknowledge the incident within 10 minutes.
|
1 2 3 4 5 6 7 8 9 10 11 12 13 14 15 16 17 18 19 20 |
resource "pagerduty_escalation_policy" "dev_sre_policy" { name = "Dev-SRE Escalation Policy" num_loops = 2 rule { escalation_delay_in_minutes = 10 target { type = "user_reference" id = pagerduty_user.dev1.id } } rule { escalation_delay_in_minutes = 10 target { type = "user_reference" id = pagerduty_user.sre1.id } } } |
Explanation of the Code Snippet:
resource "pagerduty_escalation_policy" "dev_sre_policy":This line defines a new resource in Terraform for creating a PagerDuty escalation policy nameddev_sre_policy. An escalation policy determines how incidents are escalated to different users if not resolved on time.name = "Dev-SRE Escalation Policy":Specifies the name of the escalation policy. This is a human-readable identifier, so it’s easy to reference and understand its purpose.num_loops = 2: This attribute defines how many times PagerDuty will loop through the escalation chain before the issue is considered unresolved. In this case, the policy will loop through two levels, ensuring that both the DevOps and SRE teams have an opportunity to handle the issue.rule: This block defines the rules for escalating the incident. Each rule specifies the delay before the incident is escalated to the next user, and who the target user is for that escalation.escalation_delay_in_minutes = 10: The incident will escalate to the next target user after 10 minutes if the current user does not respond.target { type = "user" id = pagerduty_user.dev1.id }: Specifies the first target for escalation, which is a DevOps user (dev1). Theidrefers to the unique identifier of the user within PagerDuty.target { type = "user" id = pagerduty_user.sre1.id }: Similarly, if the DevOps user does not acknowledge or resolve the incident, it will be escalated to the SRE user (sre1), using their unique ID.type = "user_reference":Specifies the individual user as the target. This defaults to user_reference, which is the most common option. To use rotating schedules instead of specific users, replace the type withschedule_referenceand refer to a defined on-call schedule. This is useful when teams want developers and SREs to alternate responsibilities without hardcoding users. See PagerDuty Terraform documentation for complete configuration options.
This configuration ensures that both the DevOps and SRE teams are engaged in the incident response process, reducing the risk of alert fatigue and fostering a sense of shared responsibility. The escalation policy also ensures that there is no gap in incident resolution, maintaining system reliability and speed in resolving issues.
This shared responsibility model helps both teams build empathy and technical depth by understanding each other’s contexts and operational challenges. The integration of developers and SREs into a single, unified workflow improves collaboration and ensures a smoother path to achieving both system reliability and software agility.
Leadership and Buy-In
Cultural transformation requires leadership to prioritize and model reliability. Leaders must treat reliability as a first-class feature, integrating it into team KPIs (Key Performance Indicators) and OKRs (Objectives and Key Results). This ensures that reliability is a shared responsibility across teams.
For example, leaders might set the following OKRs to focus on reliability while maintaining delivery speed:
- Objective: Improve system reliability without slowing down delivery
- KR1: Maintain SLO (Service Level Objective) adherence > 99.95%
- KR2: Reduce change failure rate to < 10%
- KR3: Keep MTTR (Mean Time to Recovery) under 30 minutes
These metrics ensure reliability is a key part of performance reviews. Leaders should actively review them in sprint reviews to reinforce the shared responsibility for reliability.
Additionally, the “you build it, you run it” model works best when leadership provides support. Engineers should be empowered to own their work, but adequate resources and guidance are crucial to avoid burnout.
Leaders should foster a culture of accountability and support by providing necessary tools, mentorship, and feedback, ensuring teams can deliver high-quality, reliable systems
Tooling That Unites, Not Divides
A fragmented toolchain often reinforces silos. When DevOps and SRE teams work on separate platforms and dashboards, it limits visibility and creates tunnel vision. To successfully integrate these philosophies, teams must establish shared visibility, standardized workflows, and tooling choices that support both fast delivery and system reliability.
Common Tooling Stack
The key to integration is aligning on a unified tooling stack across essential areas like CI/CD, Infrastructure as Code (IaC), monitoring, and observability. A potential integrated stack could include:
- CI/CD: GitHub Actions, GitLab CI/CD, Azure DevOps, and Flyway (for database migrations)
- IaC: Terraform (for multi-cloud provisioning), Pulumi (for code-native IaC), Ansible (for configuration management)
- Monitoring: Prometheus for time-series metrics, Grafana for visualization and Redgate Monitor (as an alternative for SQL Server environments)
- Observability: Datadog, New Relic, or OpenTelemetry for tracing and logs
One of the most overlooked areas in DevOps pipelines is database change management. Traditional DevOps pipelines often exclude databases, treating them as manual bottlenecks. This leads to inconsistent deployment processes and makes it difficult to ensure smooth database changes. Redgate SQL Change Automation fills this gap by:
- Enabling version control for SQL schema changes
- Running pre-deployment checks (linting, validation)
- Integrating with CI/CD tools like Octopus Deploy and Azure Pipelines
This ensures that database changes follow the same process as application code, allowing both developers and SREs to contribute to safe and traceable database deployments.
Sample Pipeline Using GitHub Actions and Flyway
For teams practicing database DevOps, it’s essential to integrate schema migrations into the same CI/CD pipelines that manage application deployments. Flyway, a widely adopted open-source database migration tool, enables version-controlled and testable database changes using SQL scripts or Java-based migrations.
Here’s a simplified example of how to automate database deployments with GitHub Actions and Flyway. This pipeline validates and deploys schema changes to a staging environment whenever code is pushed to the repository.
|
1 2 3 4 5 6 7 8 9 10 11 12 13 14 15 16 17 18 19 |
name: CI/CD Pipeline on: [push] jobs: build: runs-on: ubuntu-latest steps: - uses: actions/checkout@v2 # Checkout the code repository - name: Run Flyway Validate run: | flyway -url=jdbc:postgresql://localhost:5432/mydb -user=dbuser -password=secret validate deploy: needs: build # Deploy job runs only after a successful build runs-on: ubuntu-latest steps: - name: Run Flyway Migrate run: | flyway -url=jdbc:postgresql://localhost:5432/mydb -user=dbuser -password=secret migrate |
Explanation of the Workflow:
name: CI/CD Pipeline: Labels the GitHub Actions workflow.on: [push]: Triggers the pipeline when new code is pushed.jobs:: Defines the stages in the pipeline:build job:Runs flyway validate to ensure all pending migrations are valid and properly formatted.deploy job: Executes flyway migrate to apply the migrations to the staging database.
Flyway supports a wide range of databases (PostgreSQL, SQL Server, MySQL, Oracle, etc.) and allows you to manage schema changes with plain .sql files or Java-based migrations. You can store these scripts in version control to ensure traceability and rollback support.
Integrating Flyway into your CI/CD pipeline ensures that database changes pass through the same validation and deployment controls as application code. This improves release consistency and reduces the risk of breaking changes during production deployments.
SRE Observability Meets DevOps Pipelines
SREs often use Service Level Indicators (SLIs) and Service Level Objectives (SLOs) to track system performance. However, these metrics are frequently managed outside the deployment lifecycle, which results in missed opportunities for proactive remediation. To address this gap, it’s essential to integrate reliability checks directly into the CI/CD pipelines. This ensures that any performance issues are caught early and acted upon before they reach production.
Key strategies to integrate SRE observability into DevOps pipelines include:
- Alerting as Code: Storing Prometheus Alertmanager configurations in Git repositories so alerts can be version-controlled and deployed alongside code changes.
- SLO Gates: Setting SLO thresholds for services (e.g., ensuring a 99.9% API success rate) and automatically failing builds or blocking promotions if these thresholds are exceeded.
- Chaos Testing: Using tools like Gremlin or LitmusChaos to intentionally simulate adverse conditions such as network latency, CPU spikes, or pod crashes during pre-production testing. This helps assess how the system behaves under stress before it reaches production.
Redgate’s Flyway integration can enhance this process by embedding database SLOs into the CI/CD pipeline. For instance, if a database schema migration is expected to take more than 10 seconds the deployment is halted, and a remediation workflow is triggered.
What is a database migration?In this context, a migration refers to any database schema change applied to a target environment, such as creating or altering tables, adding indexes, modifying constraints, or running pre-populated data scripts. Migrations can range from safe, additive changes (like adding a column) to non–backward-compatible operations such as dropping tables, renaming columns, or restructuring schemas.
Given this variability, teams should scope their SLOs based on the nature and risk level of each migration. For instance:
- Safe changes (e.g., adding a nullable column) may skip strict SLO enforcement.
- High-impact or irreversible changes (e.g., column drops, large data rewrites) should trigger latency SLO checks and rollback readiness protocols.
Here’s an example shell script to enforce a 10-second migration time threshold using Flyway:
|
1 2 3 4 5 6 7 8 9 10 11 12 13 |
START=$(date +%s) flyway -url=jdbc:postgresql://localhost:5432/mydb -user=dbuser -password=secret migrate END=$(date +%s) DURATION=$((END - START)) THRESHOLD=10 if [ "$DURATION" -gt "$THRESHOLD" ]; then echo "⚠️ Migration exceeded latency threshold ($DURATION seconds > $THRESHOLD seconds). Aborting." exit 1 fi |
This script can be extended to evaluate change types based on naming conventions or metadata (e.g., flagging destructive operations for stricter checks
Here’s another shell script you can use in a Jenkins pipeline to detect when a latency-based Service Level Objective (SLO) limit has been breached. While this script doesn’t enforce a rollback, it can be used as a gate that stops the deployment process early, helping teams catch issues before they reach production.
|
1 2 3 4 5 6 7 8 |
LATENCY=$(curl -s http://metrics/api_latency | jq .p95) # Fetches the 95th percentile latency metric THRESHOLD=500 # Sets the threshold for acceptable latency in milliseconds if [ "$LATENCY" -gt "$THRESHOLD" ]; then echo "Latency SLO breached: ${LATENCY}ms exceeds ${THRESHOLD}ms." echo "Aborting deployment to prevent pushing underperforming code." exit 1 fi |
This script functions as an early exit checkpoint—if the 95th percentile latency exceeds the defined threshold it prevents the pipeline from progressing further. In a full implementation, this would typically be followed by rollback commands or automated remediation steps, such as reverting to a stable build, notifying on-call engineers via Slack or PagerDuty, or logging the event for audit purposes.
Note: This snippet is intentionally simplified to demonstrate the SLO check. In production systems, you’d likely wrap this in a larger script that includes rollback logic, notification workflows, or integration with deployment platforms.
More Explanation of the Code Snippet:
LATENCY=$(curl -s http://metrics/api_latency | jq .p95):This command fetches the 95th percentile latency (p95) from a metrics endpoint (http://metrics/api_latency) usingcurland processes the result withjqto extract the desired metric.THRESHOLD=500: Sets a threshold for latency (in milliseconds). In this case, if the latency exceeds 500ms, the deployment is considered to have failed.if [ "$LATENCY" -gt "$THRESHOLD" ]; then: The script compares the fetched latency with the threshold. If the latency exceeds the threshold, it triggers the actions inside the if block.echo "Latency SLO breached. Aborting deployment.":Outputs a message to the console indicating that the latency threshold has been breached.exit 1: Exits the script with a non-zero status, which in Jenkins causes the deployment to fail, preventing the release of potentially faulty code.
This type of gate is crucial because it prevents poorly performing builds from reaching production, thereby protecting the end-users from experiencing degraded service. By embedding SLO checks into the CI/CD pipeline, teams can proactively ensure that reliability objectives are met before a deployment progress to production.
Aligning Metrics and KPIs
Metrics are powerful tools for driving behavior. If your team’s metrics aren’t aligned, their priorities won’t be either. In DevOps, speed is often prioritized, measured by DORA metrics. While in SRE, stability is essential, tracked via SLIs (Service Level Indicators), SLOs (Service Level Objectives), and error budgets. An effective strategy strikes a balance between both.
Merge DORA + SLO Metrics
To get a complete picture of software performance, it’s crucial to combine the following key metrics from both DevOps and SRE:
- DORA Metrics:
- Deployment frequency: How often code is deployed to production.
- Lead time for changes: The time it takes for a code change to go from development to production.
- Change failure rate: The percentage of changes that fail in production.
- MTTR (Mean Time to Recovery): The time it takes to recover from a failure.
- SRE Metrics:
- SLO adherence: How well your system meets its reliability goals.
- Error budget burn rate: The rate at which the error budget is being consumed, indicating the system’s stability.
- Time spent on toil: Operational work that is manual, repetitive, and doesn’t contribute to long-term reliability.
When you merge these metrics, you can gain a more comprehensive understanding of both the speed (from DORA) and stability (from SRE) of your software. For example, if your team deploys multiple times daily, but constantly violates SLOs with incidents spiking post-deployment, this signals a reliability issue that needs addressing.
How Integration Looks in Practice
To integrate both sets of metrics, here are some practical steps:
Tag deployments in your observability tools (e.g., Grafana, Datadog, New Relic)
Deployment markers help correlate changes with performance shifts. For instance, when a new release is pushed, a tag allows teams to visualize when that happened and whether key metrics (latency, error rates, CPU usage) changed immediately afterward.
Correlate service performance with any kind of change event
This includes code deployments, configuration changes, and database migrations. Use CI/CD metadata, commit hashes, or deployment annotations to connect change events to service metrics like API latency or transaction success rates. This creates a traceable path between what changed and how the system behaved.
Trigger alerts for SLO violations after deployments
For example, if latency increases or query timeout rates spike beyond acceptable thresholds, this may indicate a degraded experience or reliability issue. These alerts help teams proactively catch performance regressions before they affect users.
Code Snippet 1: PromQL Query for SLO Burn Rate
Here’s a Prometheus Query Language (PromQL) query to measure the SLO burn rate for HTTP requests:
|
1 2 3 4 5 |
# This query calculates the proportion of HTTP requests # that meet a latency SLO (e.g., responses under 0.5s) rate(http_request_duration_seconds_bucket{le="0.5", status!="500"}[5m]) / rate(http_request_duration_seconds_count[5m]) |
This burn rate query returns a ratio, specifically, the fraction of requests over the last 5 minutes that completed successfully (i.e., under 0.5s and not HTTP 500 errors).
Note on terminology: This query shows how close you are to meeting your SLO, not how much of your error budget has been “used up.” While the term “burn rate” is commonly used in SRE contexts, it’s important to understand that this isn’t a cumulative metric. It’s a real-time indicator of performance degradation — if the ratio drops consistently below your SLO target, then you start consuming your error budget.
Explanation of the Code Snippet
rate(http_request_duration_seconds_bucket{le="0.5", status!="500"}[5m]):
This line calculates the rate of HTTP requests over the last 5 minutes that completed in 0.5 seconds or less, excluding failed responses(status!="500").
The_bucketmetric comes from a Prometheus histogram, which tracks the cumulative count of observations that fall below a certain latency threshold (le="0.5"stands for “less than or equal to 0.5 seconds”).
This allows us to measure what portion of traffic is fast enough to meet the latency SLO.rate(http_request_duration_seconds_count[5m]):
This line calculates the total rate of all HTTP requests over the last 5 minutes, regardless of duration._countrepresents the total number of observations made by the histogram.- Dividing these two gives a proportion:
The percentage of requests that met the latency target in the last 5 minutes. If this ratio drops, it suggests that latency is increasing and the service is drifting away from its SLO target.
What’s the difference between _bucket and _count?
In Prometheus, _bucket is used to measure latency distributions by counting requests that are less than or equal to specific thresholds (e.g., 0.5s, 1s, 2s). _count tracks the total number of requests, so it acts as the denominator for calculating ratios or percentages.
Learn more about Prometheus histograms and SLOs:
Code Snippet 2: Git Tagging for Deployment Metadata
Incorporating deployment metadata into your observability stack helps teams correlate performance changes with specific deployments. One common technique is to tag commits in your Git repository at the point of deployment. This gives you a timestamped, versioned reference to when a specific codebase was shipped — which can later be visualized in tools like Grafana, Datadog, or Honeycomb.
Here’s a sample Git command used during deployment automation to create a timestamped tag:
|
1 2 3 4 5 6 |
# Create a Git tag that marks a deployment, using the current date and time. # The format avoids colons to ensure cross-platform compatibility. git tag -a deploy-app-$(date +%F-%H%M%S) -m "Deployment: version 1.2.3" # Push the tag to the remote repository so it can be used by observability tools. git push origin –tags |
Explanation of the Code Snippet
git tag -a deploy-$(date +%F-%H%M%S) -m "Deployment: version 1.2.3“: This creates a new Git tag for the deployment. The$(date +%F-%H%M%S)portion dynamically generates the current timestamp in the formatYYYY-MM-DD-HH:MM:SS, ensuring that each deployment is uniquely tagged by time. The -m flag adds a message (e.g., version 1.2.3) to the tag for easy identification.git push origin --tags: This command pushes the new tag to the remote Git repository, making it available for tracking in your CI/CD pipeline and observability tools.
Dashboards and Visibility
A unified dashboard strategy is key to improving cross-team visibility and accountability. Rather than having separate DevOps and SRE dashboards, it’s more effective to consolidate them into a single, cohesive observability pane. This gives everyone, from engineers to management, a shared, real-time view of system health and performance trends. A well-structured dashboard should include:
- Real-time deployment metrics: This shows how frequently code is deployed, how quickly it’s deployed, and its impact on system stability.
- SLA/SLO adherence charts: These charts track the adherence to Service Level Agreements (SLAs) and Service Level Objectives (SLOs), giving teams visibility into how close they are to meeting reliability goals.
- Error budget usage trends: Monitoring the rate at which your error budget is being consumed helps you understand how much room you have left for failures before violating your reliability commitments.
- Alerts on critical regressions: When performance dips or reliability issues occur, these alerts highlight critical regressions in real-time
Many teams use tools like Grafana to build and maintain unified observability dashboards.
Why Grafana?
Grafana is an excellent choice for building unified observability dashboards. It’s highly customizable and supports:
- Templating: This allows you to create dynamic dashboards where users can select specific services, regions, or time periods for the displayed data.
- Multiple data sources: Grafana can pull data from a variety of sources, including Prometheus, Elasticsearch, and others, making it easy to integrate metrics across various systems.
- Alert routing: Grafana allows you to configure alerts based on specific thresholds and route them to tools like Slack, PagerDuty, or email to notify the team.
For enhanced collaboration, share these dashboards in Slack incident channels so that the team is immediately aware of any issues. You can also rotate ownership weekly to ensure that all team members stay familiar with the health of the system. Standups and retrospectives are great opportunities to review these dashboards, discuss any problems, and make improvements.
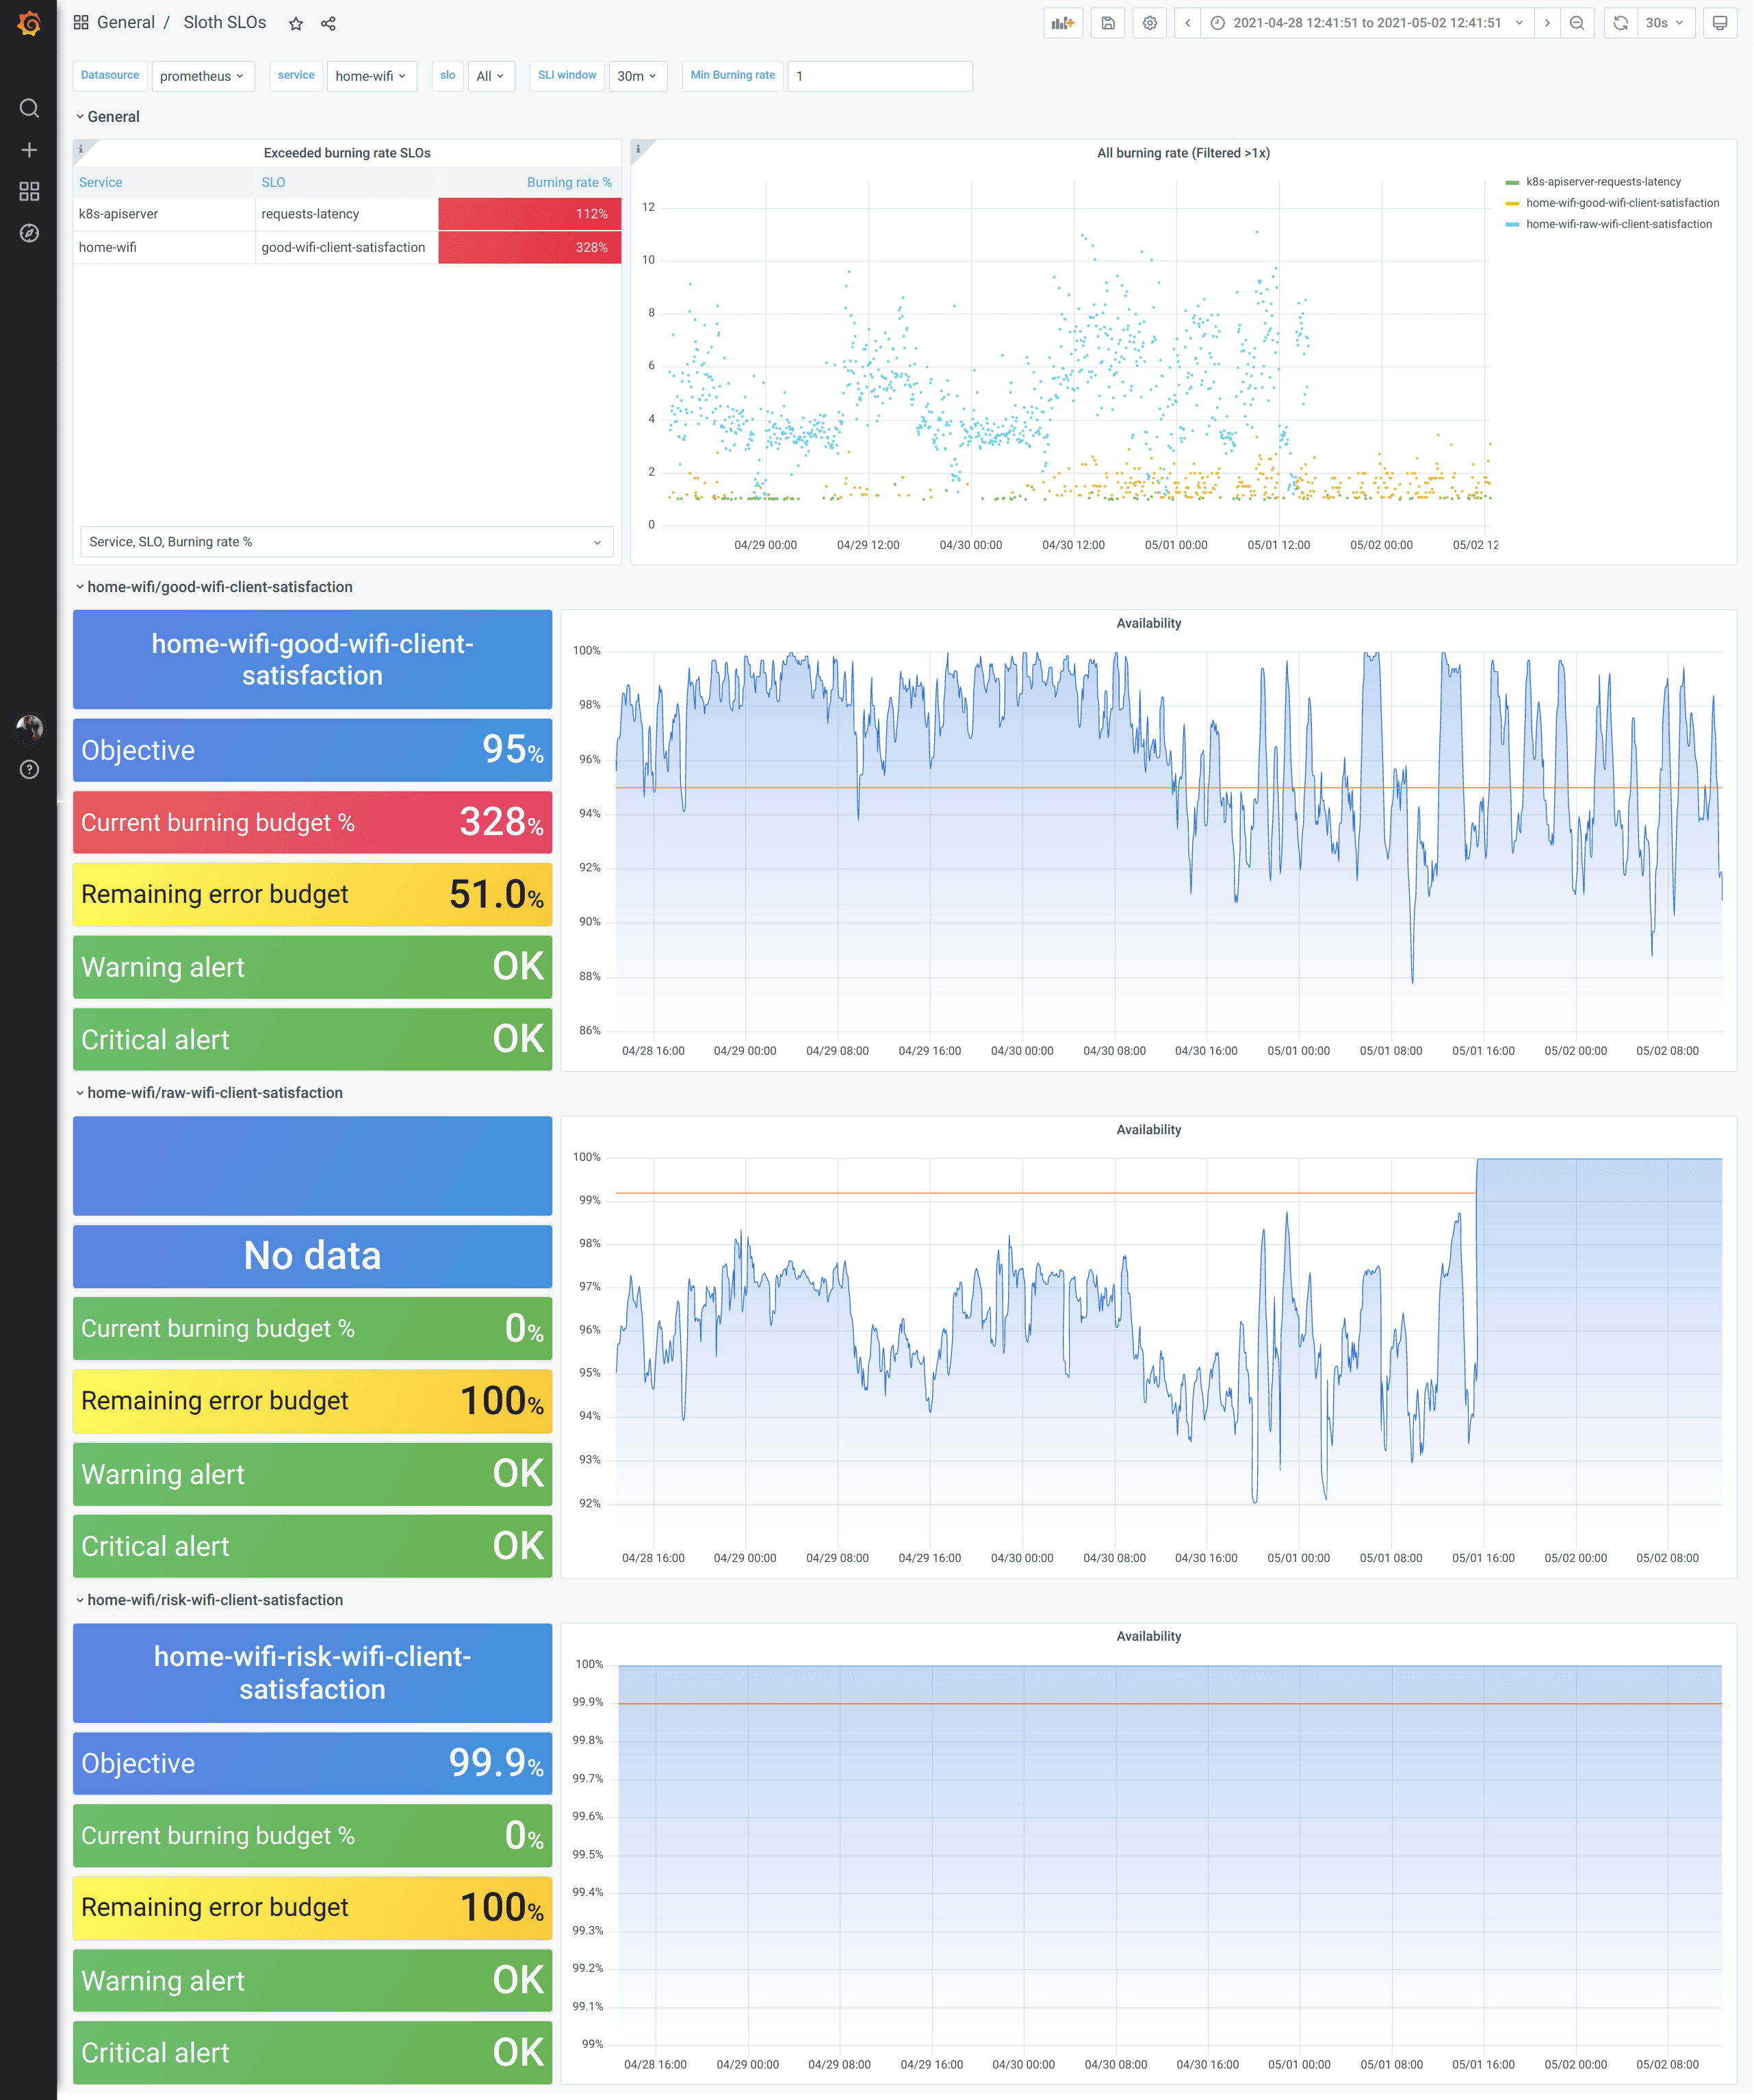
Example: Grafana Dashboard Panel for Error Budget Tracking
Here’s an example of how you might visualize error budget remaining in Grafana using a gauge panel. While Grafana dashboards can be exported or configured using JSON, most teams use the web-based UI to build them interactively.
This JSON configuration defines a gauge panel:
|
1 2 3 4 5 6 7 8 9 10 |
{ "type": "gauge", "title": "Error Budget Remaining", "targets": [ { "expr": "100 - (slo_burn_rate * 100)", "refId": "A" } ] } |
Explanation of the Code Snippet
type: "gauge":This specifies that the panel is a gauge, which visually represents the remaining error budget as a percentage. A gauge is particularly useful for tracking real-time metrics, as it provides a clear indication of how much room you have before reaching the error budget threshold.title: "Error Budget Remaining": This sets the title of the panel to indicate that it’s tracking how much of the error budget is still available.targets:This section defines the query that fetches the data. Theexprfield contains the Prometheus query for calculating the error budget remaining:100 - (slo_burn_rate * 100):slo_burn_rate:This variable represents the rate at which the error budget is being consumed. A burn rate higher than expected means the service is nearing failure or downtime.
100 - (slo_burn_rate * 100):This calculation subtracts the burn rate from 100 to determine how much error budget remains. A value of 0 means the error budget is completely burned, and no further issues can be tolerated.refId: This is a unique identifier for the query target, allowing Grafana to differentiate between multiple data sources or metrics.
What this does:
The panel calculates the remaining error budget by subtracting the current SLO burn rate from 100. For instance, if your burn rate is 0.25 (25%), this panel would display 75% error budget remaining.
How to use it in practice:
In Grafana’s UI, you would:
- Go to your dashboard.
- Add a new panel → select Gauge as the visualization type.
- Under metrics, paste the PromQL expression: 100 – (
slo_burn_rate * 100) - Customize the title and thresholds as needed.
This configuration is useful when paired with alert thresholds — for example, triggering a warning when the remaining error budget drops below 50%, or a critical alert below 10%.
See Grafana’s panel editor in action:
|
1 |
<img src="https://www.red-gate.com/simple-talk/wp-content/uploads/2025/06/word-image-107018-2.png" class="wp-image-107020">25)* |
Common Pitfalls and How to Avoid Them
Even with the best intentions, teams often stumble when merging DevOps and SRE. Understanding common failure modes can help you avoid them.
Silos Reappearing
Ironically, merging DevOps and SRE can recreate old boundaries. DevOps teams focus on deployment, while SREs chase uptime.
Solution
Co-author quarterly roadmaps and OKRs that align business velocity with error budget policies. For example:
- Q2 Objective: Launch 10 new features with <5% SLO budget consumption
- Q3 Objective: Reduce time-to-detect incidents by 30% while maintaining weekly releases
Create shared quarterly reliability objectives across squads.
Example:
- Shared OKR: “Launch 15 features with <5% increase in error rate”
- Shared incident channel: #incident-sre-devops
Tooling Overload
More tools ≠ better outcomes. Fragmented platforms lead to unclear ownership, duplicated effort, and increased maintenance overhead.
Solution
Standardize around a minimal, interoperable toolchain. Ideally, one that’s used consistently across DevOps, SRE, and development teams.
For database automation, use a tool like Flyway (or Liquibase). Flyway supports version-controlled schema migrations, integrates smoothly with CI/CD pipelines, and is simple enough for both developers and DBAs to adopt.
Assign clear owners for each tool in your stack and document internal usage guidelines. This ensures teams know how tools should be used, prevents duplication, and reduces context-switching overhead. A shared, consistent toolset empowers collaboration and makes system behavior more predictable at scale.
Maintain a single, easily accessible tool-ownership.md file (a Markdown file typically stored in your internal documentation repo) that lists each major tool in your engineering stack, along with its primary and backup owners. This helps prevent confusion, ensures continuity during PTO or turnover, and improves accountability for tooling decisions.
For example:
Tool | Primary Owner | Backup Owner |
Flyway | DBA Team | Platform Eng |
Grafana | SRE Team | DevOps Team |
Prometheus | Observability | SRE Team |
Jenkins | DevOps Team | Platform Eng |
Tip: This file should be part of your internal engineering handbook or runbook, preferably version-controlled (e.g., in GitHub or GitLab), and linked from your developer portal or team wiki. Make it easy for anyone to find out who to contact for tooling questions or issues.
Not Defining Toil or SLIs Clearly
When toil is untracked, the monotonous nature of the work can cause people to silently (and sometimes not so silently) burn out. Toil refers to manual, predictable tasks that are operational but don’t contribute to long-term system improvements, such as restarting stuck services, manually pushing builds, or cleaning up logs.
These activities may seem minor in isolation, but over time, they consume team capacity, create frustration, and distract from higher-value work like automation, optimization, or feature delivery. Similarly, when SLIs (Service Level Indicators) are vague or poorly defined, they fail to reflect what matters to end users. This leads to misaligned priorities and missed reliability goals.
Solution
Quantify toil and set goals to reduce it.
Examples:
- Reduce manual data restores by 80% in 2 months
- Automate 100% of schema validation by end of Q1
Also, align SLIs with user experience:
- API response time <200ms (95th percentile)
- Query failure rate <0.5% over rolling 7-day window
- DB Migration success rate > 99.95%
- API Latency p95 < 400ms
Track toil using Jira/Linear with a custom label toil and query reports monthly:
|
1 |
jira search "labels = toil AND updated >= -30d" |
Wrapping Up: Working with DevOps and SRE
DevOps and SRE are not mutually exclusive. Together, they represent the next evolution of software engineering. They combine speed with safety, autonomy with accountability, and agility with observability.
The successful integration of DevOps and SRE requires more than adopting tools or changing titles. It’s a holistic effort that spans cultural transformation, shared metrics, and thoughtful tooling. Redgate Flyway exemplifies how a tool can operationalize this integration. It brings automation, versioning, and reliability to a traditionally opaque part of the stack: the database.
Organizations that implement this fusion not only ship faster but also build systems that withstand change. They align their teams on shared goals, empower them with reliable tools, and create feedback loops that continuously improve delivery and operations.
When you bridge the gap between DevOps and SRE, you’re not choosing between delivery velocity and reliability, you’re choosing both. And in doing so, you’re building the kind of resilient, scalable, and responsive systems that define modern software excellence.


Load comments