
“We now get through
the full 9 million rows
in 2-3 days –
at least 5 times faster!”
As part of our company’s business intelligence, marketing effectiveness platform (including a high-scale contact relationship management application) is a system which uses SSIS (among other things) to extract, transform and load huge amounts of data from a wide range of different sources. Once it’s all in a central SQL Server database, a background C# batch processing application works through the data using highly complex grouping and clustering algorithms to analyze and make the data consistent. Somewhat similar to SSIS fuzzy grouping but we had extra considerations and needed more control on the process.
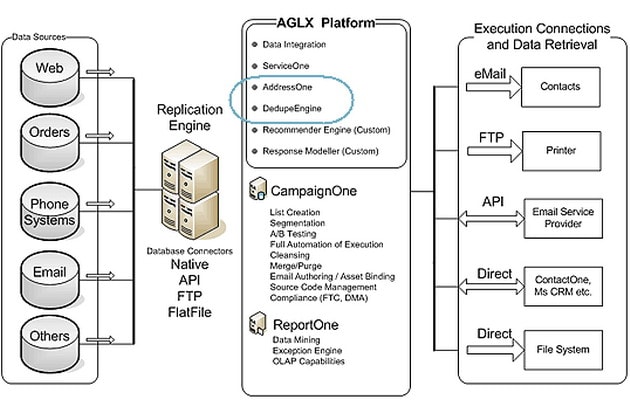
Agilone AGLX platform
When this was taking weeks rather than days we knew we had a problem and that was when I got more involved in the project. It’s fine if this task takes up to a week to process all the data (currently around 9 million rows for example in one of our clients), but it was now taking this long to process less than half the data!
Bringing in a profiler
I initially started inserting timing code throughout the code, but this is obviously very tedious, and can be inaccurate. Worse, you depend on guesswork to work out where to effectively insert code. I quickly realized I needed proper non-intrusive profiling.
A quick Google search showed up a shortlist: dotTrace from JetBrains and ANTS Profiler from Red Gate. Although I love JetBrains’ Resharper, I found ANTS Profiler was more usable at taking me down to which methods and which lines were taking the time plus being able to look at those lines in the same window. That is without going back and forth from Visual Studio
The analysis proved to be an incremental process. Each time, I would work down from the method level timing and find the top bottleneck. At first, the bottlenecks turned out to be data access, so I used SQL Profiler and Database Tuning Advisor to work out the necessary DB and query changes.
5X performance gains (or more)
This still left performance problems in the C# code itself. Assuming that the quickest way to get a major improvement was to change the core algorithms, I tried rewriting some of the fuzzy grouping algorithms – this made the code a lot more complicated, but turned out to make almost no improvement to performance. As ever, before you optimize, always measure. So I reverted the code, and went back to ANTS Profiler again.
Surprisingly, some of the major problems turned out to be the simple things – regexp and String performance, and basic collection types. A couple of changes in the string handling*, and using hashtables instead of lists (Hashtable is faster than SortedDictionary, SortedList or List), and we now get through the full 9 million rows in 2-3 days – at least 5 times faster!
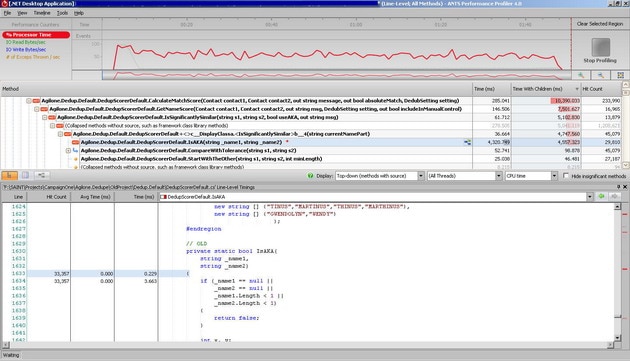
ANTS Profiler results before optimization.
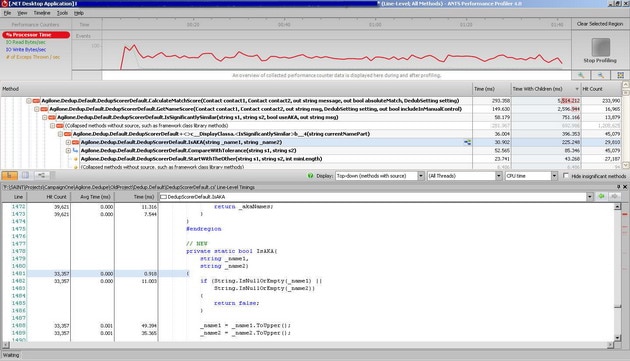
ANTS Profiler results after optimization.
Lessons learned
In retrospect, the lessons are fairly obvious:
-
Use a profiler to measure before you optimize – it really sucks trying to optimize something only to find out that it is not the bottleneck.
-
Use the appropriate DB tuning tools.
-
Keep measuring – it can be the simple things that are causing the problem.
* <string>.SubString(...) does some considerable lifting, so if you want to check if the first two chars in a string are equal to some other string then you should consider using <string>.StartsWith instead or avoid the SubString if you can.
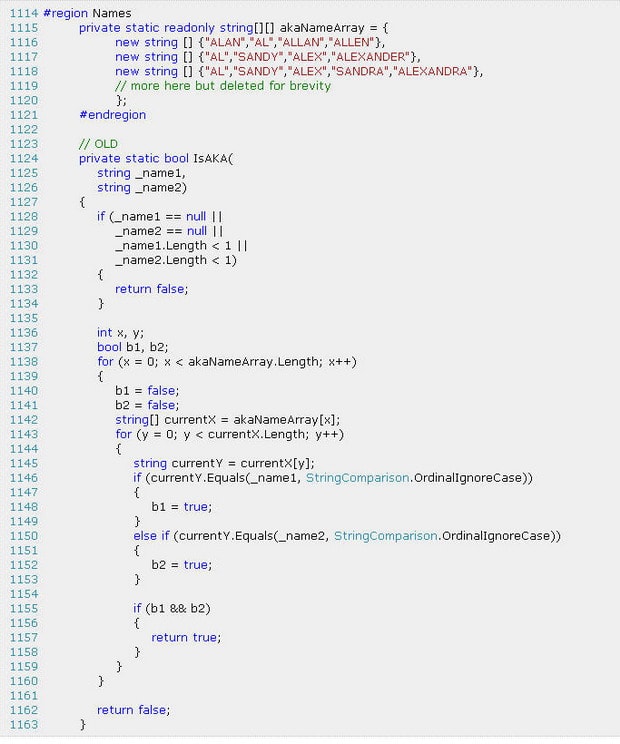
Code before optimization.
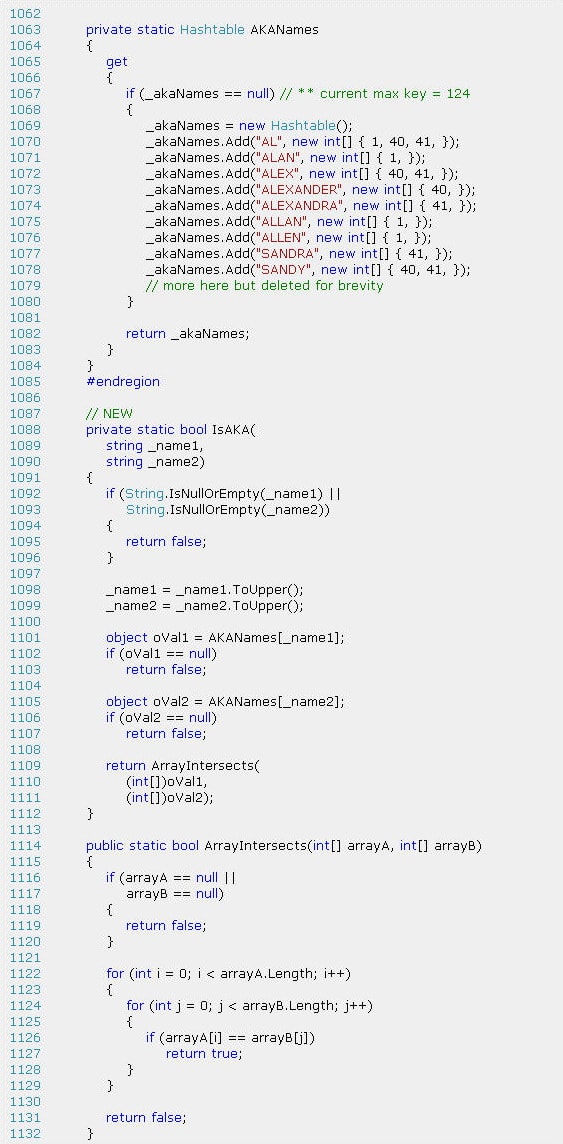
Code after optimization.
Note: Although it is generally not recommended to place a dictionary as hard-coded values, the stakeholders in this project have specific reasons for doing so.
Also profiler screenshots provided was made only against a subset of the data.
This document contains proprietary information and is protected by copyright law.
Copyright © 2026 Red Gate Software Limited. All rights reserved
Load comments