
Quantifying the Relationship between Website Download Time and Abandonment by Users
High level summary
Website performance testing tools give results that are very subjective to interpret.
Users begin to abandon websites if they have to wait more than 5 seconds for a page to download.
Users begin to become frustrated if they have to wait more than one second for a page to download.
Introduction
Web application monitoring and load testing tools measurements provide a considerable volume of information related to the time it takes for pages to download, as a way of gauging the performance of the web application. This is because it is generally accepted that the time it takes pages to download is an important feature to web users. However there are no quantitative data that allow web application owners to understand whether their web applications page download performance is good or bad. The business impact of varying page download time has not, until now, been defined. This paper seeks to provide data that allows website owners to understand the business impact of their web application performance.
Research in User Perception of Website Performance
A small number of reports have made statements and or attempted measurements about the relationship between page download times and the users’ emotional reaction. In a number that has been widely quoted, Nielsen reported that “if a web page takes longer than 10 seconds to download then a user is likely to lose interest”. However there is no experimental nor statistical derivation for the figure of 10 seconds – indeed it appears to be plucked from the air. In 1999 more detailed experiments were reported that made measurements of frustration, ‘lostness*’ and how difficult users found tasks in applications with varying download times. Financial inducements were given to people undertaking the tasks, and the download times were 1, 30 and 60 seconds. These results showed that longer download times had no influence on the perception of task difficulty and ‘lostness’. Frustration was measured as being very slightly influenced by time but only if the download time was greater than 30 seconds. Other reviews in the literature also present results that show that users do not care about page download times. We find these results to be extremely surprising and contradictory to our own impressions of web applications – where we feel that download times play an important part in the levels of frustration experienced by ourselves and the majority of website users. We believe that the financial inducements, the poorly-chosen time intervals and the complexity of the experiments masked the effects of long download times in the studies reviewed. In addition, web user behavior responses to download times are highly likely to have changed over the last 4 years.
In order to investigate this discrepancy we have conducted an online survey that produces definite answers to the question of page download time and the users’ satisfaction.
* Lostness equals the number of page visits required to complete a task (optimal path) divided by the number of pages visited. 1.0 means the user was not lost at all. There is no upper limit!Methodology
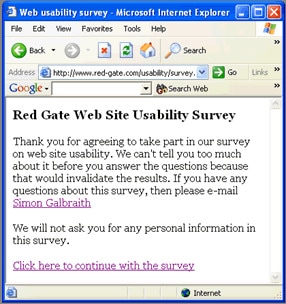
In page 1 we told people a little bit about the survey.
After they clicked “Continue”, they were made to wait for a random length of time between 0-30 seconds. We kept a connection open so that we could tell if people abandoned the survey or hit Refresh.
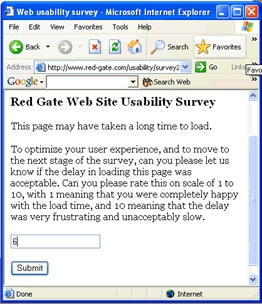
If they got through to this page we asked them to tell us how frustrating they had found the wait.
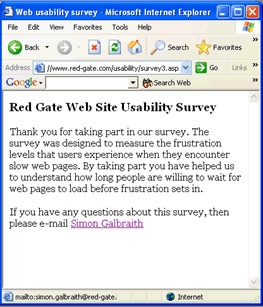
This screen was shown to people who gave us their frustration rating.
This allowed us to make the following measurements:
- The delay to get the second page (of those who waited that long).
- The time it takes until users use the Refresh or Reload button on their browser (of those who did so).
- The time it takes for the user to abandon the survey altogether (of those who did so).
- Those users who had waited for the next page then recorded, on a scale of 1 to 10, how frustrating they had found the wait.
The aim is to allow us to make the following correlations:
- The relationship between page loading time and perceived frustration.
- The relationship between page loading time and abandoning the site.
- The relationship between page loading time and the pressing the Refresh button.
Reasons behind this approach
We reduced the number of variables that could influence the results to one – the page download time. We told respondents as little as possible about the survey so that they responded as they would do to any slow page. We offered no financial inducements to make people wait for information. And we made the task extremely simple – filling in one number. We asked people for no personal data so that they wouldn’t feel they were part of a marketing scam. In taking this approach we aimed to avoid the multiple variables that have made previous attempts to examine this issue hard to interpret.
In addition to these measurements we also measured:
The IP address of the user. The time and date. The browser type. The operating system of the user’s computer.
These were used to ensure that the data was consistent. For example it helped us know if the same person had filled in the survey multiple times.
Results
At the time of writing there were 63 respondents to the survey. Although this number is relatively small it is slightly more than the numbers involved in previous studies. The cost of getting more users would be relatively small.
|
Time interval(s) |
Average frustration |
Number of given answers |
Number of abandonments |
% of sample in interval who abandon |
|
0-1 |
1.0 |
1 |
1 |
50% |
|
1-5 |
2.6 |
11 |
1 |
8% |
|
6-15 |
4.7 |
13 |
9 |
41% |
|
15-30 |
6.4 |
16 |
9 |
36% |
Table 1. The average recorded frustration level against different time intervals and other data from the survey.
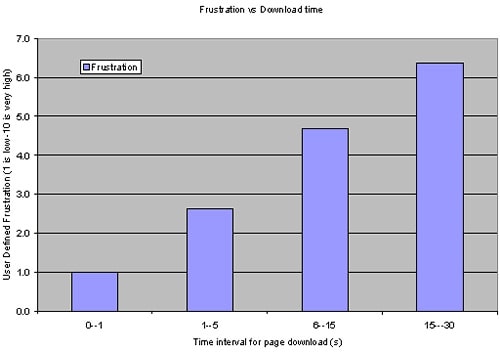
Figure 2. A plot of the user recorded frustration vs. the page download time.
The percentage that abandons or refreshes before filling in the second part of the survey is 35%. One individual abandoned after less than one second – this skews the results in the very first interval due to the small sample size.
The frustration of those people who abandon is not recorded but we can surely assume it is higher than those who waited. If we were to assume that the frustration of someone who abandoned the website was 10, then the frustration induced by slow-loading pages would be recorded even higher.
Analysis of website induced frustration
This survey gives a clear indication that frustration develops after a second or so of waiting. If a user is required to wait between 5 and 15 seconds there is a significant chance that a user will abandon a website rather than wait for the information. Any wait beyond that is highly likely to cause the user to abandon the site.
The frustration of those people who abandon is not recorded but we can assume that someone who abandons a website is higher than someone who waits. If we were to assume that the frustration of someone who abandoned the website was 10 – then the frustration induced by slow-loading pages would be recorded even higher.
Conclusions
By isolating the many variables found in previous studies and concentrating on examining carefully just the effects of download times we have managed a breakthrough in understanding of the effects of web download times on user satisfaction.
The frustration due to page download times of web application users has been shown to be rapidly rising after a wait of around a second. After 5 seconds wait, significant numbers of users feel sufficiently frustrated to abandon a site rather than wait for the information.
Further Work
A greater number of respondents in this survey would give us additional confidence in the conclusions.
One piece of work that would be of great interest to many website owners would be to test the widely-held belief that frustration and abandonment depend on the type of site being visited. It is often said that bank users are less likely to be frustrated than normal surfers.
Another area where this would be interesting would be to assess whether commonly used devices indicating that something is happening (such as a scrolling bar) make people more patient and/or less frustrated.
Finally, we thank all respondents, frustrated or otherwise, for their contribution to the survey.
Red Gate’s load testing tool, ANTS Load, allows companies to measure the abandonment prediction and Red Gate’s frustration index of their website. A free trial is available.
References
1. Nielsen, J. (1996) Top ten mistakes in web design. Alertbox, http://www.useit.com.
2. Selvidge P. (1999). How Long is Too Long to Wait for a Website to Load? Usability News 1999 1.2.
3. Lee A.T. Web Usability: A Review of the Research. ACM SIGCHI Bulletin, PAPERS, 31(1), pp. 38-40, 1999
This document contains proprietary information and is protected by copyright law.
Copyright © 2026 Red Gate Software Limited. All rights reserved

Load comments