
Note (2016.12.01):
Exactly six years later almost all the information in this article is still good–not an easy feat with the pace of software change! But now there is more to say, so I have written a sequel to this article expounding upon the capabilities of a powerful new LINQ debugging extension for Visual Studio. You might want to continue reading this article first though, to get a good grounding (you know, walk before you can run). Then go read LINQ Debugging and Visualization.
Contents
This article is for .NET developers who have not used LINQ, LINQ users who have not used LINQPad, and LINQPad users who have not used LINQPad Visualizer. (Some familiarity with LINQ is assumed though.) I take you beyond the basic concept of a LINQ query and reveal the simple techniques for creating LINQ chains, softly introducing the notion with analogous ideas in Unix and in .NET programming in general. As soon as you think about chaining, though, you have to be concerned about how to keep the “stuff” in the middle accessible, to keep it from becoming an opaque black box. I show you how to do this both in Visual Studio with a simple extension method and in LINQPad with its powerful Dump method. The accompanying code archive[1] lets you experiment with everything discussed as you read along.
Pipelines and Method Chaining
The Unix Origins: Command Pipelining
The concept of a software pipeline is not a C# innovation. In fact, it is not new at all. It is not even recent. Pipelines appeared in 1972 in Unix, following on Douglas McIlroy’s 1964 proposal. This example of a Unix pipeline (from the Wikipedia entry on pipelines) implements a simplistic, command-line spellchecker on Unix/Linux systems. This pipeline runs 7 independent applications. Each application ties its output to the input of the next application using the pipe (|) symbol. To tie the whole package together, the first application, curl, obtains its input from the web page supplied as an argument. The last application, less, feeds its output to the console where the user may view it. (The steps in between massage the data to identify, isolate, and sort individual words, then compare them to a reference dictionary.)
|
1 2 3 4 5 6 7 |
curl "http://en.wikipedia.org/wiki/Pipeline_(Unix)" | \ sed 's/[^a-zA-Z ]/ /g' | \ tr 'A-Z ' 'a-z\n' | \ grep '[a-z]' | \ sort -u | \ comm -23 - /usr/share/dict/words | \ less |
.NET Equivalent: Method Chaining
Fast forward and shift to the .NET environment. This next example illustrates method chaining, the code-level equivalent of application pipelining. You have almost certainly used method chaining but may not have seen the term before. Here you start with a whimsical string, swap parts, shrink it, chop it up, and finally write out its pieces. (This code is available in the StringMethodChaining project of the ChainingAndDebugging solution (VS2010) in the accompanying code archive.)
|
1 2 3 4 5 6 7 8 9 10 11 12 13 14 15 16 17 18 19 20 |
using System; using System.Linq; namespace StringMethodChaining { class Program { static void Main(string[] args) { "aardvarks AND antelopes AND hippopotami" .Replace("antelopes", "centipedes") .Substring("aardvarks".Length) .ToLower() .Trim() .Split(new[] {"and"}, StringSplitOptions.None) .ToList() .ForEach(item => Console.WriteLine(item.Trim())); Console.ReadLine(); } } } |
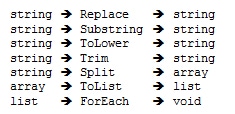
The basic principle to observe from these cosmetically different examples is the same: connect building blocks together where the output type of one corresponds to the input type of the next. In the Unix/Linux case, command line applications typically use a text stream for input and generate a text stream for output. This allows you to connect any two components together. The C# case is rather more complicated on the surface because there is no “universal” input/output format. Rather you are free to define methods with arbitrary types for input and output to suit your needs. To create a pipeline, then, it is a simple matter of impedance matching[2]. Here are the methods used, explicitly showing their inputs and outputs. Note how the output of each method in the chain matches the input requirement of the next method:
Note that you could write the same code without chaining, by introducing a slew of temporary variables.
|
1 2 3 4 5 6 7 8 9 |
string s1 = "aardvarks AND antelopes AND hippopotami"; string s2 = s1.Replace("antelopes", "centipedes"); string s3 = s2.Substring("aardvarks".Length); string s4 = s3.ToLower(); string s5 = s4.Trim(); string[] strings = s5.Split(new[] { "and" }, StringSplitOptions.None); List<string> list = strings.ToList(); list.ForEach(item => Console.WriteLine(item.Trim())); Console.ReadLine(); |
This code does the same thing but takes significantly more effort to comprehend. The previous code you could likely understand almost with a glance. Here, you have to stare at it for a bit. So is method chaining always better? Actually, no. If you want to debug this code and view an intermediate value, you cannot do it with pure method chaining. If you set a breakpoint and then execute, Figure 1 shows what you see when you land on the breakpoint.
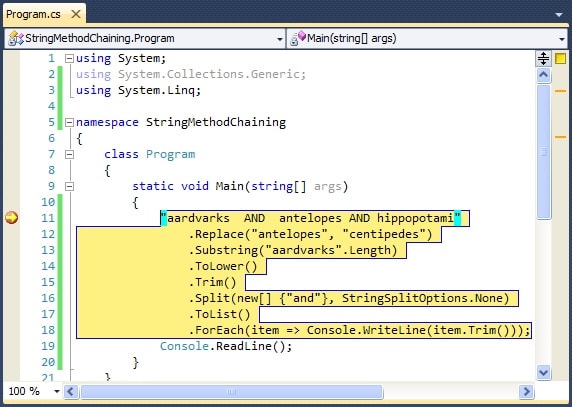
Figure 1 Breakpoint on a Method Chain
The entire chain is considered an indivisible unit! That is because, well, it is. Remember that Visual Studio breaks on statements and any single method in the chain is not a statement in and of itself. From this breakpoint if you use the step over command, you advance to line 19, the Console.ReadLine. However, if you instead use the step into command, you advance to the Console.WriteLine on line 18, because though deeply embedded, Console.WriteLine is a full-fledged statement. Unfortunately, if you need to see any intermediate value other than item in that line, you have to rewrite the code to introduce separate statements with temporary variables.
The principled, high-minded designer in you is, I am sure, repulsed by such an unsatisfactory kludge. Fear not, for there is a better way. But first, take a look at method chaining as it applies to LINQ.
.NET Pipelines with LINQ
The vast majority of articles on LINQ[3] introduce it with a simple query like this:
|
1 2 3 4 |
int[] numbers = { 5, 4, 1, 3, 9, 8, 6, 7, 2, 0 }; var lowNums = from n in numbers where n < 5 select n; |
They explain that you specify your data source with a from clause, filter it with a where clause, and project it to the desired result with a select clause. They then go on to show how to use that query typically with a foreach loop like this:
|
1 2 3 4 |
Console.WriteLine("Numbers < 5:"); foreach (var x in lowNums) { Console.WriteLine(x); } |
Even articles discussing more advanced LINQ methods typically exhibit a simple example, which is fine and necessary, but almost always stop after proclaiming that you conclude your LINQ expression with a Select or GroupBy. Even the useful and venerable 101 LINQ Samples page from Microsoft shows only the simplest examples, yielding no clue about method chaining.
LINQ Queries may appear in one of two forms; the query above is written using query syntax. The next example uses method syntax (also called lambda syntax). The two forms are exactly equivalent (where they overlap), and performance is also exactly the same because, during compilation, query syntax expressions are converted to lambda syntax internally. However, the lambda syntax is richer, particularly in C#[4].
When it comes to method chaining, I prefer to use lambda syntax. This next example uses it to illustrate a real-world LINQ example. This code comes straight out of the HostSwitcher application that I built and discussed at length in my recent article, Creating Tray Applications in .NET: A Practical Guide. HostSwitcher lets you re-route entries in your hosts file with a single click on the context menu attached to the icon in the system tray. The application is heavily LINQ-centric. One key portion of code takes your hosts file (read into an array) and uses LINQ to convert it to a dictionary that is later consumed by other segments of the code to generate a context menu among other uses. The CreateMap method generates the projectDict dictionary:
|
1 2 3 4 5 6 7 8 9 10 11 12 13 14 15 16 17 18 19 20 21 22 23 24 25 26 |
private void CreateMap() { projectDict = hostFileData .Select(line => new { line, m = FilteringRegex.Match(line) }) .Where(item => item.m.Success) .Select(item => new { item.line, item.m, project = item.m.Groups[ProjectSubGroupIndex].ToString().Trim(), serverGroup = item.m.Groups[ServerGroupSubGroupIndex].ToString().Trim() }) .GroupBy(item => new { item.project, item.serverGroup }, item => item.line) .GroupBy(projAndServer => projAndServer.Key.project) .ToDictionary( project => project.Key, project => project.Select(item => new ServerGroup { Name = item.Key.serverGroup, EnabledCount = item.Where(line => !IsCommented(line)).Count(), DisabledCount = item.Where(line => IsCommented(line)).Count() } ) ); } |
To understand method chaining with LINQ, consider the inputs and outputs of the LINQ methods in the above chain:
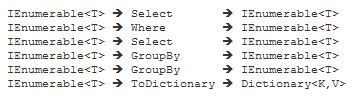
Observe that LINQ has a great affinity for IEnumerable<T> objects; many LINQ methods fit this footprint:

Therefore, LINQ naturally lends itself to method chaining! Kris Thompson’s blog contains a great reference of LINQ operators, identifying the return values of each so you can see at a glance which ones lend themselves to LINQ chaining. Many of them-with IEnumerable<T> as both input and output-may be used at any position in a chain. But since all (?almost all) LINQ operators use IEnumerable<T> as input, all of them may be used at the end of the chain[5].
Breakpoints in a LINQ Chain
The final point here is that LINQ method chaining is different than normal method chaining with respect to stepping in the debugger. Though the entire chain is marked with a single breakpoint, once you reach the breakpoint you can step through a LINQ query. Figure 2 shows the scenario after having pressed the step over button a number of times. At that point, you can inspect local variables as on any breakpoint with the Immediate window, tooltips, etc. It is not that the methods are special in any sense as compared to the string methods you saw earlier. Rather, it is the method arguments that are different. A LINQ method typically takes a lambda expression, which is an anonymous function composed of expressions and statements. Thus, you may step onto these statements with the debugger as well.
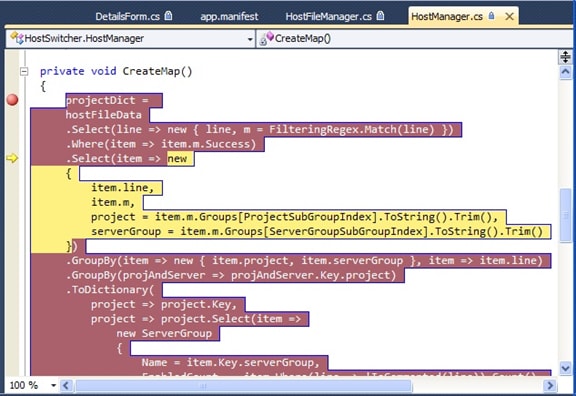
Figure 2 Breakpoint on a LINQ Chain
Actually setting breakpoints on parts of the LINQ chain, however, is quirky. If you use the shortcut key (F9) pressing it once sets a breakpoint on the entire chain. Pressing it again, removes it. Repeat ad infinitum. If, instead you use the mouse to set a breakpoint by clicking on the grey channel at the left edge of the window the first click will perform the same (setting a breakpoint on the entire chain) independent of which line in the chain your mouse is adjacent to. I find, though, that if I stubbornly click in the channel adjacent to different lines within the chain I can sometimes get a breakpoint to stick.
Thus far you have seen how attempts at debugging method chains are useful to a degree, but still unsatisfactory. The next section shows you some powerful remedies.
Debugging Unbound
Simple Debugging: Injecting a NOP
The first technique to allow setting breakpoints inside a LINQ method chain is to add a nop: a statement that does nothing, but a statement is what you need! In LINQ a nop consists of a lambda expression that performs an identity transformation, but you want it to use a statement rather than an expression, i.e. this:
|
1 |
z => { return z; } |
…rather than this:
|
1 |
z => z |
The other crucial factor is that the statement must be accessible to the debugger, i.e. it must be on a line by itself. Then you can set a reliable breakpoint, as shown in Figure 3.
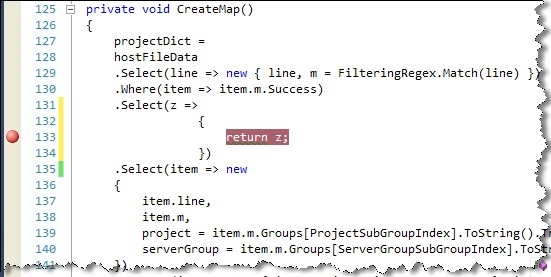
Figure 3 Adding Breakpoints with Embedded Statements
(Thanks to Eric White’s blog entry Debugging LINQ Queries for this tip.)
Advanced Debugging: Injecting a Watcher
In the previous section you learned to inject a simple inline expression. That worked because, being wrapped in a Select predicate, it still fits the classic LINQ signature:

That technique has its uses but to do anything non-trivial it is more useful to encapsulate a diagnostic routine into a separate package. To explore this avenue, consider this simple LINQ query to perform some trivial string operations. (The code in this section is available in the LinqMethodChaining project of the ChainingAndDebugging solution (VS2010) in the accompanying code archive.)
|
1 2 3 4 5 6 7 |
private static IEnumerable<string> ProcessWordList1(string[] words) { return words .Select(word => word.Trim()) .Select(word => word.ToLower()) .Where(word => word.StartsWith("k")) .OrderBy(word => word); } |
The input is this word list, which includes some different casings, some extraneous spaces, and is unordered.
|
1 |
static readonly string[] Words = new string[] {" KOOKABURRA", "Frogmouth", "kingfisher ", "loon", "merganser"}; |
The program to wrap around these pieces is just:
|
1 2 3 4 5 |
static void Main(string[] args) { var newWords = ProcessWordList1(Words); foreach (var word in newWords) { Console.WriteLine(word); } Console.ReadLine(); } |
The output from this is just these two birds: kingfisher followed by kookaburra. This example is deliberately simple but in the following discussion assume you have something more elaborate where the machinations it performs are non-obvious. To be able to examine the innards of the LINQ chain, create a new class to contain an extension method based on the Watch method in Bart De Smet’s informative article LINQ to Objects – Debugging. I have enhanced his extension method to support multiple colors instead of a single color, and to show invisible characters for illustration. (I have also chosen to rename it from Watch to Dump to be consistent with subsequent portions of this article.) Here is my version:
|
1 2 3 4 5 6 7 8 9 10 11 12 13 14 15 16 17 18 19 20 21 22 23 24 25 26 27 28 29 30 31 32 33 34 |
public static class EnumerableDebugger { public static ConsoleColor DefaultColor = ConsoleColor.Yellow; public static bool ShowWhiteSpace { get; set; } public static IEnumerable<T> Dump<T>(this IEnumerable<T> input) { return Dump(input, item => item != null ? item.ToString() : "(null)", DefaultColor); } public static IEnumerable<T> Dump<T>( this IEnumerable<T> input, ConsoleColor consoleColor) { return Dump(input, item => item != null ? item.ToString() : "(null)", consoleColor); } public static IEnumerable<T> Dump<T>( this IEnumerable<T> input, Func<T, string> toString, ConsoleColor consoleColor) { foreach (var item in input) { Console.ForegroundColor = consoleColor; Console.WriteLine( ShowWhiteSpace ? '[' + toString(item) + ']' : toString(item)); Console.ResetColor(); yield return item; } } } |
This extension method adds color-coded diagnostic output intermixed with your program’s normal output. More importantly, it performs an identity transformation on its input just like the previous nop technique: that is, it returns its input unchanged. Because of this, it is safe to inject this into the LINQ chain anywhere you like. Here is the method instrumented with Dump calls injected after every LINQ operation:
|
1 2 3 4 5 6 7 8 9 10 11 12 13 |
private static IEnumerable<string> ProcessWordList2(string[] words) { EnumerableDebugger.ShowWhiteSpace = true; return words .Dump() .Select(word => word.Trim()) .Dump() .Select(word => word.ToLower()) .Dump() .Where(word => word.StartsWith("k")) .Dump() .OrderBy(word => word) .Dump(); } |
The output of the program is shown in Figure 4, left side. You can distinguish the program output from the diagnostic output in yellow but it is impossible to distinguish the multiple occurrences in yellow. By specifying non-default arguments to Dump you can enhance the output. The final version of ProcessWordList below uses the same Dump extension method but this time supplies two arguments, one to label the step and one to colorize the step. This method yields the output in Figure 4, right side.
|
1 2 3 4 5 6 7 8 9 10 11 12 13 |
private static IEnumerable<string> ProcessWordList3(string[] words) { EnumerableDebugger.ShowWhiteSpace = true; return words .Dump(w => "ORIGINAL: " + w, ConsoleColor.Yellow) .Select(word => word.Trim()) .Dump(w => "TRIMMED: " + w, ConsoleColor.Yellow) .Select(word => word.ToLower()) .Dump(w => "LOWERCASE: " + w, ConsoleColor.Green) .Where(word => word.StartsWith("k")) .Dump(w => "FILTERED to 'K': " + w, ConsoleColor.Red) .OrderBy(word => word) .Dump(w => "SORTED: " + w, ConsoleColor.Blue); } |
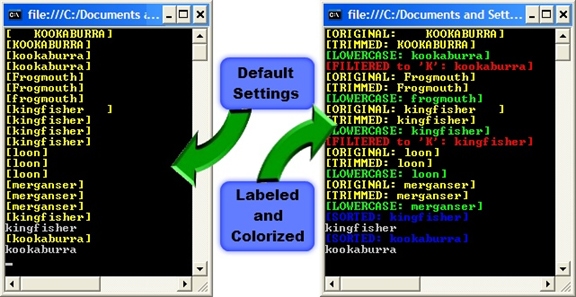
Figure 4 Output from Injecting the Dump Method
The labeled/color-coded output clearly communicates what step generates each line of output. It also reveals that LINQ really is a pipeline! Observe that the first word goes through the first 4 LINQ methods before the second word is even touched. The second word only survives the first 3 methods because it fails to make it through the filter looking for words starting with “k”. After all five words are processed by the first four steps, the remaining list-now just 2 words-is processed by the OrderBy method. OrderBy processes the whole list as a unit so it knows to wait for all the previous steps in the chain to complete. Notice that after OrderBy the data again flows in a pipeline from the final Dump call to the main program, which does a plain Console.WriteLine, because the blue Dump output is interleaved with the white standard output.
This injection technique is more powerful than the simple, inline approach given earlier. You could achieve a similar result by setting a breakpoint inside the Dump method, then manually examining values in the debugger. But this technique is particularly useful if you want to see a stream of output from a running program rather than stop at a breakpoint. It is also handy because you can compile in your injections and get diagnostic output without having to run inside Visual Studio. Also, by modifying the Dump method you can change your destination from the console to a log file for further analysis and post-processing. Finally, I encourage you to review DeSmet’s blog entry where he discusses further ways to extend the Dump / Watch method.
Dump Method in Visual Studio: Points to Take Away
- The Dump method is transparent to LINQ: its input passes through unchanged.
- You can instrument any step(s) in the LINQ chain you want to watch.
- You can observe the pipelining to debug interactions.
- You can dump simple values or complex objects because the Dump method lets you specify an arbitrary lambda expression.
- You can output derived values: for example, show not just each word but also its length-see the ProcessWordList4 method in the accompanying LinqMethodChaining project.
- Optional color coding and labeling let you clarify your output.
- To color code without labeling, use an identity lambda expression (x => x).
- To label without color coding, omit the color argument. (This uses the single DefaultColor, an exposed property.)
LINQPad: Visualizing Your Data
The techniques presented thus far give you useful and flexible capabilities for examining simple data. But when you want to examine complex objects you need the power of Joseph Albahari’s LINQPad. LINQPad is one of those rare applications that is elegant, powerful, and well-designed. As soon as you start using it you know it is “just right”. Remember back when you discovered the awesome power of Visual Studio; LINQPad is like that, too. (I have no affiliation with the application or its author. 🙂 LINQPad is a sandbox/IDE for .NET languages (C#, VB, SQL, F#) that lets you develop code without all the overhead of creating solutions and projects required in Visual Studio. I use it primarily for C# work though I have read some intriguing articles recently that some people use it to completely replace SQL Server Management Studio!
In the C# arena, LINQPad appears as if it converts C# from a compiled language to an interpreted language. You can just type in an expression and press Execute (F5). Change the language selector from C# Expression to C# Statements if you want to put a bit more code on the page, or to C# Program for full class support. So you can define classes if you need them but if you just want to try out a few isolated statements you can do that in an instant.
Besides the benefit of having a sandbox without the overhead, LINQPad includes powerful output visualization that is particularly useful with LINQ. (I guess that it was designed with this in mind-hence the name-but LINQPad should really be called something like .NET-Pad; it is not at all restricted to just LINQ.) The data visualization of LINQPad is outstanding, but learning how to use it takes exactly one sentence:
Append .Dump( ) or .Dump(“your title string“) to the end of something you want to examine.
That is it. Period. Honest. The remainder of this article just shows you some tips on how to gain the most leverage from that method call.
Basic LINQPad
As an introduction, I start with an illustration of two examples, borrowed from my previous article Using Three Flavors of LINQ to Populate a TreeView.
First the data:
|
1 |
string[] names = { "Burke", "Connor", "Frank", "Everett", "Albert", "George", "Harris", "David" }; |
Here is the most basic of LINQ queries; the output is a sorted list of elements, where each element is just an item from the names array. The result is fed to the Dump method and the output appears in Figure 5, left side:
|
1 |
(from item in names orderby item select item).Dump(); |
The second example builds on this with query continuation. The output is, again, a list of elements, but here each element is a more complex structure, containing a length and a collection of zero or more names (Figure 5, right side):
|
1 2 3 4 5 |
var query = from item in names orderby item group item by item.Length into lengthGroups orderby lengthGroups.Key descending select lengthGroups; query.Dump(); |
This query effectively creates a two-level structure. The select clause-the final clause in the LINQ query-defines the top level (the lengthGroups). Working backwards through the query, at the second level, the lengthGroup elements are sorted by the length of each collected group in descending order. This second level (defined by the group…by) fills each lengthGroup with individual names, and the names within each lengthGroup are sorted in ascending order (the default on the first orderby clause).
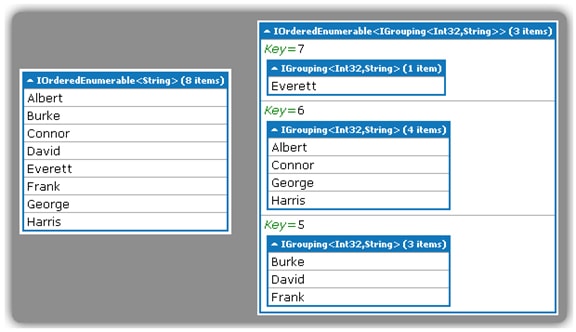
Figure 5 Output from LINQPad’s Dump Method
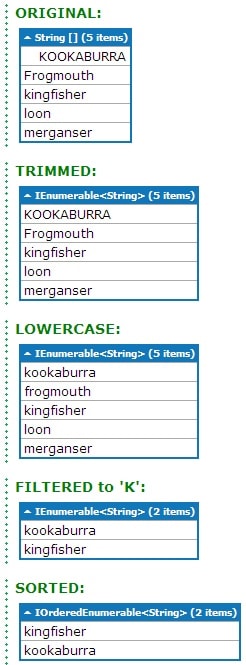
Figure 6: Successive LINQpad Output
from a method chain
LINQPad with Method Chaining
Dumping the output of a query is certainly useful. But it becomes significantly better still if you can peek inside the LINQ chain, just as you saw earlier with the ProcessWordList2 and ProcessWordList3 methods. Recall that those used a custom Dump method in Visual Studio that was specifically designed as a pass-through method.
I have not seen it documented anywhere, but I thought that the LINQPad Dump method must surely be as well-designed as that, too! Here is the bird example shown earlier tailored for LINQPad. Paste this code fragment into a LINQPad buffer, set the language to C# Statements, and execute it.
|
1 2 3 4 5 6 7 8 9 10 11 |
string[] Words = new string[] {" KOOKABURRA", "Frogmouth", "kingfisher ", "loon", "merganser"}; Words .Dump("ORIGINAL:") .Select(word => word.Trim()) .Dump("TRIMMED:") .Select(word => word.ToLower()) .Dump("LOWERCASE:") .Where(word => word.StartsWith("k")) .Dump("FILTERED to 'K':") .OrderBy(word => word) .Dump("SORTED:"); |
Figure 6 displays the result: a series of lists presented in a way that is instantly comprehensible. You see each step of the LINQ chain and can watch as each transformation occurs. The LINQPad Dump method is indeed transparent, returning its input unchanged to the next step in the chain!
This Dump method has a different signature than the custom Dump method presented earlier for Visual Studio use. The earlier one had two signatures: one with no arguments and one with two arguments, an IEnumerable<T> and a ConsoleColor. This one also has two signatures: one with no arguments and one with a single string. For the latter, the string is used as a title on the list block that follows.
Another difference to note is that this Dump method shows all the results from one step, then all the results from the next step, etc. The earlier Dump method showed individual results from one step intermingled with those of other steps, and let you see the actual sequence of execution. LINQPad is not changing the way the LINQ chain executes here; rather, I assume it is just collecting all the results internally and repackaging them in a clean visualization before presenting them.
Examining Complex Objects
The HostSwitcher subset.linq file in the accompanying code archive contains an excerpt of the HostSwitcher code, including the CreateMap method shown near the beginning of this article. This real-world example lets you experiment with complex objects in LINQPad. Open the file in LINQPad and execute it and you get the dump of two structures (Figure 7).
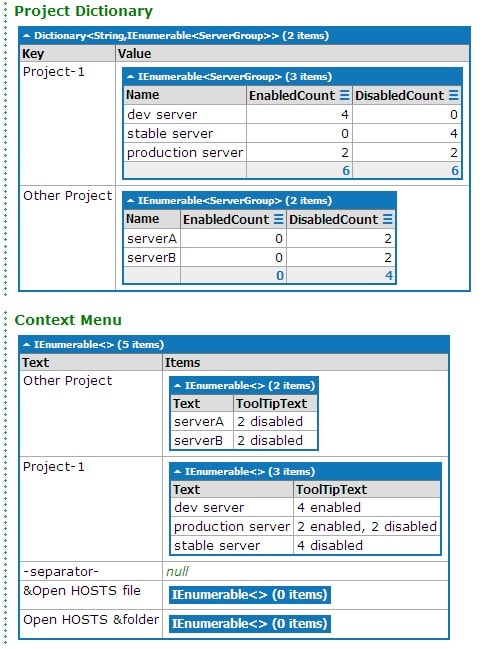
Figure 7 LINQPad Inspection of HostSwitcher’s Dictionary and Context Menu
The project dictionary displays the result of the CreateMap method that uses a complex LINQ chain to build a dictionary. Notice from the dump that it is a dictionary with string keys and IEnumerable<ServerGroup> values. The dictionary is available in a property so Dump can be directly invoked on that property, as shown in the first couple lines of the main program:
|
1 2 3 4 5 6 7 8 |
void Main() { HostManager hostManager = new HostManager(); hostManager.CreateMap(); hostManager.projectDict.Dump("Project Dictionary"); ContextMenuStrip contextMenuStrip = new ContextMenuStrip (); hostManager.BuildContextMenu(contextMenuStrip); hostManager.DumpContextMenu(contextMenuStrip); } |
One of the uses of the dictionary is to create a dynamic context menu, enumerating each server group for each project. The context menu is constructed with other LINQ code so it is useful to check its structure as well. The context menu dump in Figure 7 displays the result of the BuildContextMenu method. Dump is also used here, but it is embedded in the DumpContextMenu method, which reformats the completed context menu before feeding it to Dump to get a more compact and meaningful output:
|
1 2 3 4 5 6 7 8 9 10 11 12 13 14 15 16 |
public void DumpContextMenu(ContextMenuStrip contextMenuStrip) { contextMenuStrip.Items .Cast<ToolStripItem>() .Select(item => new { Text = (item is ToolStripSeparator ? "-separator-" : item.Text), Items = ( item is ToolStripMenuItem ? ((ToolStripMenuItem) item).DropDownItems .Cast<ToolStripItem>() .Select(subitem => new { subitem.Text, subitem.ToolTipText } ) : null ) }) .Dump("Context Menu"); } |
This method starts with the ToolStripItemCollection of the contextMenuStrip. Recall, however, that LINQ has great affinity for IEnumerable<T> objects. The Cast extension method converts the ToolStripItemCollection to the more palatable IEnumerable <ToolStripItem> for further processing. The Select method enumerates all the items in the context menu, with the label in the first output column and the contents in the second. The contents are generated by a nested LINQ query that extracts the label and the tooltip from each second-level menu item.
Both of these dumps show how LINQPad gives a great visualization of your output. But applying what you now know about injecting a watcher into the chain, it is a trivial matter to examine the innards of the LINQ steps in the CreateMap method. I have included five Dump method calls in the CreateMap method, but they are all commented out. Here is the same CreateMap method shown earlier, now with the Dump method calls included:
|
1 2 3 4 5 6 7 8 9 10 11 12 13 14 15 16 17 18 19 20 21 22 23 24 25 26 27 28 29 30 31 |
private void CreateMap() { projectDict = hostFileData .Select(line => new { line, m = FilteringRegex.Match(line) }) //.Dump() .Where(item => item.m.Success) //.Dump() .Select(item => new { item.line, project = item.m.Groups[ProjectSubGroupIndex].ToString().Trim(), serverGroup = item.m.Groups[ServerGroupSubGroupIndex].ToString().Trim() }) //.Dump() .GroupBy(item => new { item.project, item.serverGroup }, item => item.line) //.Dump() .GroupBy(projAndServer => projAndServer.Key.project) //.Dump() .ToDictionary( project => project.Key, project => project.Select(item => new ServerGroup { Name = item.Key.serverGroup, EnabledCount = item.Where(line => !IsCommented(line)).Count(), DisabledCount = item.Where(line => IsCommented(line)).Count() } ) ); } |
Uncomment any of those to see the intermediate data structures built on the way to coalescing into the compact dictionary result in Figure 7. Figure 8 shows the first portion of each of the five Dump calls in LINQPad. Compare each to the code above:
- After the first Select method, the data is projected into records with two fields. All inputs records are included because this point occurs before any filtering-notice the count of 26 records indicated at the top of the output.
- Here the output is filtered to include only those records with successful regular expression matches; the count is down to 16 records.
- The data is reformatted again to project into records with three fields that will be used in subsequent steps; there are still 16 records at this point.
- The first GroupBy reorganizes the data to 5 records grouped by project and server group.
- The second GroupBy then nests those groups in a parent grouping of just projects. This grouping arrangement then allows applying the ToDictionary method to get the final dictionary required.
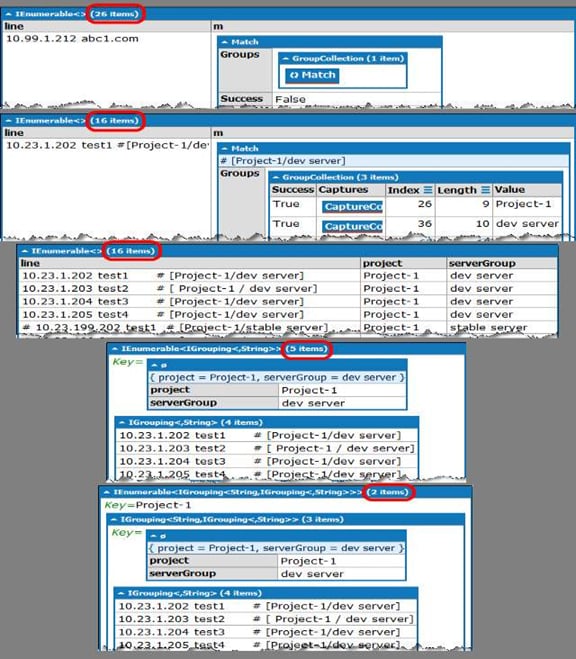
Figure 8 LINQPad’s Inspection of HostSwitcher’s LINQ Chain
There and Back Again
As I was developing HostSwitcher’s CreateMap method in Visual Studio, I lamented that I could not see the data structures the way LINQPad could show them to me. So I copied most of my code into a new LINQPad file, added the appropriate references, and then worked on the method in LINQPad, copying it back to Visual Studio when I completed it.
Unfortunately, there is no automatic way to copy a Visual Studio project into LINQPad. I asked the author Joseph Albahari about importing a Visual Studio project into LINQPad in this StackOverflow post; while LINQPad does not do this, he is now thinking about at least adding a way to import references from a Visual Studio project. And, more immediately interesting, he pointed me to a Visual Studio add-in called LINQPad Visualizer by Robert Ivanc.
With Ivanc’s visualizer, you can get LINQPad’s Dump output inside Visual Studio! To do this, you need to set up a watch expression while you are debugging your code. But before you do that you need to install the add-in to Visual Studio. This is a two-step process. Be aware, however, that at the time of writing LINQPad Visualizer does not support Visual Studio 2010 yet, though Ivanc has assured me it is on his “to do” list.
2010.12.04 Breaking news: Just hours ago Robert Ivanc released a version that supports VS2010!
- From the link above, obtain the linqpadvisualizer.dll and, as Robert indicates in his instructions, copy the dll to the Visualizers folder of your Visual Studio instance (e.g. Documents\Visual Studio 2008\Visualizers). If the Visualizers folder does not exist, just create one.
- Copy the LINQPad executable (LINQPad.exe) into the same Visualizers folder. Also copy it to the same folder where Visual Studio’s devenv.exe executable resides (e.g. C:\Program Files (x86)\Microsoft Visual Studio 9.0\Common7\IDE). Another important point here: LINQPad is available for both .NET 3.5 and .NET 4.0. You can actually run both on your system without conflict. For LINQPad Visualizer, though, you must use the version for .NET 3.5 (which is LINQPad version 2.x ! ).
Because of the restriction of LINQPad Visualizer to Visual Studio 2008, the accompanying code archive includes a VS2008 version of the HostSwitcher solution so you can try out the code as you read on.
As shown in Figure 9, advance the debugger so that the object you are interested in is in scope (point 1)-notice the current line marked with the yellow arrow at the bottom of the code window. Next, open the watch window (point 2)-this should be one of the tabs in the group of tabs containing your errors, output, find, etc. Enter a new watch expression of this form:
|
1 |
new System.WeakReference(variable_to_inspect) |
Upon pressing return in the Name column of the watch window, you should see the WeakReference show up in the Value column with-and this is the important point-a dropdown indicator on the right edge of the Value field (point 3). Open that dropdown and select (probably) the only visualizer available, the Linqpad (sic) Visualizer. Upon making that selection, you should get a new pop-up window showing the output of the variable you specified in the same form as LINQPad’s Dump method would render it (point 4). My example shows the dictionary created by the CreateMap method, exactly as you saw it in Figure 7.
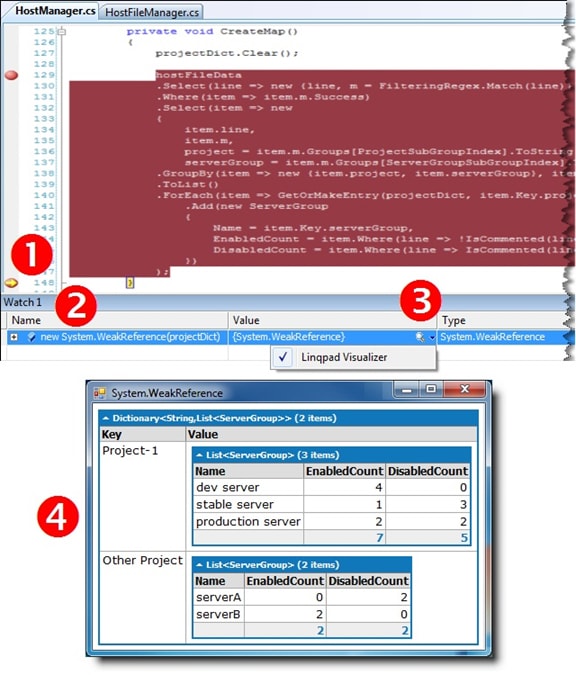
Figure 9 Using LINQPad’s Inspection in Visual Studio
LINQPad Visualizer definitely has value but there are a few issues to keep in mind:
- As already mentioned it does not yet provide Visual Studio 2010 support.
- If you leave the watch definition in place, the next time you debug the project and open the watch window the value field says “This expression causes side effects and will not be evaluated.” At the right edge instead of a dropdown icon you will find a refresh icon. Simply click that refresh icon to restore the dropdown.
- Most significantly, LINQPad Visualizer can only inspect objects that are marked as Serializable. (Ivanc clearly mentions this as a limitation on his web site, so kudos to him for that.) Unfortunately, I still had a bit of trouble with the dictionary example I have been using. If you look carefully in Figure 9 you will observe that the code for CreateMap is somewhat different than the code listing I originally presented for the method. To demonstrate LINQPad Visualizer I had to revert to this earlier version of the method. The more streamlined code (using the ToDictionary LINQ method) causes LINQPad Visualizer to throw an exception complaining that the new ServerGroup() construct is a non-serializable type even though it does have the [Serializable] attribute.
010.12.04 Breaking news: Ivanc just identified what caused the exception I encountered! Technically it was a user error (mine) but you need to know this vital piece of information to avoid it: The catch is that you cannot serialize things that are lazy evaluated, so by forcing evaluation (with for example a ToList() call) you convert to something that can be serialized. So my final code for CreateMap–the version with ToDictionary–may be used by adding a ToList() to the ToDictionary code segment (I have replaced a chunk of code with an ellipsis for clarity) as shown:
    .ToDictionary(

       project => project.Key,

       project => project.Select(item => ...).ToList()

    );
I point out the defects I have found not to condemn the product, but rather to help you work through them. I commend Ivanc on his efforts and look forward to improvements with this handy utility.
Conclusion
LINQ is a tremendous productivity boost when you understand its capabilities. Fortunately, it is a technology that you can learn a bit at a time and also apply a bit at a time; it does not require nor demand wholesale conversion from previous techniques. Use the Dump method presented here to prevent your LINQ chains from becoming opaque as you delve into more and more complex chains. As you are learning LINQ, LINQPad is invaluable, letting you experiment with code fragments with ease. But it is not just a tool for learning; it is great for “real-world” code development in general. When you need to work out some data flow, copy pieces over to LINQPad so you can developer and/or fine-tune it. Alternately, if it is cumbersome to find all the tendrils of the code you are working with to move it to LINQPad, bring LINQPad into Visual Studio with the handy LINQPad Visualizer, subject to the caveats mentioned. If you have not yet experienced LINQ, now is the time to give it a try!
Footnotes
[1] The code archive accompanying this article includes: a VS 2010 solution (ChainingAndDebugging) illustrating dumping in Visual Studio; a VS 2008 solution (HostSwitcher2008) illustrating the LINQPad Visualizer; and a LINQPad Queries folder with LINQPad examples.
[2] Impedance matching is a design practice in electrical engineering (used here as an analogy) whereby the output of one stage is designed to most efficiently and effectively match the input requirement of a subsequent stage in a pipeline process.
[3] LINQ comes in several main flavors-LINQ to SQL, LINQ to XML, LINQ to DataSet, and LINQ to Objects-and a whole variety of lesser known ones, too. This article focuses on LINQ to Objects but the principles apply to LINQ in general.
[4] See my earlier article Using LINQ Lambda Expressions to Design Customizable Generic Components for more on query syntax vs. method syntax.
[5] For further reference on LINQ operators, see the MSDN reference pages Enumerable Methods and Standard Query Operators Overview.
This document contains proprietary information and is protected by copyright law.
Copyright © 2026 Red Gate Software Limited. All rights reserved
Load comments