
The series so far:
- Hands-On with Columnstore Indexes: Part 1 Architecture
- Hands-On with Columnstore Indexes: Part 2 Best Practices and Guidelines
- Hands-On with Columnstore Indexes: Part 3 Maintenance and Additional Options
- Hands-On with Columnstore Indexes: Part 4 Query Patterns
Query performance against a columnstore index depends on controlling the number of segments read. Two mechanisms achieve this: rowgroup elimination (filtering on the ordered column to skip irrelevant rowgroups) and segment elimination (querying fewer columns to reduce the segments accessed per rowgroup).
For aggregate queries, SQL Server can use segment metadata (min/max values) to return results without decompressing the data, making queries across hundreds of millions of rows return in under a second. When joining dimension tables, be cautious: unnecessary JOINs force additional segment reads even when no columns from those tables are used in the output. Pre-selecting dimension keys into temporary tables before joining to the columnstore often outperforms direct multi-table joins.
Read also: Part 2: Best Practices and Data Ordering
Introduction
Following a solid dive into the architecture, maintenance, and performance of columnstore indexes, the next logical step is to analyze the data within a columnstore index.
Reading data from a highly compressed analytical structure is quite different from the query patterns used on transactional data. By leveraging metadata, data order, segment elimination, and compression, large tables can be quickly read and results returned in seconds (or less!).
Taking this further, read queries against columnstore indexes can be further optimized by simplifying queries and providing the query optimizer with the easiest path to the smallest columnstore scans needed to return results.
This article explores the most efficient ways to read a columnstore index and produce guidelines and best practices for analytics against large columnstore data structures.
Test Data
The test data for this article comes from the table fact_order_BIG_CCI, which was introduced in the first article in this series and is a blown-up version of fact_order from the WorldWideImportersDW Microsoft demo database. To quickly recap, the table contains 23,141,200 rows of data spanning a date range of 2013-01-01 through 2016-05-31.
The table is ordered and partitioned by [Order Date Key], the time dimension for this fact table. The following is a sample of data from the table:
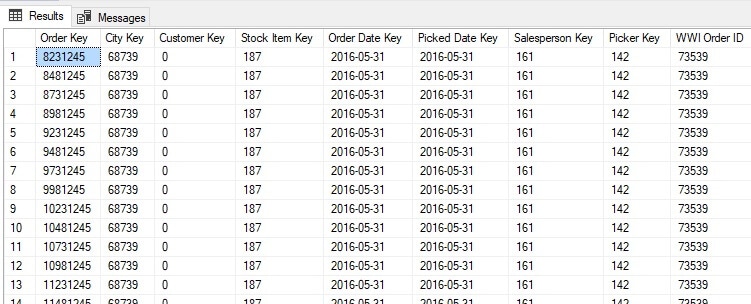
This table represents a classic data warehouse-style table with narrow columns that reference dimension tables as lookups. The result is data that compresses exceptionally well and is optimal for a columnstore index in SQL Server.
This change is a good start, but to illustrate the impact of effective query patterns, the data set can be expanded further:
|
1 2 3 4 5 6 7 8 9 10 11 12 13 14 15 16 17 18 19 20 21 22 23 24 25 26 27 28 29 30 31 32 33 |
INSERT INTO dbo.fact_order_BIG_CCI SELECT [Order Key] + (250000 * ([Day Number] + ([Calendar Month Number] * 31))) AS [Order Key] ,[City Key] ,[Customer Key] ,[Stock Item Key] ,[Order Date Key] ,[Picked Date Key] ,[Salesperson Key] ,[Picker Key] ,[WWI Order ID] ,[WWI Backorder ID] ,[Description] ,[Package] ,[Quantity] ,[Unit Price] ,[Tax Rate] ,[Total Excluding Tax] ,[Tax Amount] ,[Total Including Tax] ,[Lineage Key] FROM Fact.[Order] CROSS JOIN Dimension.Date WHERE Date.Date > '2013-04-10' AND Date.Date <='2014-03-31'; GO DROP INDEX CCI_fact_order_BIG_CCI ON dbo.fact_order_BIG_CCI; CREATE CLUSTERED INDEX CCI_fact_order_BIG_CCI ON dbo.fact_order_BIG_CCI ([Order Date Key]); CREATE CLUSTERED COLUMNSTORE INDEX CCI_fact_order_BIG_CCI ON dbo.fact_order_BIG_CCI WITH (MAXDOP = 1, DROP_EXISTING = ON); |
This script inserts more rows into the table and then drops the columnstore index, creates a clustered index, and lastly drops the clustered index in favor of a clustered columnstore index. The added indexing steps ensure a fully ordered (and heftier) data source for us to test on throughout the remainder of this article.
Before moving on, a quick query against this data can confirm its size and date range:
|
1 2 3 4 5 |
SELECT COUNT(*) AS row_count, MIN([Order Date Key]) AS min_order_date_key, MAX([Order Date Key]) AS max_order_date_key FROM dbo.fact_order_BIG_CCI; |
The results show that we have multiplied our data by a factor of five while retaining the same date range as before:
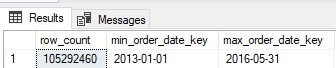
Each date contains between 40k and 250k rows. While this is in no way big data, it is large enough to be interesting and forces us to use caution when querying it as a scan of too much data would be quite slow and painful.
Controlling Columnstore Index Performance
The key to columnstore index performance is to control the number of segments read. Rowgroup elimination and segment elimination in conjunction with partition elimination allow a large columnstore index to be subdivided very quickly, like cutting a piece of graph paper to remove a small section of squares and discarding the rest.
Segment elimination is achieved by reducing the number of columns accessed in a query. Rowgroup elimination is the result of filtering on a column that is well-ordered within the columnstore index. The combination allows for two efficient query mechanisms that are facilitated by a third process:
Many Columns, Targeted Date Range
Due to their superb compression, columnstore indexes can service queries across many columns, and does so efficiently so long as the count of rowgroups to be read remains relatively low. A rowgroup represents 220 (about 1 million) rows, and therefore each rowgroup read indicates a million rows that need to be read within each referenced segment.
Consider the following query:
|
1 2 3 4 |
SELECT * FROM dbo.fact_order_BIG_CCI WHERE [Order Date Key] = '2015-03-19' |
This query returns 135,135 rows with all 19 columns from the table but does so for only a single date. Since our data is ordered by date, all partitions that do not contain this date can be eliminated. Similarly, all rowgroups that do not contain this date can be eliminated.
The query takes about a second to process, most of which was returning the data to the client. We can confirm the most effort needed to read a single rowgroup by checking the metadata for all rowgroups in this columnstore index:
|
1 2 3 4 5 6 7 8 9 10 11 12 13 14 15 16 |
SELECT MAX(column_store_row_groups.size_in_bytes) AS max_size_in_bytes, COUNT(*) AS rowgroup_count FROM sys.column_store_row_groups INNER JOIN sys.indexes ON indexes.index_id = column_store_row_groups.index_id AND indexes.object_id = column_store_row_groups.object_id INNER JOIN sys.tables ON tables.object_id = indexes.object_id INNER JOIN sys.partitions ON partitions.partition_number = column_store_row_groups.partition_number AND partitions.index_id = indexes.index_id AND partitions.object_id = tables.object_id WHERE tables.name = 'fact_order_BIG_CCI' |
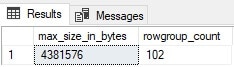
The results tell us that there is a total of 102 rowgroups in this index, of which the largest is about 4MB. This data remains compressed until needed for a query, at which time it is decompressed for use by the SQL Server execution engine. This is not a lot of data, and therefore can be returned quite quickly! Note that the amount of effort needed by SQL Server to process this query is the same whether we read one row or all rows from the rowgroup as a segment read is a segment read, regardless of how many rows are read.
In general, wide queries over few rowgroups perform well due to rowgroup elimination and compression saving the day. Therefore, we can target a columnstore index with OLTP-style read queries and not pay a significant penalty for doing so.
Few Columns, Larger Date Range
The use-case most supported and encouraged by columnstore indexes are aggregate queries that span many rowgroups but read few segments. These are queries that scan lots of rows, but only a few columns. Aggregate queries can often take advantage of segment metadata to return needed data, significantly speeding up execution.
The following query pulls some quantity metrics for a full year’s worth of data:
|
1 2 3 4 5 6 7 |
SELECT MIN(Quantity) AS min_quantity, MAX(Quantity) AS max_quantity, COUNT(*) AS orders_sampled FROM dbo.fact_order_BIG_CCI WHERE [Order Date Key] >= '2015-01-01' AND [Order Date Key] < '2016-01-01'; |
This query only requires segments for two columns and can rely on metadata for the MIN, MAX, and COUNT functions. The results are returned sub-second:
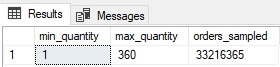
33.2 million rows were “read”, but in actuality, the segment reads were accomplished via metadata, rather than having to actually decompress and read a million rows of segment data per segment:
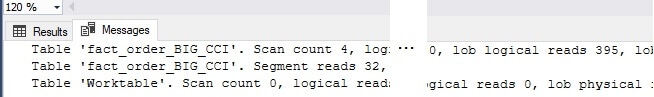
The image above is cut in the middle of a much wider series of text so that it fits nicely here on a page. Note that 32 segments are read (the entire partition for the year), which sounds like a lot, but the reads are low – only 395 LOB reads. This gives the illusion that all rowgroups (and possibly all segments) in the columnstore index were read, but remember that this table is partitioned and the rowgroups for all other years were skipped prior to runtime.
Note that all columnstore metadata and data lookups manifest as LOB reads in STATISTICS IO. This is normal and is indicative of how SQL Server stores columnstore index segments within native LOB storage.
So long as metadata is mostly being relied on for results, more columns can be queried with minimal additional effort:
|
1 2 3 4 5 6 7 8 9 10 11 12 |
SELECT MIN(Quantity) AS min_quantity, MAX([Unit Price]) AS max_unit_price, AVG([Tax Rate]) AS avg_tax_rate, SUM([Tax Amount]) AS total_tax_amount, SUM([Total Including Tax]) AS total_including_tax, MIN([Order Date Key]) AS min_order_date_key, MIN([Picked Date Key]) AS min_picked_date_key, COUNT(*) AS orders_sampled FROM dbo.fact_order_BIG_CCI WHERE [Order Date Key] >= '2015-01-01' AND [Order Date Key] < '2016-01-01'; |

Results are returned FAST, and the IO stats show more IO, but nothing significant:
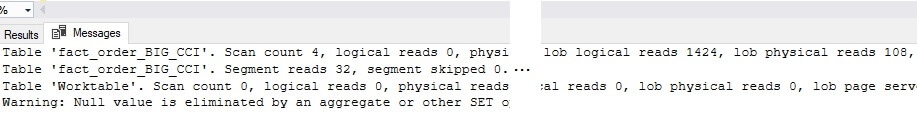
The IO is about four times what it was previously, which makes perfect sense as eight columns are being queried rather than two. Like before, metadata was used instead of data, allowing relatively low IO and a fast execution time given that 33.2 million rows were read.
A common analytic need is to group data by time range. For example, the following query returns grouped quantity data for the second half of 2015:
|
1 2 3 4 5 6 7 8 9 10 11 |
SELECT YEAR([Order Date Key]) AS order_year, MONTH([Order Date Key]) AS order_month, MIN(Quantity) AS min_quantity, MAX(Quantity) AS max_quantity, COUNT(*) AS orders_sampled FROM dbo.fact_order_BIG_CCI WHERE [Order Date Key] >= '2015-07-01' AND [Order Date Key] < '2016-01-01' GROUP BY YEAR([Order Date Key]), MONTH([Order Date Key]) ORDER BY YEAR([Order Date Key]), MONTH([Order Date Key]); |
The results take about a second to be returned, and are as follows:
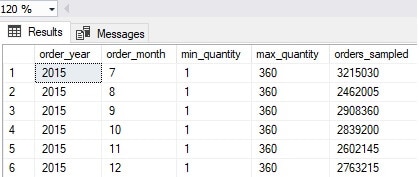
Once again, IO is quite low, and since we sampled only half of the year, half of the rowgroups (and hence half of the segments) were skipped:

No Date Range? Use Metadata!
It is possible with a columnstore index to read absurd numbers of rows relatively quickly, and the key to doing so lies in metadata. If a large number of segments need to be read, and the query can be limited to metrics stored within metadata, then the results can be returned quickly. To test this, the previously executed queries for a single year can be expanded to the entire data set:
|
1 2 3 4 5 6 7 8 9 10 11 12 13 14 15 |
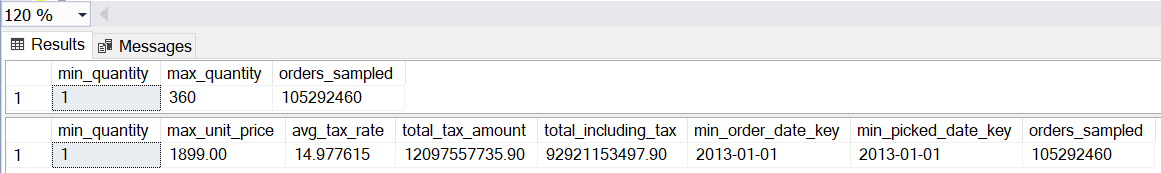
SELECT MIN(Quantity) AS min_quantity, MAX(Quantity) AS max_quantity, COUNT(*) AS orders_sampled FROM dbo.fact_order_BIG_CCI; SELECT MIN(Quantity) AS min_quantity, MAX([Unit Price]) AS max_unit_price, AVG([Tax Rate]) AS avg_tax_rate, SUM([Tax Amount]) AS total_tax_amount, SUM([Total Including Tax]) AS total_including_tax, MIN([Order Date Key]) AS min_order_date_key, MIN([Picked Date Key]) AS min_picked_date_key, COUNT(*) AS orders_sampled FROM dbo.fact_order_BIG_CCI; |
The queries each sample 105.2 million rows and the total time was under a second. Even with eight columns returned, the query performed well.
The IO for each query is as follows:


The reads required to return this data were not trivial but were significantly lower than would typically be expected for scanning 105 million rows.
Joins and Filters on Dimension Tables
Most real-world queries are not as simple as a single table and a handful of metrics. Joining and filtering when consuming a large columnstore index may require some consideration to ensure that even as more dimensions are added, performance on the columnstore does not become significantly worse than what we have seen thus far.
In general, data retrieval from a columnstore index is relatively fast so long as metadata can be used and/or the segment data can remain compressed. For each segment that needs to be read, the time it takes to complete a query will increase. The more segments that are read, the slower queries get.
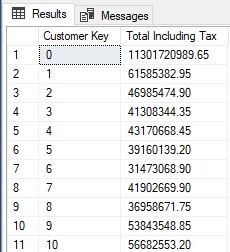
Joins naturally require segments to be read in order to link columns within a columnstore index into separate dimension tables. This query joins a handful of dimensions, but only returns one, along with a SUM:
|
1 2 3 4 5 6 7 8 9 10 11 12 13 14 |
SELECT Customer.[Customer Key], SUM([Total Including Tax]) AS [Total Including Tax] FROM dbo.fact_order_BIG_CCI INNER JOIN Dimension.City ON fact_order_BIG_CCI.[City Key] = City.[City Key] INNER JOIN Dimension.Customer ON fact_order_BIG_CCI.[Customer Key] = Customer.[Customer Key] INNER JOIN Dimension.Employee ON fact_order_BIG_CCI.[Salesperson Key] = Employee.[Employee Key] WHERE [Order Date Key] >= '2015-01-01' AND [Order Date Key] < '2016-01-01' GROUP BY Customer.[Customer Key] ORDER BY Customer.[Customer Key]; |
Despite having to scan a year of data and churn through all customers in that time frame, the results are returned sub-second:
The following is an adjustment on the query where the SUM on the [Total Including Tax] column is removed:
|
1 2 3 4 5 6 7 8 9 10 11 12 13 |
SELECT Customer.[Customer Key] FROM dbo.fact_order_BIG_CCI INNER JOIN Dimension.City ON fact_order_BIG_CCI.[City Key] = City.[City Key] INNER JOIN Dimension.Customer ON fact_order_BIG_CCI.[Customer Key] = Customer.[Customer Key] INNER JOIN Dimension.Employee ON fact_order_BIG_CCI.[Salesperson Key] = Employee.[Employee Key] WHERE [Order Date Key] >= '2015-01-01' AND [Order Date Key] < '2016-01-01' GROUP BY Customer.[Customer Key] ORDER BY Customer.[Customer Key]; |
At first glance, it would seem that this query should be even faster. Without the need to pull the SUM, all that is left to retrieve is the [Customer Key]. The same results are returned, but a 40-second wait is incurred:
What happened to cause such terrible performance? In this scenario, SQL Server chose to resolve the joins and aggregate operations prior to the filter being applied. As a result, the entire columnstore index was scanned, resulting in a hefty amount of IO and a long wait.
At first glance, it would appear that this performance is unnecessary. SQL Server should be able to determine the minimum effort needed to retrieve data from a large columnstore index first, and properly weigh that against the comparatively tiny dimension tables. This is a common problem and one that can be programmatically solved by avoiding unnecessary joins or leaning MORE on the columnstore index and less on dimension tables. This particular query can be simplified easily to remove this problem:
|
1 2 3 4 5 6 7 |
SELECT fact_order_BIG_CCI.[Customer Key] FROM dbo.fact_order_BIG_CCI WHERE [Order Date Key] >= '2015-01-01' AND [Order Date Key] < '2016-01-01' GROUP BY fact_order_BIG_CCI.[Customer Key] ORDER BY fact_order_BIG_CCI.[Customer Key]; |
This brings us back to 32 segment reads while returning the same results. Interestingly enough, the poorly performing query earlier can be “optimized” by adding an aggregate:
|
1 2 3 4 5 6 7 8 9 10 11 12 13 14 |
SELECT Customer.[Customer Key], COUNT(*) FROM dbo.fact_order_BIG_CCI INNER JOIN Dimension.City ON fact_order_BIG_CCI.[City Key] = City.[City Key] INNER JOIN Dimension.Customer ON fact_order_BIG_CCI.[Customer Key] = Customer.[Customer Key] INNER JOIN Dimension.Employee ON fact_order_BIG_CCI.[Salesperson Key] = Employee.[Employee Key] WHERE [Order Date Key] >= '2015-01-01' AND [Order Date Key] < '2016-01-01' GROUP BY Customer.[Customer Key] ORDER BY Customer.[Customer Key]; |
This method is cringe-worthy and is not a real optimization 😊 It highlights ways in which the optimizer can hit odd breakpoints that tilt it between good decisions and bad decisions.
Joined tables can incur unnecessary costs even when not used. Consider this example:
|
1 2 3 4 5 6 7 8 9 10 11 12 13 |
SELECT Customer.[Customer Key], COUNT(*) FROM dbo.fact_order_BIG_CCI INNER JOIN Dimension.City ON fact_order_BIG_CCI.[City Key] = City.[City Key] INNER JOIN Dimension.Customer ON fact_order_BIG_CCI.[Customer Key] = Customer.[Customer Key] INNER JOIN Dimension.Employee ON fact_order_BIG_CCI.[Salesperson Key] = Employee.[Employee Key] WHERE Customer.[Customer Key] = 0 GROUP BY Customer.[Customer Key] ORDER BY Customer.[Customer Key]; |
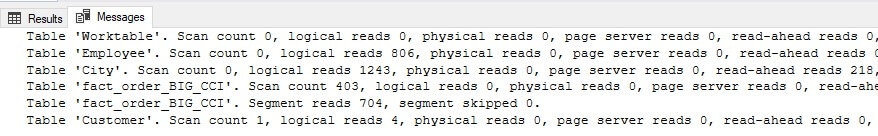
The following is the IO for the query:
No columns are returned from the City table, but it is scanned anyway. This is not as big of a surprise as the last performance bomb that was unearthed above. INNER JOINs to a table force the joined columns to be read, even if not needed elsewhere in the query. This is no different than similar queries against OLTP tables. This can exacerbate performance problems related to columnstore indexes as seen previously.
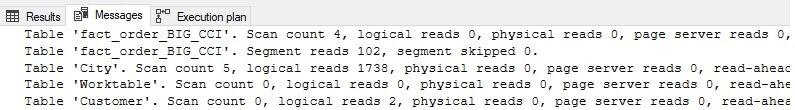
If the City and Employee tables are removed from the 40-second query from earlier, then runtime is reduced to 10 seconds:
|
1 2 3 4 5 6 7 8 9 |
SELECT Customer.[Customer Key] FROM dbo.fact_order_BIG_CCI INNER JOIN Dimension.Customer ON fact_order_BIG_CCI.[Customer Key] = Customer.[Customer Key] WHERE [Order Date Key] >= '2015-01-01' AND [Order Date Key] < '2016-01-01' GROUP BY Customer.[Customer Key] ORDER BY Customer.[Customer Key]; |
This is still painful, but indicative of how joins (necessary or not) can impact the performance of a columnstore index.
Read also:
Temporary tables for dimension key pre-selection
Subqueries for columnstore filtering
Joins and Lookups: Forcing Good Performance
The easiest workaround to these challenges is to retrieve the data needed from the columnstore index first with as few filters and joins as possible. This methodology is not very ORM or app-friendly but can help make important analysis run exceptionally fast.
For example, if there was a need to report on a specific set of customers and the columnstore index query was performing poorly, an easy fix would be to preselect the customer list, similar to this:
|
1 2 3 4 5 6 7 8 9 10 11 12 13 14 15 16 17 18 |
CREATE TABLE #customer_list ([Customer Key] INT NOT NULL PRIMARY KEY CLUSTERED); INSERT INTO #customer_list ([Customer Key]) SELECT Customer.[Customer Key] FROM Dimension.Customer WHERE [Buying Group] = 'Tailspin Toys' AND [Postal Code] BETWEEN '90000' AND '90200' SELECT SUM(Quantity) AS Quantity FROM dbo.fact_order_BIG_CCI WHERE [Order Date Key] >= '1/1/2015' AND [Order Date Key] < '1/1/2016' AND fact_order_BIG_CCI.[Customer Key] IN (SELECT customer_list.[Customer Key] FROM #customer_list customer_list); DROP TABLE #customer_list; |
In this example, a very specific filter is applied to the Customer dimension. Once applied, the resulting customer keys are stored in a temporary table for use against the columnstore index.
Note that this is typically a reactionary approach. If a report or analytic process is exceptionally slow, then moving metadata searches to a separate query and feeding the results into the columnstore index will often improve performance. I would not recommend proactively implementing changes like this as it does add complexity to the script. Instead, save it as a tool to be used when needed.
This technique is not unique to the OLAP world and can be useful in complex OLTP queries to reduce the size and complexity of a query and encourage better performance from the query optimizer.
Columnstore Indexes and Memory Usage
Like OLTP indexes, all data to satisfy a query needs to be read into the buffer cache prior to being used by the execution engine. Because columnstore indexes are not updated as frequently as OLTP tables, the data that is read into memory can remain there compressed and untouched for an extended period of time. Compounding this, the high compression ratios achieved in columnstore indexes allow more data to reside in the buffer cache for longer, assuming no memory pressure exists.
The combination of these columnstore indexes and OLAP attributes is that memory becomes a key component of columnstore index performance. The following are the storage details for the columnstore index used thus far in this article:
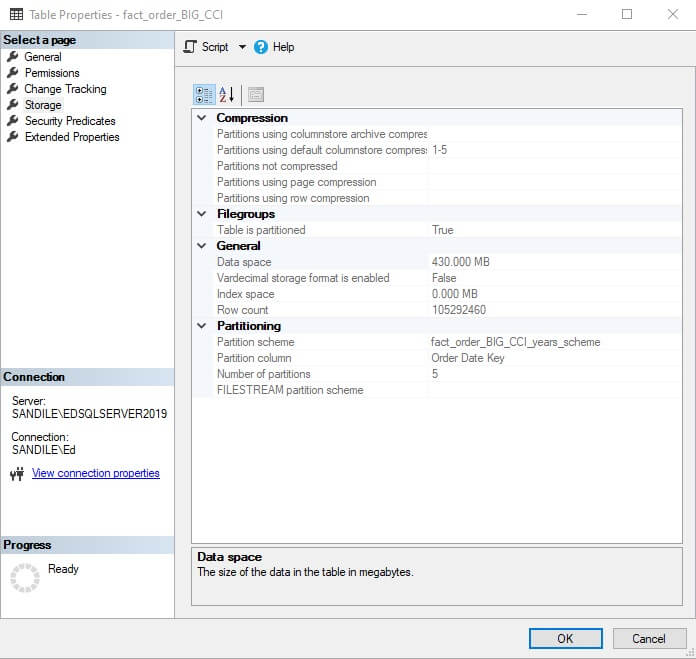
The entire index contains 105 million rows that are squeezed into only 430MB. This is small enough that an entire partition (or even the entire index) could reside in memory for reporting purposes at all times.
Real-world columnstore indexes will typically be much larger than this, to the point where the entire index remaining in memory is not feasible, but we can plan appropriately for memory sizing so that an adequate amount is available to service analytic queries.
Consider a hypothetical production analytic data store with the following details:
- 10 billion rows of data spread over 5 years (2016-2020)
- 20 columns in the table, including an ordered date dimension
- Data is partitioned by quarter based on the date dimension.
- A single rowgroup of 220 rows consumes 10MB of space.
Based on these details, we can calculate the necessary metrics to assess memory consumption by this index and plan accordingly:
This table contains 20 partitions, each of which has 500 million rows. Each partition contains 477 rowgroups that consume 5GB of space apiece.
Let’s say the most common reporting needs are:
- Report on current year revenue, which requires aggregating two decimal(20,4) columns and one integer ID columns and filtering by date.
- Report year-over-year revenue for the current quarter, which requires two decimal columns and one integer ID column for the current quarter and the same quarter in the previous year.
- Report on all metrics aggregated for the current quarter.
These represent very common reporting needs that read current data most frequently and older data less and less. These requests can each be evaluated, and a memory estimate created that allows us to understand how to keep our most commonly queried data in cache indefinitely:
- Four columns are needed: This represents 1/5 of the columns in the table and therefore approximately 1/5 of the data. Therefore, one year of data for these four columns will require about 4GB of data. As long as 4GB of memory are free for use by this columnstore index, then the data can remain in memory for an extended period of time and service this query effectively.
- The same four columns are needed from query #1 above. This again represents 1/5 of the columns in the table and therefore approximately 1/5 of the data. This time, only two quarters are needed, rather than a full year, one of which is already accounted for in the first query, and the older one which is querying older data. To maintain the data needed by this query, 2GB of data are required, of which 1GB is already included in the first query above.
- This query requires the entire current partition, all 20 columns, which requires 5GB, of which 1GB is already accounted for in the previous queries, and 4GB represents new data not already in cache.
The end result is that approximately 6GB of memory are needed to maintain all data required by these queries in cache indefinitely.
Determining the overlap from the above math is a bit convoluted, and most administrators would make an educated estimate, add additional headroom, and move on, rather than attempt the precise calculation. If this were my table and if allocating memory were my responsibility, I’d start with 10GB and budget to add another 2GB per year in the future.
Assuming this memory expenditure is acceptable, then reporting on these metrics will be exceptionally fast as all segments required will remain in memory and rarely need to be read from storage. Reading columnstore index data from memory is exceptionally fast when compared to scenarios where data needs to be read from storage into the cache first.
The key takeaway from this discussion is that query patterns can affect memory consumption, therefore influencing how much computing resources should be allocated for an analytic data store. Understanding query patterns can allow smart decisions to be made with regards to capacity planning and ensuring that important analytics perform as optimally as possible.
Read also: What Are Columnstore Indexes?
Conclusion
How data is queried has a profound impact on performance, indexing needs, and capacity planning.
While columnstore indexes typically perform impressively well, they may choke on more complex queries. Being able to troubleshoot these problems and rewrite queries to be more modular can significantly improve performance by optimizing data retrieval from the large columnstore index and managing smaller dimension lookups separately.
Memory allocation can also be determined based on common query patterns, allowing a server to maintain more than enough cache to service common/critical queries. Since columnstore index data changes far less frequently than OLTP tables, most segments can remain in memory for a long time, with only the newest data being added on a rolling basis.
Combined, these concepts can further improve columnstore index performance and allow analysts and administrators to query large data warehouses or OLAP data stores exceptionally fast.
Read also: Part 3: Maintenance and Additional Options
Fast, reliable and consistent SQL Server development…
FAQs: Columnstore indexes in SQL Server part 4 – query patterns
1. How do you optimize queries against a columnstore index in SQL Server?
Three strategies: (1) Filter on the ordered column (typically a date) to enable rowgroup elimination – SQL Server skips entire rowgroups whose date range doesn’t match. (2) Query only the columns you need to minimize segment reads. (3) Use aggregate functions (SUM, MIN, MAX, COUNT) which can leverage segment metadata instead of reading actual data. For wide-column queries, filter to a narrow date range. For many-column aggregates, let metadata do the work.
2. Why do JOINs slow down columnstore index queries in SQL Server?
INNER JOINs force SQL Server to read the join columns from the columnstore even when those columns aren’t in the SELECT or WHERE clause. Worse, the optimizer sometimes processes joins and aggregations before applying date filters, causing a full columnstore scan. The fix: remove unnecessary joins, or pre-select dimension keys into a temporary table and use an IN subquery against the columnstore. Adding an aggregate column (even COUNT(*)) can sometimes redirect the optimizer toward a better plan.
3. How much memory does a columnstore index need in SQL Server?
Estimate based on your query patterns: calculate how many partitions, rowgroups, and columns your most common queries access. Each segment is typically a few MB compressed. For a 10-billion-row table with 20 columns partitioned by quarter, common queries accessing 4 columns for one year of data might need roughly 4–6 GB of buffer cache. Budget additional headroom and plan for growth. Columnstore data stays compressed in cache, so more data fits in memory than with rowstore tables.
This document contains proprietary information and is protected by copyright law.
Copyright © 2026 Red Gate Software Limited. All rights reserved


Load comments