
The series so far:
- The BI Journey: The Analyst
- The BI Journey: The Expert’s Advice – Part 1
- The BI Journey: The Expert’s Advice – Part 2
- The BI Journey: The Journey Begins
AdventureWorks, the famous bicycle and accessories seller, has hired a new intern who joined the North American regional sales department. Ruthie, who is studying for a degree in IT, landed the internship to work for the Sales Manager Stephen as an analyst among other roles. Energetic and enthusiastic as she is, Ruthie is always on the lookout to provide value and help her boss do his job better. Recently over lunch, Stephen was telling Ruthie about how his friend’s finance company was looking at analytics to help drive business while wondering how it could probably help sales at AdventureWorks and help him make informed decisions.
Ideas
Ruthie was at once taken up by the idea and decided to do some research. She soon found out about the value of data, and how analytics could help gain insights into the business, which in turn could be used to take appropriate action or make informed decisions about the business’ direction. She called one of the database administrators at AdventureWorks and requested a set of sales data. After a bit of reluctance and mumbling about data security, the DBA, Dan, gave her a dataset that he had pulled out of the sales database, warning her to be aware of the security of the data. Ruthie immediately got to work.
After some research, she decided to use Power BI since she could get started fast for free, and for the plethora of learning and support materials that were available on the Internet. After spending a couple of days familiarizing herself with the tool, she was ready to start. The data she received was an Excel spreadsheet with sales transactions and another Excel spreadsheet with a few entities which were part of the sales process.
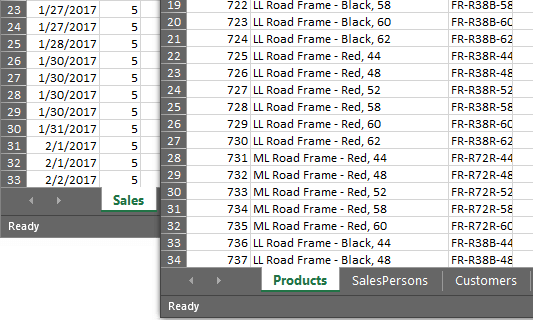
Figure 1: Sheets from Excel Sources (sales.xlsx and entities.xlsx)
The first task that she knew she had to do was to create a dataset from these files to facilitate building her very first “dashboard,” essentially a Power BI report. The AdventureWorks’ first ever venture into Business Intelligence. Something that Ruthie nor Stephen had realized.
Business intelligence, in a lot of cases, starts within departments of an organization. However, not many know about it in the wider organization. These initiatives are usually performed by analysts with some support from IT using Excel. The success of these initiatives has mixed results. It is up to those driving these initiatives to keep evolving it by improving it to provide more value.
Data Access
The sales transactions data was a crude combination of sales order header and detailed records, with IDs of each entity that were supplied in the entities file. The entities file had a sheet each for the following entities:
- Products
- SalesPersons
- Customers
Going through the products sheet, Ruthie saw that it was a quick dump, just like the sales transactions without much formatting. There were three columns called “Name” with different values for the same record. She quickly figured that one was for the products’ actual names, the other was the products’ subcategories, and the third was the products’ categories. Ruthie gave a thankful smile that Dan had given a little thought to the data he had given her despite his grouchiness. She figured that she will have to analyze the rest of the sheets, as well as the sales transaction thoroughly so that she could profile data as being part of a hierarchy, how they related with data from other tables, if data was completely available, so on and so forth, before she could start to create her reports. Other than that, to Ruthie, it looked like the files had enough information for her to get started with.
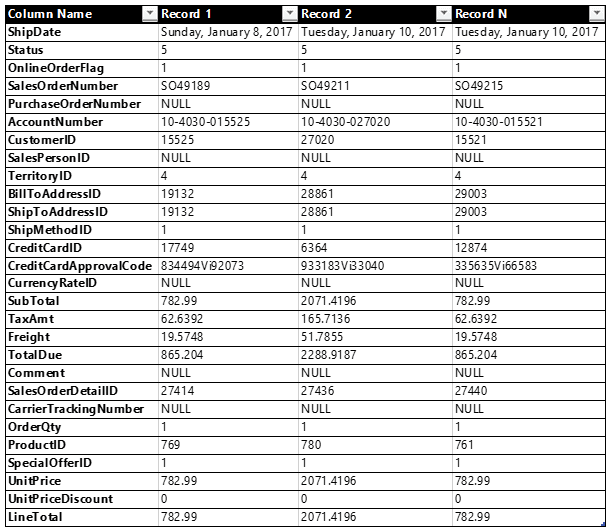
Figure 2: Sample data from Sales transaction file (Sales.xlsx)
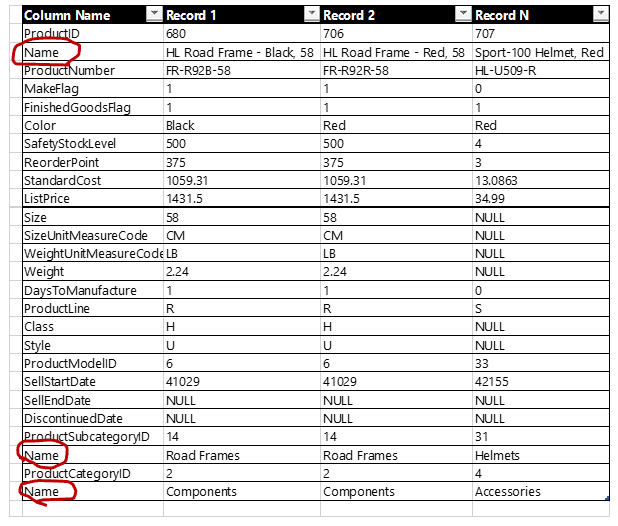
Figure 3: Sample data from Entities file – Products sheet (Entities.xlsx)
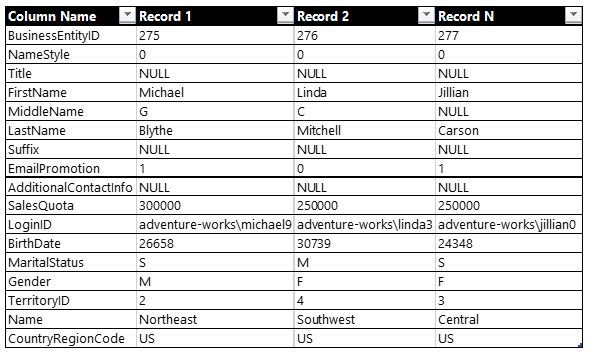
Figure 4: Entities file – SalesPersons sheet (Entities.xlsx)
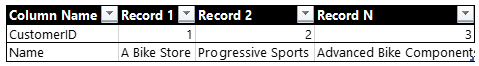
Figure 5: Sample data from Entities file – Customers sheet (Entities.xlsx)
Getting access to data is one of the first steps in analytics. Despite being a simple step as assumed by most, especially in a corporate setting, obtaining data access is a tedious process. The major reason for this being the security of data. Would a DBA want to put the organization’s data in the hands of an intern? No. Therefore, until the value is shown through business intelligence and becomes a necessity, you usually would only be blessed with a small subset of it.
Data Preparation
What Ruthie had in mind, as would so many others who were new to building reports was of a flat dataset that combined data from all the sheets from both the files, without the columns that she thought were not necessary or not valuable enough to report on. She also decided to focus on just one business activity for her pilot for a quick win: sales orders analysis.
To get started on her dataset, Ruthie opened Power BI Desktop on her PC and connected to the sales.xlsx file. She used the Power Query Editor to build the query to structure her dataset.
She then performed the following general steps:
- Chose the fields that she felt were important for analysis
(including the ID fields of the entities, since she knew she this was the only link to the entities in the Entities file) - Formatted the fields with appropriate data types
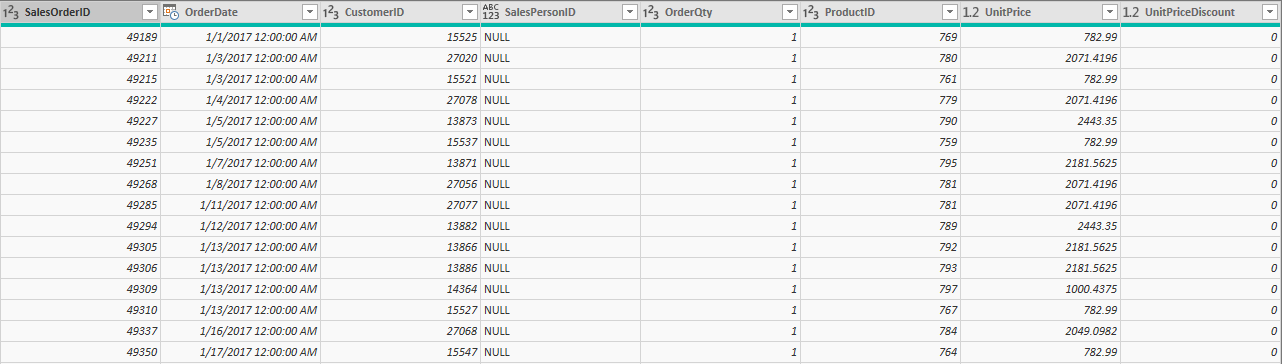
Figure 7: Cleansed sales orders
She could then analyze the number of sales orders (by counting SalesOrderID), the quantity of items ordered (by summing up OrderQty), and the value of items ordered (by calculating it using OrderQty, UnitPrice, and UnitPriceDiscount).
By adding a custom column to calculate the order value and getting rid of the UnitPrice and UnitPriceDiscount, she now had what she needed in terms of data to measure.
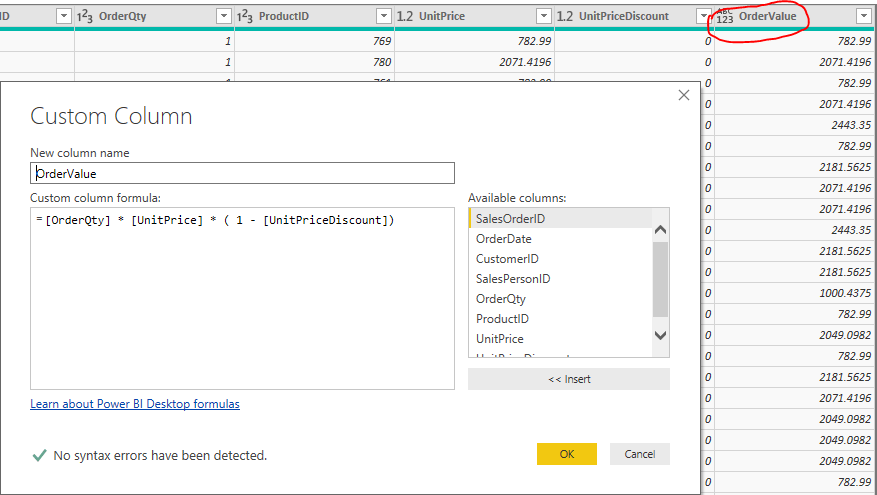
Figure 8:Cleansed sales orders with OrderValue as a calculated column
She felt this was good enough for now and should now bring in the entities. She once again pulled up the Power Query Editor and connected to the Entities.xlsx file and chose all the sheets. She then performed the same two steps she performed on the sales.xlsx files. She then performed several more steps on the queries to end up with simple results for each entity query. The following images show what the results of these queries look like.
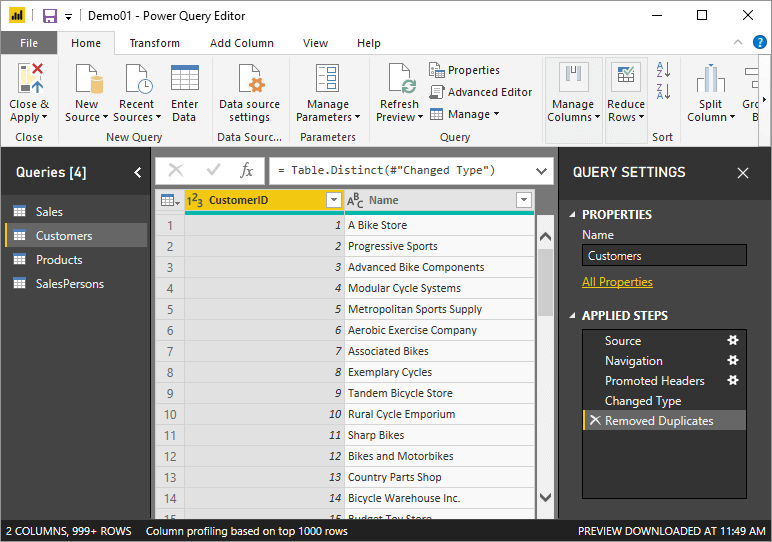
Figure 9:Cleansed Customers
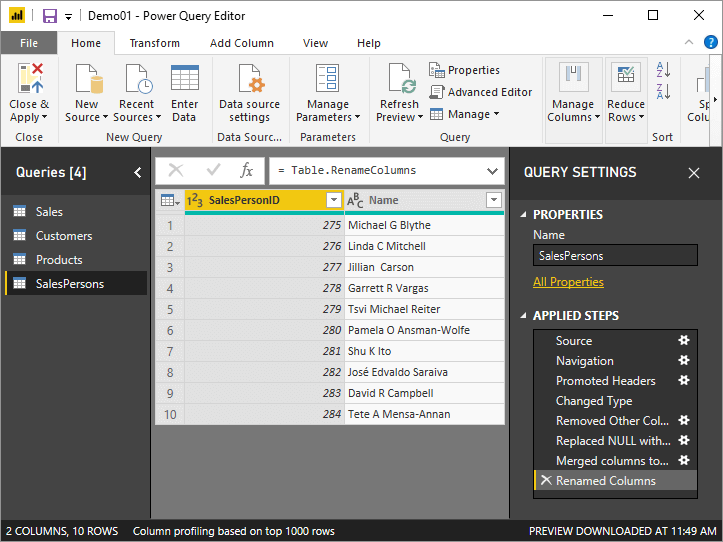
Figure 10: Cleansed SalesPersons
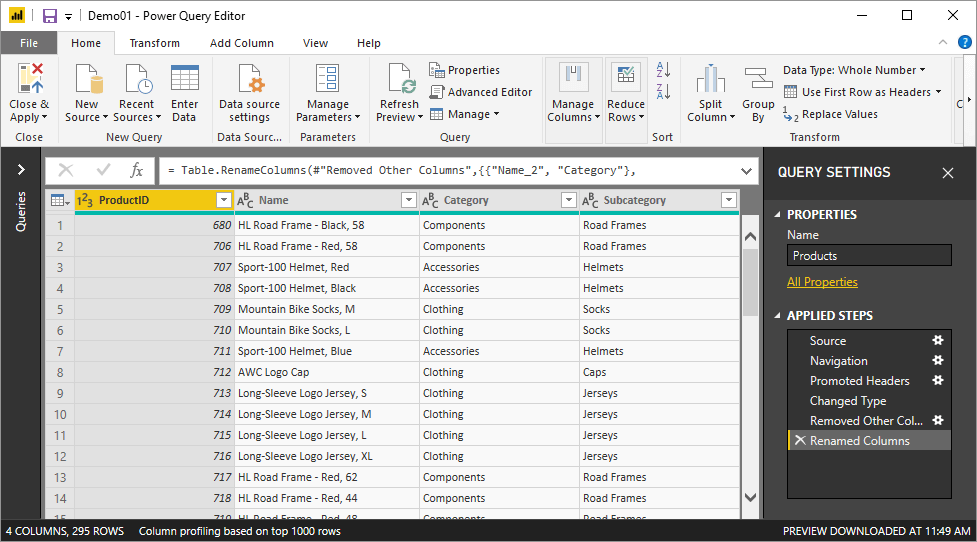
Figure 11: Cleansed Products
Each query contains the ID along with the name of the entity, except for Products, which contains two additional columns for subcategories and categories for the products. She then merged the entities with the entity queries with the sales query and removed the ID columns.
The final query looks like this, a big fat sales orders table with relevant entities columns:
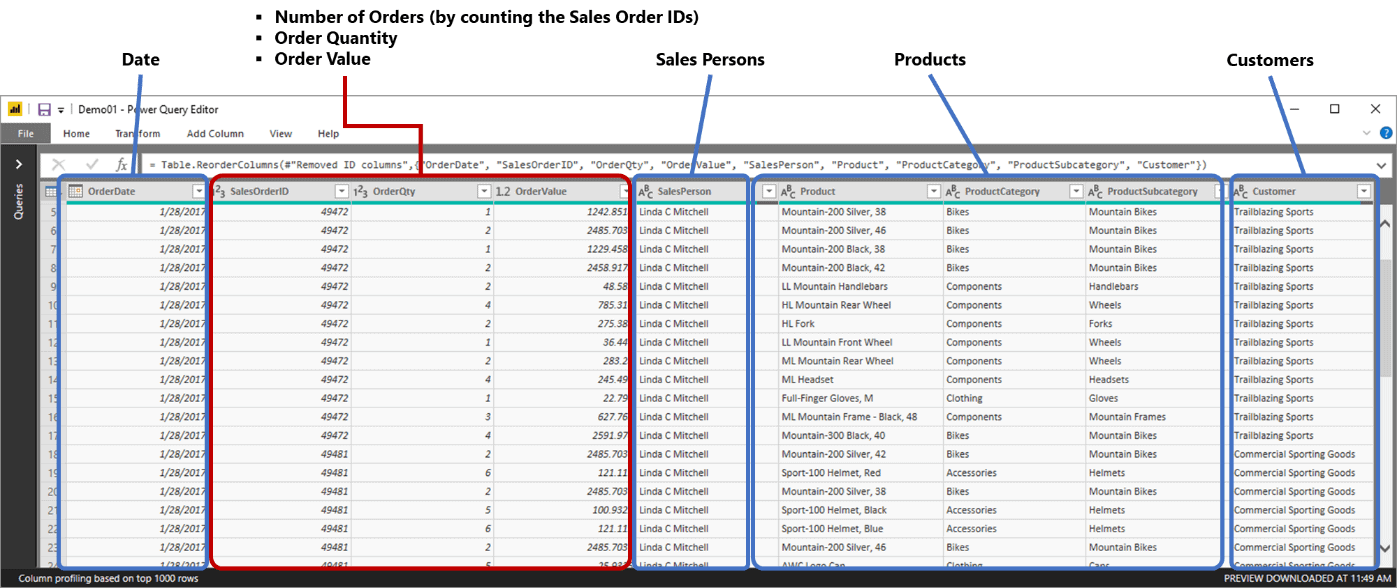
Figure 12: Sales Orders
Prepping and modeling data are probably the most time-consuming tasks when building a business intelligence solution. Data needs to be profiled and checked for all sorts of errors, business logic validated, and then structured and formatted. It will probably also need to be combined with other tables to make up the perfect model for reporting.
Now that the data structure is in place, Ruthie began building the report. She came up with a Sales Order Analysis dashboard which depicts the number of orders, the value of orders and the number of items sold. The dashboard has doughnut chart-based depictions of the three metrics by product category and by salespersons. The product category doughnuts allow for drill through to the Detail page, which shows a detailed analysis of the selected product category.
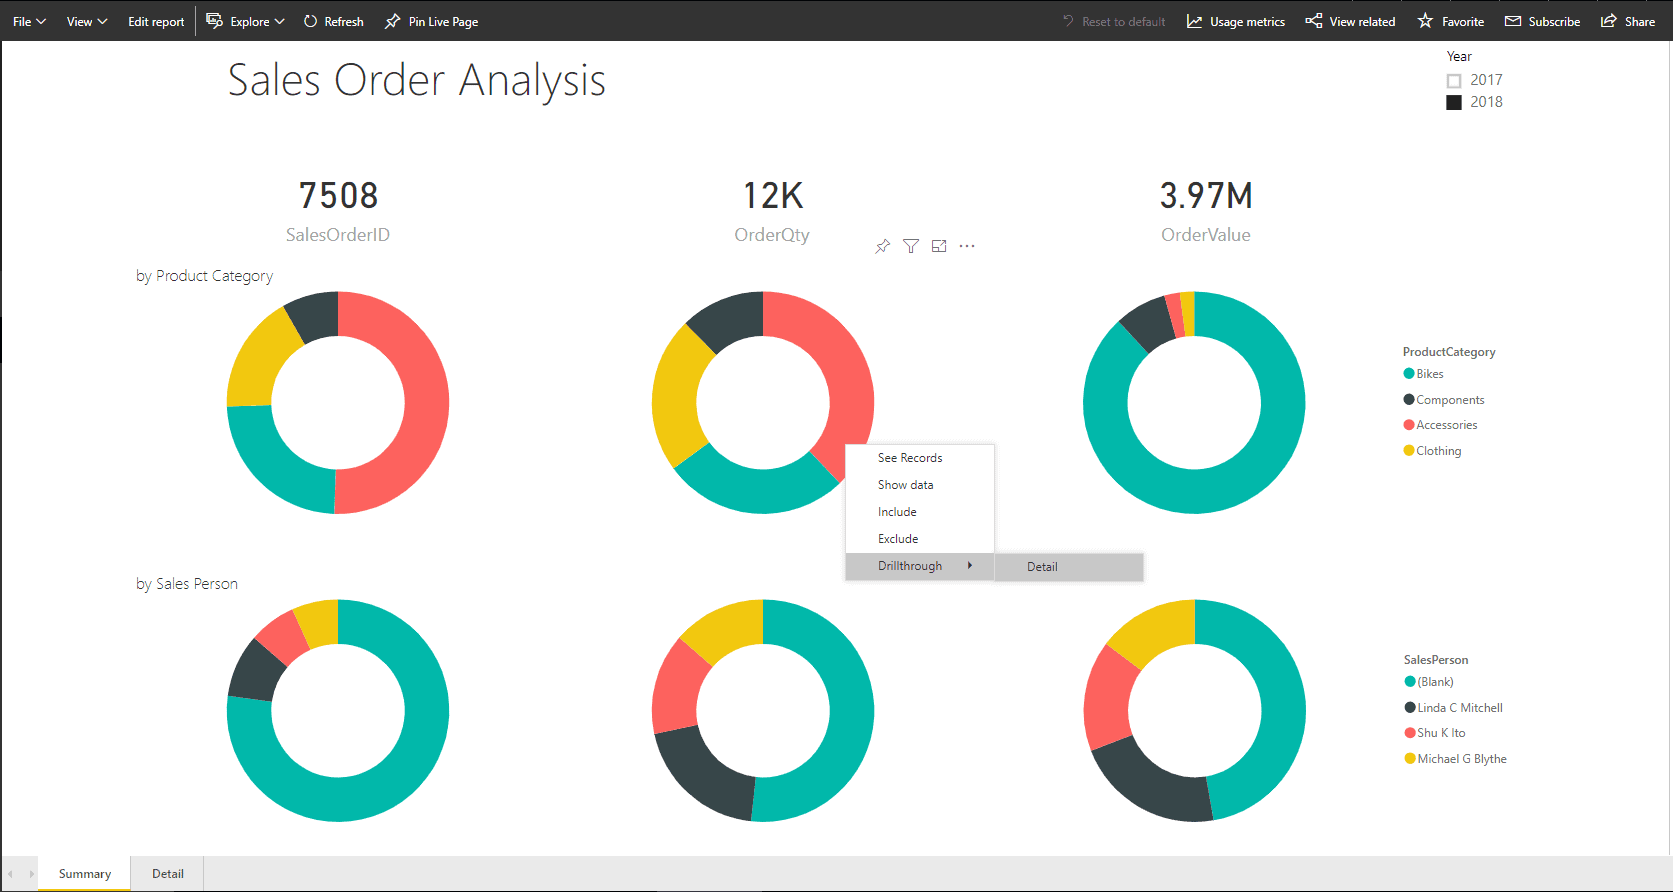
Figure 13: Sales Order Analysis “dashboard”
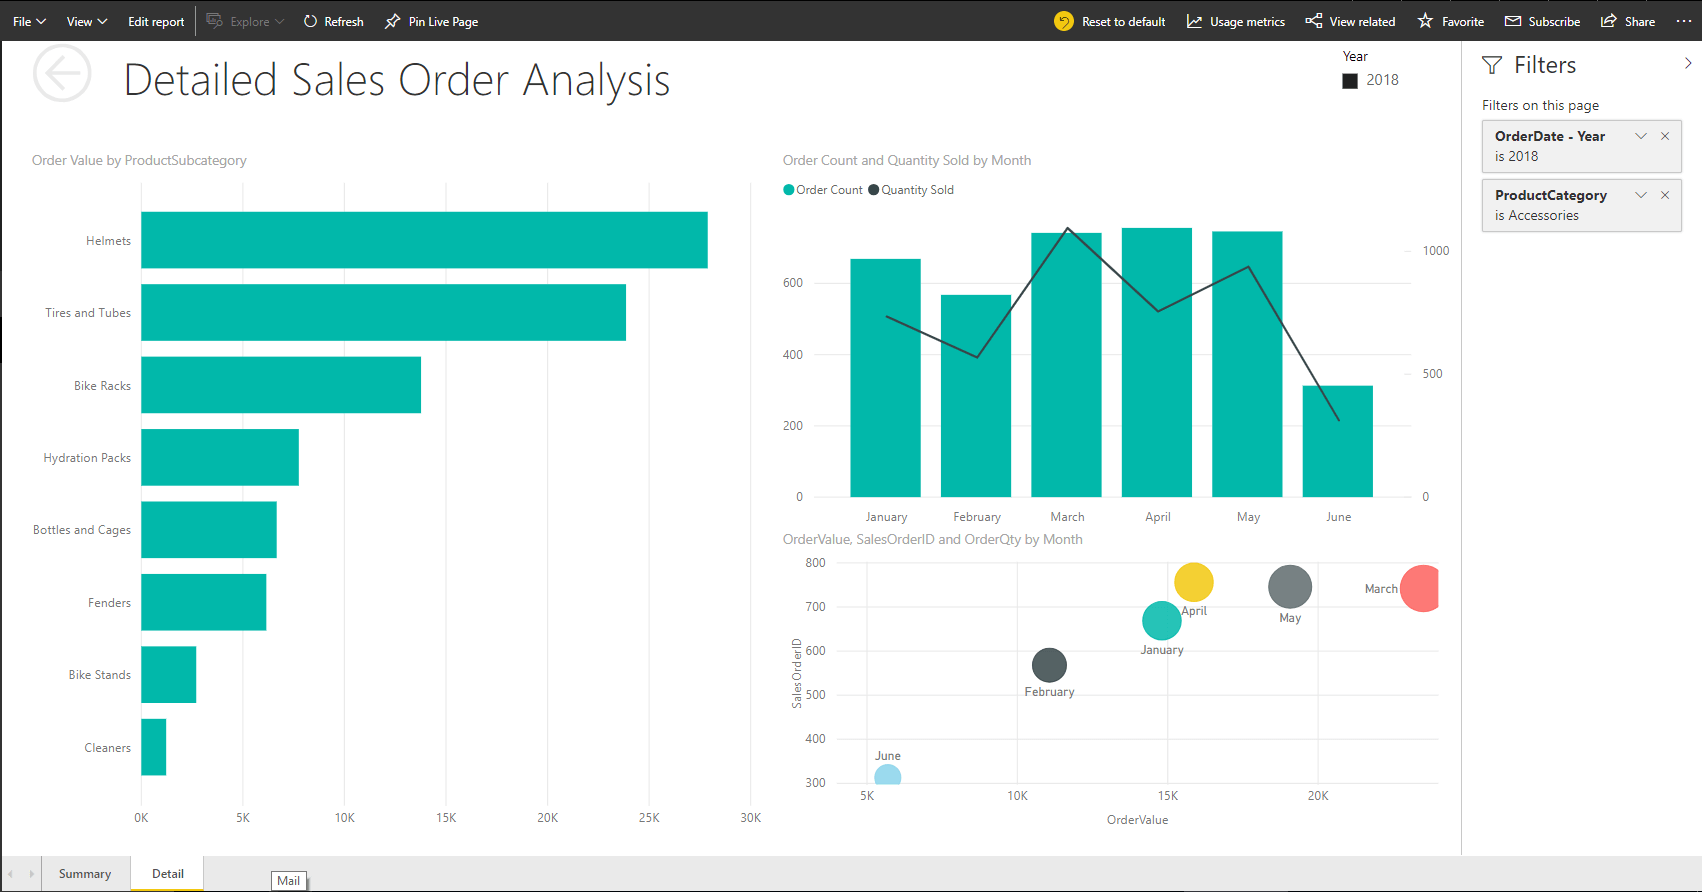
Figure 14: Detailed Sales Order Analysis page
The report shows some basic metrics, with detailed analysis. It, however, does the job, and Ruthie believed this would be good enough to get Stephen interested and his head sparking off ideas. She also included a phone view of the report, so that Stephen could see what was going on with sales wherever he was.
Getting to this point with the report was not a straightforward activity. Data was first tried out on the canvas several times with different visuals to build a story.
![]()
Figure 15: Sales Order Analysis on phone view
Ruthie did not waste time before showing this to Stephen. She quickly scheduled a meeting before Stephen left for the day, and ran him through the entire report, and even showed him how he could whip up his own report quite easily off the data structure she had built.
Stephen was quite impressed, especially since it just took a couple of days’ effort to get to this point. He was already shooting off ideas in his head as Ruthie guided him through the report. He could see so much potential in this type of solution where Ruthie had not relied on IT’s help too much, and the ability to build reports himself as long as he had the data set-up.
Tweaking for Value
He remembered that he used an Excel spreadsheet to store monthly sales targets that he set for all his sales representatives. He had never used it to measure the sales representatives’ performance effectively; he only used it to draw out the monthly targets based on the previous years’ sales patterns before sending it to the sales representatives – it was all just manual. Maybe he could ask Ruthie to include this spreadsheet into the mix and see if she could come up with more valuable insights.
He also found that switching between the two years to compare the previous year’s sales against this year’s sales was cumbersome, and he could not gauge how well sales were doing this year compared to the last. He quickly put down a list of improvements he would like to see in the next version of the report and handed it down to Ruthie.
Ruthie sighed. Stephen had not shown any enthusiasm nor excitement, except for the grunting sound he made when he kept clicking on the Year slicer switching back and forth between the previous and current year repeatedly. But then she held that piece of paper he had handed her. It was an impressive set of requirements: he wouldn’t want her to do all that if he didn’t find the solution appealing.
The list:
- A better way of comparing the current year against the previous year
- Use my targets spreadsheet. I want to measure each of the reps’ sales against it
- Get proper naming, I can’t stand words stuck together, and I want to understand the dataset better if I was to do my own reporting
- I want to see territory-wise as well. Will be nice on a map! I don’t know if you could do that
- It would be nice to see which reps are more motivated. You know if they were single would they perform better, or if they were younger would they not be too enthusiastic, you know that kind of thing
- And Ruthie, make sure numbers are properly formatted. I don’t know if one thing is in dollars or quantity!
- Sales trends for the last five years would be a good thing too
Ruthie smiled to herself and packed her backpack. She planned to spend her weekend working on the report. It was way more interesting than the movie marathon she had planned with her BFFs. But just before she left for the day, she stopped by the DBA’s cubicle. Dan was usually in the office until late. She asked him if she could have more data and got into a conversation about analytics with him. Dan said he would see if he could send her the data before he left for the day but was in no mood to talk about analytics. He thought it was great that organizations were getting into it, but his passion was automating whatever he could with PowerShell. He gave her the contact information of a local analytics guy who worked a lot with the community; he said George would surely be happy to talk to her about it and that he would give George a heads up. The ever-enthusiastic Ruthie didn’t waste time contacting George who was more than ready to help and set up to meet for breakfast at the local coffee shop.
George was already at the coffee shop after his morning jog when Ruthie got there. He liked those who took up technology with a zing, especially if it was analytics. He took a look at the dataset Ruthie had built, shook his head slightly, then nodded at it. He looked at the list Stephen had given her and then proceeded to explain how to build a proper dataset. He called it a semantic model, something Ruthie thought sounded pretentious but decided to go along with since, after all, he was an expert.
An Expert’s Advice
George explained that the dataset that she had created was good enough for the current scenario but would soon become cumbersome when she needed to mash up data with more data sources. The best example he pointed was the targets spreadsheet that Stephen had given. The granularity of the current data set was product + customer + salesperson + date; the combination of each entity that makes up your transaction. The granularity of the targets spreadsheet, however, is product category + salesperson + month. Hence, these cannot be combined into one query (or table). He quickly tutored how to structure the data using a technique called dimensional modeling, which divides the data into facts and dimensions. Facts were those columns that she would measure or analyze, whereas dimensions were those columns that you used to analyze by. It was the entities that turned into dimensions, and you often you could group up dimensions within a single table itself such as the product dimension having the product name, product subcategory and product category. Or the date dimension which would contain the date, week, month, quarter and year columns. He drew up the semantic model for Ruthie’s case, and explained that once she’d got a correctly designed data model, then reporting on top of that would be very flexible; reports could be drawn up to answer different types of questions that get asked.
George also gave Ruthie a few more tidbits of best practices and advice when building a semantic model:
- Create measures (using DAX) and hide relevant fact columns
- On measure tables, ensure that only measures are made visible
- On dimension tables, ensure only columns that make sense for analysis are made visible
- ID columns, regardless of measure or dimension table, should be hidden
- Format measures appropriately with currency symbols, thousand separators, percentages, etc.
- Create hierarchies out of columns for users to easily use them in reports
- Name tables and columns with proper business jargon, while formatting them to give maximum user-friendliness
Towards noon, while Ruthie got ready to start work back at her apartment, she received an email from Dan. He had created views on top of all the tables that she needed and had also created a special credential for her to access all this. Ruthie was content and started on her work.
When it comes to getting business value out of a business intelligence solution, there are a few cycles that one would have to go through. This includes new data points, change of visuals, and sometimes the underlying data model itself, along with changes to the user interface. This section outlined what can be expected when it comes to tweaking a self-service business intelligence solution, plus provided some rules and best practices that should be followed.
Aftermath
On Monday morning, Ruthie was super excited to show Stephen the results of her project. She had covered almost everything that he had asked her to.
The impressed Stephen spent most of the day understanding the analysis, playing around with the reports, and noting down feedback and changes that he wanted. He was now seeing real value: he could see which of his salespeople were pulling their weight, which products were successful in which regions, and how healthy his KPIs as a sales manager were. Throughout the course of the next few days, Stephen and Ruthie spent time perfecting the little solution. What they now had was a business intelligence solution built in-house using self-service.
When it comes to business intelligence, a solution need not be a comprehensive solution that spans multiple technologies, or multiple services, or many weeks of requirements gathering, or many months of development. The ultimate criterion is that it gives value fast. Hence, even a Power BI based model with a couple of reports, if done right, can be sufficient. However, today’s solution will not suffice tomorrow. The needs of business users keep changing; the questions they ask keep changing; the answers they seek keep changing. These changes may require more data from new and complex sources, and that’s when you start looking for new technologies or methods to help support the new requirements if necessary. Business Intelligence and Analytics, consequently, are evolutionary. It is a journey an organization needs to take.
This document contains proprietary information and is protected by copyright law.
Copyright © 2026 Red Gate Software Limited. All rights reserved


Load comments