
This is the third in a series on setting up a Data Science Laboratory server – the first is located here.
My plan is to set up a system that allows me to install and test various methods to store, process and deliver data. These systems range from simple text manipulation to Relational Databases and distributed file and compute environments. Where possible, I plan to install and configure the platforms and code locally. The outline of the series looks like this:
- Setting up the Data Lab
- Text Systems
- Testing the Tools
- Instrumentation
- Interactive Data Tools (This article)
- Programming and Scripting Languages
- Relational Database Management Systems
- Key/Value Pair Systems
- Document Store Databases
- Graph Databases
- Object-Oriented Databases
- Distributed File and Compute Data Handling Systems
I’ll repeat a disclaimer I’ve made in the previous articles – I do this in each one because it informs how you should read the series:
This information is not an endorsement or recommendation to use any particular vendor, software or platform; it is an explanation of the factors that influenced my choices. You can choose any other platform, cloud provider or other software that you like – the only requirement is that it fits your needs. As I always say – use what works for you. You can examine the choices I’ve made here, change the decisions to fit your needs and come up with your own system. The choices here are illustrative only, and not meant to sell you on a software package or vendor.
The first article in this series explains my choices for the platform and the operating system, and details a few tools for text-based data interaction. The second article deals with a few examples for those text tools. Even with a few examples however, there is no substitute for studying and reading up on the tools – this series isn’t meant to be an exhaustive examination of each one. Hopefully the examples give you an idea of what the tool can do, and then you can decide how much further you want to investigate it.
The third article in the series covers Instrumentation – the ability to time processes and evaluate resource allocation on the laboratory system. The laboratory system’s first function is to serve as a place to install, configure, learn and test software that deals with data; and measuring a process is paramount to the system.
In this article, I’ll explain about tools that interact directly with data
Interactive Data Tools
Most computing systems are multi-user, storing and processing data for programs that interact with that data. The system I’m building is a place to experiment with the tools for those types of systems, but it has a secondary purpose as well.
I’ll use the data laboratory system not only to experiment with new data engines, but also to examine and manipulate data and write proof-of-concept processes and code. The process I use to do that is:
- Define the requirements (what must occur)
- Define the constraints (what cannot occur)
- Create an outline from the finish of the process backwards to the start
- Test and refine the process
- Automate the process
- Monitor the process
Step four is where the interactive data tools come into play. Before I automate the system, I need to test various ways to ingress, manipulate, and egress the data.
There are a few tools that fall into this category. When I say “interactive”, I mean that the tools are meant to be used by a single person, in real-time, in front of a console. That isn’t to say they can’t be automated – almost anything can. But in general these tools aren’t meant to be automated into the final process, with one set of exceptions.
In the last few articles I’ve referenced various text-based tools, such as sed, awk and grep. These utilities are sometimes part of the process I develop, and in the examples I showed in those articles, can be automated into an enterprise-level production environment as well. So in addition to the text-based tools previously mentioned, I’ll install (or access) a few more tools that work with data interactively.
Microsoft Excel
Microsoft Excel ranks as one of the primary tools for data analysis in the vast majority of businesses and organizations I consult with. It has, without much exaggeration, been termed “the world’s most popular database”. Of course, Excel isn’t a multi-user engine for data processing. At its most basic, it’s a spreadsheet product, normally intended for one person (or at most a small group of people) to edit various forms of data.
The reason Excel is so popular is that it does so much more. Because it became a market standard, lots of add-ins are available, and a large body of knowledge has sprung up around it. Also because of its success in the market, Microsoft has invested a great deal of time and effort in the product, making it even more robust.
Although the product has thousands of uses, for this system I’ll focus in on only a few:
- Small-scale data conversion (read from one format, send to another)
- Data manipulation
- Data calculation (involving maths, statistics, and date and time)
- Data visualization
On my laboratory system I’m installing Microsoft Excel version 2013, 64-bit edition. There are so many new features and functions that it provides that having the latest version is important to the tasks I want to accomplish – I won’t list those here, and of course you can use an earlier version and different edition on your system.
It’s important to note here that I won’t install this on my Microsoft Windows Azure Virtual Machine. Licensing restrictions prohibit me from using an MSDN edition of Microsoft software on the Windows Azure Platform, which is also true for many other cloud platforms. Check with your legal department if you’re using a different cloud provider before you use an MSDN edition.
Rather than explain the processes for working with data in a general way for Excel, I’ll have you check the reference section for the books I use for learning and working with Excel. Let’s focus instead on some of the other use-cases for this tool for the data professional.
An interesting example of working with Excel is the ability to read data not only from local files, but being able to connect to multiple data sources, from Relational Databases to Internet data sets. As an example, here is the process to read in stock values from a Web Provider (You can read more about this process and all of the parameters here: Get external data from a Web page
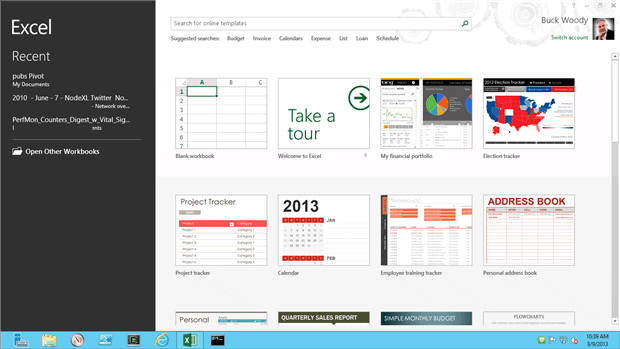
I’ll start by opening a blank worksheet, and then navigating to the “Data” object on the Ribbon interface.
Next, I click the “From Web” button, and enter the following URL when the web interface comes up:
http://moneycentral.msn.com/investor/external/excel/quotes.asp?quote=MSFT
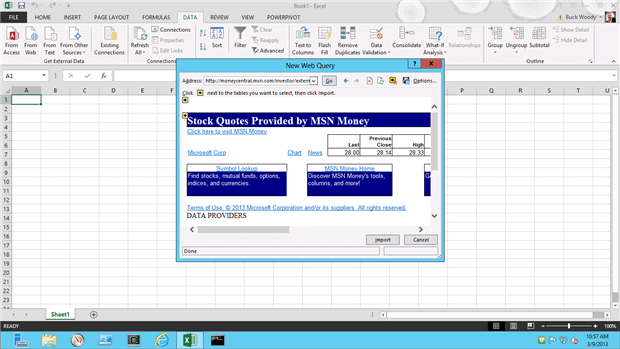
After selecting the yellow arrow representing the data set I want, I then take the default location in the spreadsheet on where to place it:
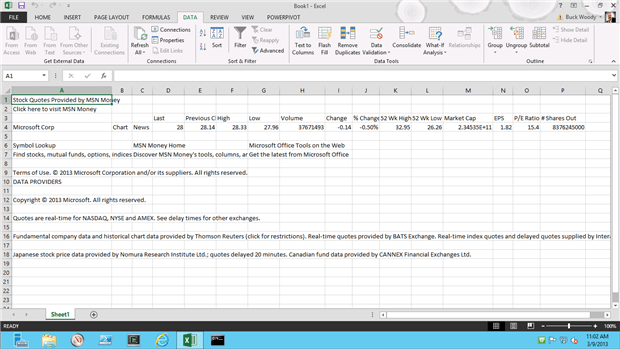
As you can see, there’s quite a bit of cleanup here, but this is only three clicks – there is a lot more you can do to bring a segment of data in to Excel. In some cases you can point to the data, in others you can copy the data, and in still others you can query the data on demand or refresh.
You can connect to or import from any number of Relational Database Systems or just about anything that you can connect to using ODBC connections.
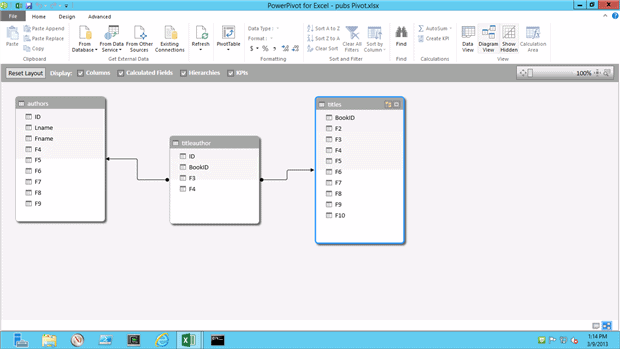
PowerPivot
Excel provides an amazing array of charts, graphics, Key Performance Indicator (KPI) dials and graphs and more for visualizing data. Those you’ll also read about in the references below, and starting in Excel version 2010, Microsoft created a new extension to serve as a Business Intelligence tool called PowerPivot. This extension allows you to bring in massive sets of data (millions of rows) and combine them into Pivot Charts (more on Pivot Charts in the References section).
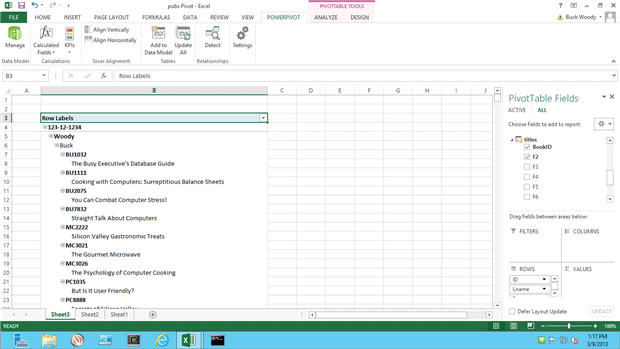
In Excel version 2010, you’ll need to add in PowerPivot with an installation, but in version 2013 it’s built in and all you have to do is enable it. I’ll give you a reference to both below.
There’s a of data evaluation you can do with PowerPivot, but the two main values are working with huge amounts of data (for a spreadsheet, anyway) and tying multiple datasets together. For an end-user, this is akin to learning to do SQL Joins. For the data professional, you can easily query data for your experiments and tests.
The real power of PowerPivot isn’t best shown in a static walkthrough; you really have to see the movement of the data and the ease of creating visualization to understand it well.
References:
- Just getting started with Excel? Use the help within the product to begin, and then go to Excel 2007 training courses to find videos, articles, books and more on the product. This is for 2007, but the basics here hold for all versions. In the newer versions you’ll find the help system links to similar content in a different format.
- After you’re past the basics, one of the best references I’ve found on Excel is “Excel Data Analysis and Business Modeling” by Wayne Winston. Microsoft Excel 2010: Data Analysis and Business Modeling This is the 2010 edition, and I’ll buy the 2013 edition when he updates it. I recommend it highly.
- Install PowerPivot for Excel 2010 (you can also find the instructions for enabling it in Office 2013) here: Download PowerPivot
Hive for Excel Add-In
Later in this series I’ll cover a distributed data computing system called Hadoop. I’ll quickly mention an add-in here for Excel that allows a query process called “Hive” to use Excel against even a huge data store like Hadoop. I mention it here only for completeness, you’ll have to wait until you have access to Hadoop on Windows Azure (which is by request).
Since I haven’t covered Hadoop yet, I’ll mention this add-in again when I come to that section. You need to have access to the HadoopOnWindowsAzure site to install the driver, but you can see the entire process here in case you don’t want to wait for my article on that: http://social.technet.microsoft.com/wiki/contents/articles/6226.how-to-connect-excel-to-hadoop-on-azure-via-hiveodbc.aspx
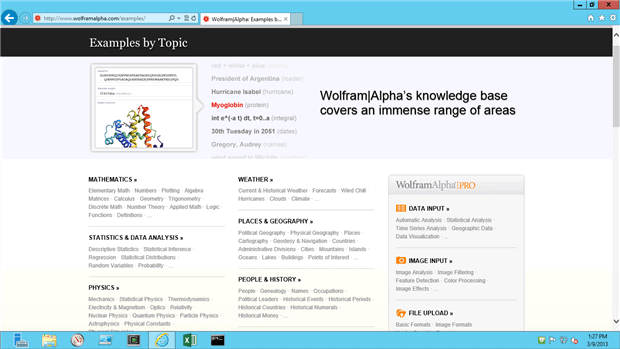
Wolfram Alpha
Wolfram Alpha (WA) is a web site (http://www.wolframalpha.com/) that deals with all things math, and also has interesting data applications. There is a premium and free access area, and in this case I’m using the free edition. I also have a paid subscription to Wolfram Alpha to do my day job. Even if you use the free version, I recommend you join the site, since you can set up individual preferences.
It’s difficult to adequately describe what WA does. The simplest thing to do is to visit the examples page (http://www.wolframalpha.com/examples) and explore the site further. You can bring in datasets or use datasets they provide, and much more. Whenever I hit an area in statistics I haven’t used in a while, I use Wolfram Alpha. After you explore it you may find yourself using it more than you might expect.
The R Project
The R Project for Statistical Computing (usually just called “R”) is an open source project that is an implementation of the “S” statistical language. R can also use “packages”, which are extensions to the functions included in R that can be downloaded and referenced in a sequence of steps.
As you progress in your career as a data professional, you will find that you need to learn, or re-learn, statistics. It’s an interesting fact that the data professional and “researcher” roles of yester-year are now converging, into what some have termed the “data scientist”. Debate continues on whether this is a factual title, but the point is that statistics plays a huge part of the data landscape in modern computing.
I originally debated whether to include R in this article or in the one that deals with programming and scripting. In R you can write commands similar to scripting, and you can also save those scripts and run them programmatically. R also has the ability to work in an automated fashion and even federated to work as an “engine” of sorts.
Even so, I find myself mostly using R in batch-mode, sitting at the terminal. I have yet to install it on a server to process data automatically.
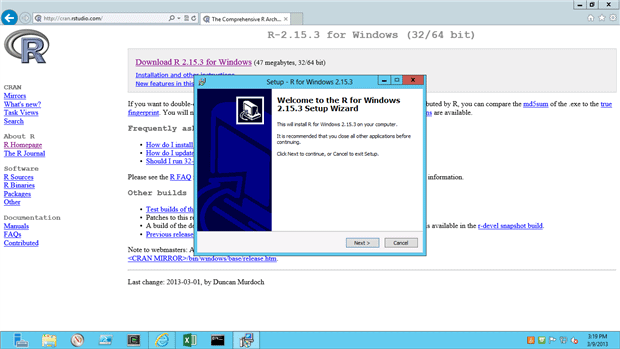
To download R, visit the site at: http://www.r-project.org/ and then select “Download R” from the first page, and select a server that is closest to you. You’ll be directed to a page to select Mac, Linux or Windows as the operating system where you want to run it. With that done, you’re directed to a page to download “base”, “contrib”, or “RTools”. Unless you’re developing for the R project, the “base” package is the binary to download.
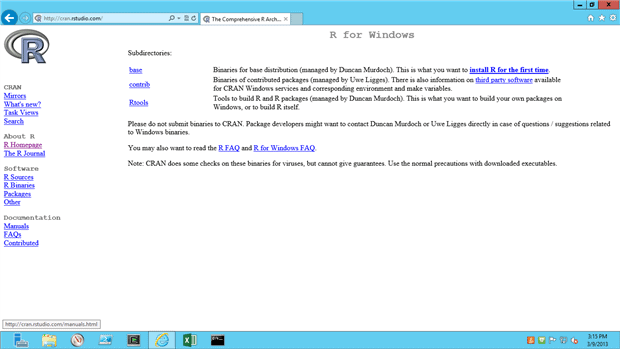
From there simply run the setup program you download, and take all the defaults.
When you’re done, you’ll have a command-line type window where you can type expressions that R will evaluate and return to you. If you’d like a formal course in the R environment, check out this reference: http://www.r-project.org/ and select the “Documentation” page. There’s a full set of manuals, introductions and so on there. If you’d like a shorter version, check out the references below.
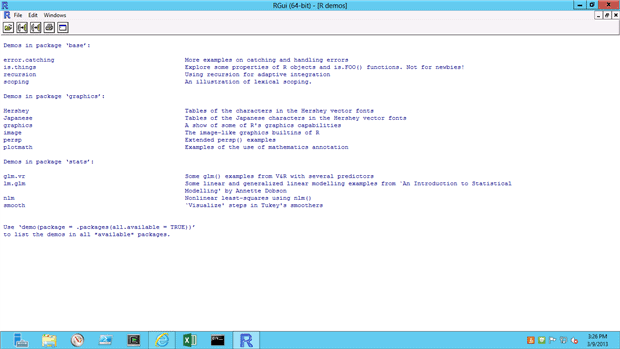
When you start R, you’re dropped in the main command line environment. For help, you can simply type help(). You can also type demo() for a few demonstrations in the main package, but if you’re not working with statistics a great deal, many of the topics may not be helpful.
The key to working with R is to realize that everything is a “vector” (a kind of linear array), and that the primary method of working with symbols, constants and variables is through assignment. This is similar to Lisp or other recursive, function-heavy languages.
But this is a bit esoteric. Let’s take a concrete example, from the “sample session” in the R documentation.
At the R console, type the following commands:
|
1 2 3 |
x <- 1:10 w <- 1 + sqrt(x)/2 w |
This reads as follows: “Assign the values 1 through 10 to the 1-dimensional array “x”.”
The variable “x” (a vector, technically) now holds (1,2,3,4,5,6,7,8,9,10).
The second line reads “Assign 1 plus the square root of “x” divided by 2 to the array “w”.”
The vector w now holds the approximate values of (1.5, 1.7, 1.8, 2.0, 2.1, 2.2, 2.3, 2.4, 2.5, 2.58). This is called the weighted standard deviation for each value, which is a value that helps you understand how well you can trust the number as an average – more at http://www.gla.ac.uk/sums/users/kev/Height_and_Weight/stdev2.html.
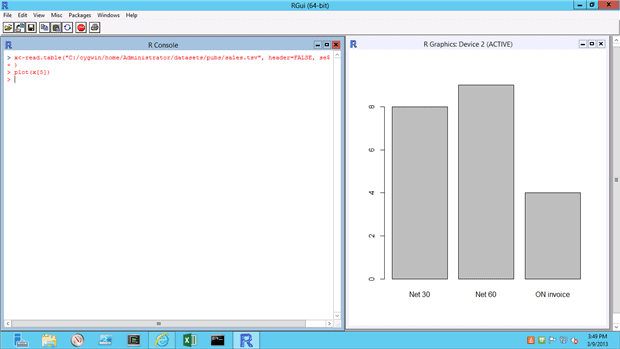
While this is all well and good, how can R directly assist you in your day to day job? Let’s return to the pubs sample database tables we exported to tab-separated files a few articles back. Assuming that you have that done, change the path below (but not the forward-slashes) and run this line:
|
1 |
x <- read.table("C:/cygwin/home/bwoody/datasources/pubs/sales.tsv", header = FALSE, sep = "\t") |
This line reads:
“Assign vector “x” the contents of the file sales.tsv. Ignore any headers, and it’s tab-separated”.
So far, so good. But what can we do with it?
For one thing, we could see the statistical spreads and data within the set. But we can also simply create a quick chart using the 5th position of the data – when indicates the invoice was due:
|
1 |
plot(x[5]) |
And we get something that looks like this:
And of course R does much more. You can read data from the web, such as the stocks for Microsoft as in this example:
|
1 |
stocks <- read.csv("http://ichart.yahoo.com/table.csv?s=MSFT&a=0&b=1&c=2006%20&d=0&e=31&f=2012&g=w&ignore=.csv") |
And then plot the dates and closes for the stock:
|
1 |
plot(stocks$Date, stocks.Close) |
The “stocks” vector has headers that can be referenced, such as the .Date and .Close in this example.
R Studio IDE
I don’t always use an Integrated Development Environment for console-based applications, but I really like the R Studio package. You can find it here: http://www.rstudio.com/ The installation is very straightforward, and will locate your R environment automatically.
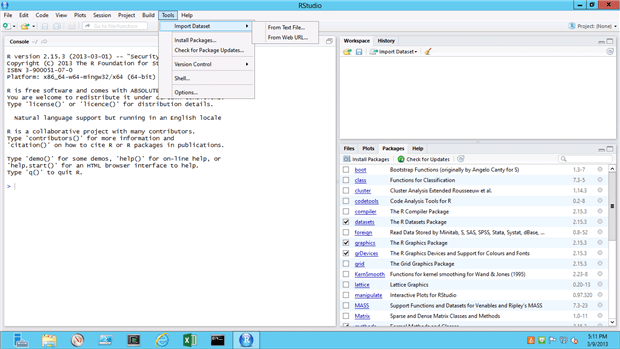
I find it especially helpful for reading data from various locations (as opposed to typing them out) and locating and installing new packages to work with.
References:
- If you’re new to statistics, there are many places to learn online for free. The Kahn Academy is one, and stattrek is another one I recommend quite often. I also use the book “Statistics the Easy Way” by Douglas Downing as a good place to start.
- There’s a great quick tutorial on R here:
- For a more in-depth course, UCLA has a free set of resources you can access here:
In the next installment, I’ll cover programmatic methods and tools that I’ll work with on the laboratory.
Load comments