
SQL Server’s graph tables (node tables and edge tables, introduced in 2017) let you model and query graph-structured data natively, but populating them with realistic test data often means typing dozens or hundreds of INSERT statements by hand.
This article shows a faster workflow: draw the graph visually in yEd – a free graph modeling tool – export it as TGF (Trivial Graph Format, yEd’s simple text export), and parse the TGF file in T-SQL to generate INSERT statements for both the node table and the edge table automatically.
The approach reduces a tedious manual task to a few-minutes workflow and keeps the visual representation and the database representation in sync. Suitable for creating demo data for presentations, loading reference graphs from published datasets, or bootstrapping a graph database from an existing diagram.
As I am starting to prep for writing about graphs in SQL Server, I have reached the most challenging part of the process… demo data. That’s right, the code, the words, etc., all so much easier than making an example that demonstrates everything you want it to and has an easy way to present it (and is malleable for when you realize you forgot about a case that you meant to cover but have spent 10 hours honing your point already). For some of the data in the book, I have created data generators that will spit out huge amounts of data to test performance, but most of the sample data needs to be interesting to the reader to go beyond the technical details and into the problem being solved and give them a story to hand the concept on.
To visualize graphs for my Database Design book and blogs, I have been using a tool name yEd (https://www.yworks.com/products/yed) that does a pretty great job of letting you visualize a graph. For example, say I have drawn the following graph to cover the fairly simple test case:
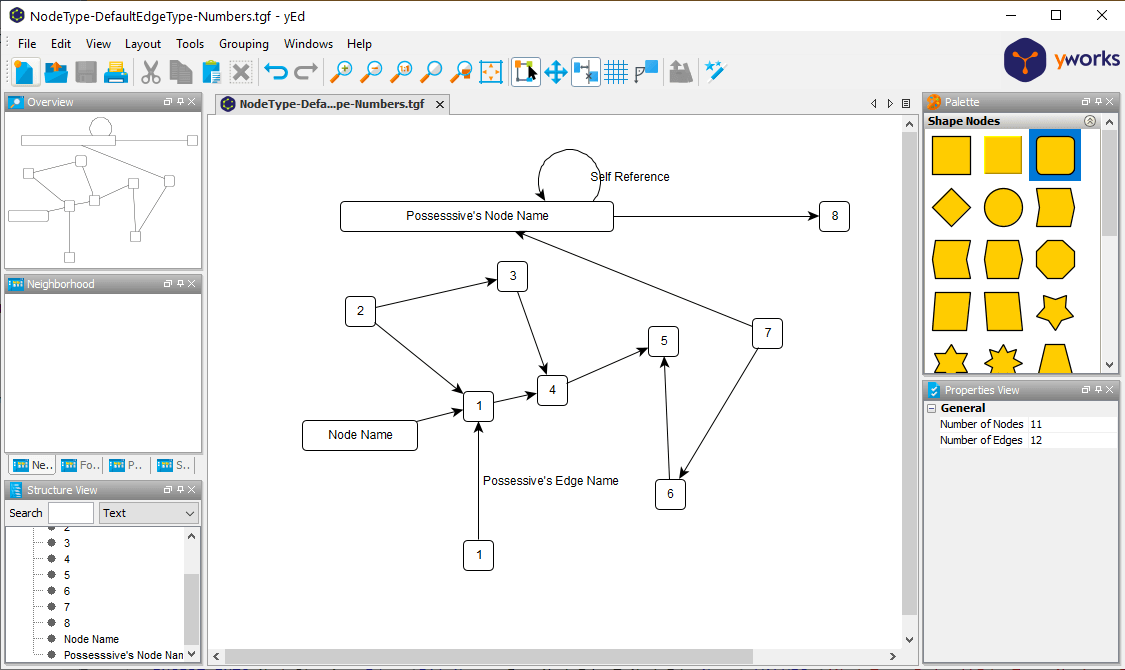
The problem was, if I wanted to recreate this graph in data, I had to type in a bunch of SQL statements (something I generally enjoy to a certain point, but one of my sample files cover the geography of Disney World, and it would take a very long time to manually type that into a database as it took quite a while just to do one section of the park).
So I went hunting for a tool to do this for me, but ended right back with yEd. The default file type when you save in yEd is GraphML, which is basically some pretty complex XML that was well beyond my capabilities using XML in SQL or Powershell. Realistically I don’t care that much about anything other than just the nodes and edges, and what I found was that you can save graphs in the tool a format named Trivial Graph Format (TGF). TGF is a very simple format that you can read more about here (https://en.wikipedia.org/wiki/Trivial_Graph_Format) but from that article, but format is simply:
|
1 2 3 4 |
1 First node 2 Second node # 1 2 Edge between the two |
Be careful to not save the graph as TGF only, unless you are fine having to reformat constantly. This is only the nodes and edges with name data, so when you open the TGF file in yEd, all the nodes will be on top of each other.
The node and edge names are optional, and while I would not desire to have empty node names (and my importer will fail if that occurs), my plan for the a model will be that, all nodes will be the same type, but edge types could vary. For example, say you have this basic structure:
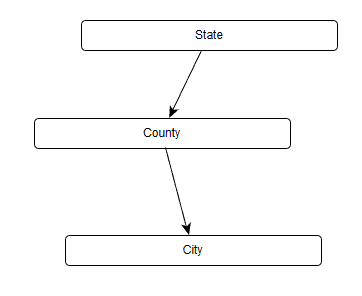
Each of these edges represents a containership, so I don’t want to enumerate that on the diagram. However, if I add another municipality to the graph, I might want to say it is adjacent to another node, so I model the following, giving the edge a name.:
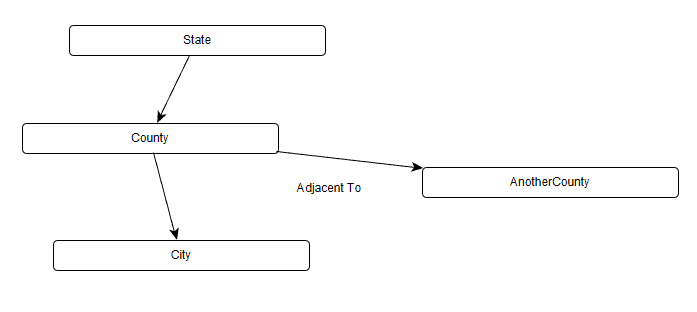
To do this extra metadata, I will use a filename pattern of “NodeType-DefaultEdgeType-Description or Uniqueifier” (the Uniqueifier basically is there to make because we might have duplicate node types and edges, but all the file names obviously have to be unique.
Going back to my original model, it is stored in the TGF file as:
|
1 2 3 4 5 6 7 8 9 10 11 12 13 14 15 16 17 18 19 20 21 22 23 24 |
1 1 2 2 3 1 4 3 5 4 6 Node Name 7 7 8 6 9 5 10 Possesssive's Node Name 11 8 # 4 5 3 5 2 3 2 4 1 3 Possessive's Edge Name 6 3 5 9 8 9 7 8 7 10 10 10 Self Reference 10 11 |
Simple enough, but it does have a few complexities in the parsing. All of the fields in this file are space delimited, but the names have spaces in them… Not a terribly large deal, but it did make it more interesting.
To solve the problem, I decided to make some reasonably primative Powershell that could take a directory of TGF files and import them into SQL Server. I stopped short of automatically importing the data, but instead made the code generate a set of SQL Files that create a staging table and insert the data. I didn’t make it a module or function, but just a simple ps1 script to run interactively (hardcoding directories) as this is the kind of process that if you need to do something similar, you probably will make a change or two. (And adding automatic inserting of the data would not be terribly difficult, but typically wouldn’t be necessary).
I will include the Powershell code at the end of the post (and provide a link to github to fetch it), but the output is most interesting. The first block creates the tables if they don’t exist in your database (a USE statement is added and is parameterizable in the ps1 file), and a DELETE statement removes data from a file of the same name (for when you are running this over and over getting it just right):
Note: the code was formatted using SQL Prompt, it is a lot more spread out from the generator.
|
1 2 3 4 5 6 7 8 9 10 11 12 13 14 15 16 17 18 19 20 21 22 23 24 25 26 27 28 29 30 31 32 33 34 35 36 37 38 39 40 41 42 |
USE tempdb; GO SET NOCOUNT ON; GO --create the schema and tables if they have not been created in the schema you chose IF NOT EXISTS ( SELECT * FROM sys.schemas WHERE schemas.name = 'NodeStaging') EXEC('CREATE SCHEMA NodeStaging'); GO IF NOT EXISTS ( SELECT * FROM sys.tables WHERE tables.object_id = OBJECT_ID('NodeStaging.Node')) CREATE TABLE NodeStaging.Node ( Filename nvarchar(200) NOT NULL, NodeId int NOT NULL, Name nvarchar(100) NOT NULL, NodeType nvarchar(100) NOT NULL, PRIMARY KEY( Filename, NodeId) ); GO IF NOT EXISTS ( SELECT * FROM sys.tables WHERE tables.object_id = OBJECT_ID('NodeStaging.Edge')) CREATE TABLE NodeStaging.Edge ( Filename nvarchar(200) NOT NULL, FromNodeId int NOT NULL, ToNodeId int NOT NULL, EdgeType varchar(100) NULL ); GO --delete previous data staged from this filename to let this run repeatedly DELETE FROM NodeStaging.Node WHERE Node.Filename = 'NodeType-DefaultEdgeType-Sample'; GO DELETE FROM NodeStaging.Edge WHERE Edge.Filename = 'NodeType-DefaultEdgeType-Sample'; GO |
Next there are two sets of inserts. Nodes:
|
1 2 3 4 5 6 7 8 |
--Nodes INSERT INTO NodeStaging.Node (FileName, NodeId,Name,NodeType) VALUES ( 'NodeType-DefaultEdgeType-Sample',1,'1','NodeType'); INSERT INTO NodeStaging.Node (FileName, NodeId,Name,NodeType) VALUES ( 'NodeType-DefaultEdgeType-Sample',2,'2','NodeType'); INSERT INTO NodeStaging.Node (FileName, NodeId,Name,NodeType) VALUES ( 'NodeType-DefaultEdgeType-Sample',3,'1','NodeType'); … |
And then edges:
|
1 2 3 4 5 6 7 8 |
--Edges INSERT INTO NodeStaging.Edge (FileName, FromNodeId, ToNodeId, EdgeType) VALUES ('NodeType-DefaultEdgeType-Sample',4,5, COALESCE (NULL,'DefaultEdgeType')); INSERT INTO NodeStaging.Edge (FileName, FromNodeId, ToNodeId, EdgeType) VALUES ('NodeType-DefaultEdgeType-Sample',3,5, COALESCE (NULL,'DefaultEdgeType')); INSERT INTO NodeStaging.Edge (FileName, FromNodeId, ToNodeId, EdgeType) VALUES ('NodeType-DefaultEdgeType-Sample',2,3, COALESCE (NULL,'DefaultEdgeType')); … |
The final bit of code shows you the data for your imported nodes:
|
1 2 3 4 5 6 7 8 9 |
--Queries to output the nodes that have been created SELECT * FROM NodeStaging.Node WHERE Node.Filename = 'NodeType-DefaultEdgeType-Sample' SELECT * FROM NodeStaging.Edge WHERE Edge.Filename = 'NodeType-DefaultEdgeType-Sample' ORDER BY Edge.FromNodeId,Edge.ToNodeId GO |
Run this code with the sample file, the output is:
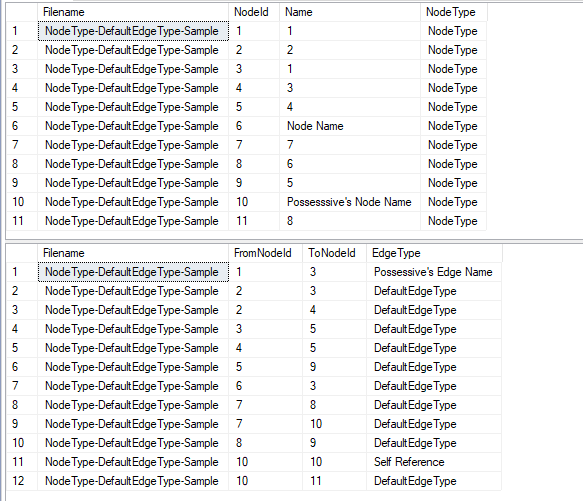
Now I can use this data to easily load a set of nodes in a tree, using SQL Graph or an adjacency list.
The following code (and two sample files, one that is the first graph in the blog, the second a subgraph of that graph) is available here: https://github.com/drsqlgithub/TGFImport/:
|
1 2 3 4 5 6 7 8 9 10 11 12 13 14 15 16 17 18 19 20 21 22 23 24 25 26 27 28 29 30 31 32 33 34 35 36 37 38 39 40 41 42 43 44 45 46 47 48 49 50 51 52 53 54 55 56 57 58 59 60 61 62 63 64 65 66 67 68 69 70 71 72 73 74 75 76 77 78 79 80 81 82 83 84 85 86 87 88 89 90 91 92 93 94 95 96 97 98 99 100 101 102 103 104 105 106 107 108 109 110 111 112 113 114 115 116 117 118 119 120 121 122 123 124 125 126 127 128 129 130 131 132 133 134 135 136 137 138 139 140 141 142 143 144 145 146 147 148 149 150 151 152 153 154 155 156 157 158 159 160 161 |
####################################################################################### ## Louis Davidsson drsql@hotmail.com ## Use at your own risk. Produces SQL script files from TGF files. ## Parameters $directory = "E:\TGF Files\" #Location of the TGF files for importing $outputDirectory = "E:\TGF Files Output\" #directory where the .SQL files are sent #Configuration $StagingDatabase = 'Tempdb' #Defaulted to tempdb so someone doesn't add objects to master or some other database and #it be my fault $StagingSchema = 'NodeStaging' $filter = "*.TGF" #used to limit to certain file names #Debugging is easier with a lot of output, but mute normally $VerboseMode = $True $VerboseCountAnnounce = 100 ######################################################################################### $Files = Get-ChildItem $directory -Filter $Filter "Processing directory: $directory for '.TGF' files" if ($VerboseMode) { "" "Import start time: $(Get-Date)" } for ($i = 0; $i -lt $files.Count; $i++) { $Request = $files[$i].FullName #file to be processed $BaseName = $files[$i].BaseName #filename without path or extension to identity data in import #filename should include NodeType-DefaultEdgeType-Unique, identifying info.tgf $NodeType, $EdgeType = $BaseName.split('-')[0,1] #some output for testing if ($VerboseMode) { "" "Processing file:" + $Request } #sql file that will be put out for the import $OutputFile = $outputDirectory + $BaseName + '.SQL' #code to create the staging table if required. #filename is included so you can have > 1 copy of the same #graph imported $WriteThis = " USE $StagingDatabase; GO SET NOCOUNT ON; GO --create the schema and tables if they have not been created in the schema you chose IF NOT EXISTS (SELECT * FROM sys.schemas where name = '$StagingSchema') EXEC ('CREATE SCHEMA $StagingSchema') GO IF NOT EXISTS (SELECT * FROM sys.tables where object_id = OBJECT_ID('$StagingSchema.Node')) CREATE TABLE $StagingSchema.Node (Filename nvarchar(200) NOT NULL, NodeId int NOT NULL, Name nvarchar(100) NOT NULL, NodeType nvarchar(100) NOT NULL, PRIMARY KEY (FileName, NodeId)) GO IF NOT EXISTS (SELECT * FROM sys.tables where object_id = OBJECT_ID('$StagingSchema.Edge')) CREATE TABLE $StagingSchema.Edge (Filename nvarchar(200) NOT NULL, FromNodeId int NOT NULL, ToNodeId int NOT NULL, EdgeType varchar(100) NULL) GO --delete previous data staged from this filename to let this run repeatedly DELETE FROM $StagingSchema.Node WHERE Filename = '$BaseName' GO DELETE FROM $StagingSchema.Edge WHERE Filename = '$BaseName' GO --Nodes" #Write the start of the file, clobbering existing file $WriteThis | Out-File -FilePath $OutputFile #-NoClobber $RowCount = 0; $Section = "Nodes"; #RowCount is just for progress monitoring if it is a very large file. #The first section of the TGF file is the nodes. The second is edges, denoted by a row with "#" #read in the file, row by row $reader = [System.IO.File]::OpenText($Request) while ($null -ne ($line = $reader.ReadLine())) { #in the TGF file, it has nodes first, then edges. This changes us to edges when we reach # if ($line -eq '#') { if ($VerboseMode) { "Changing to Edges" } $Section = "Edges" $WriteThis = "`r`n--Edges" $WriteThis | Out-File -FilePath $OutputFile -Append } else { $line = $line + " " * 100 #added 100 space characters to make the substring easier if ($Section -eq "Nodes") { #pull the node name out of the string $NodeName = $line.Substring($line.indexOf(' '), 100 ).trim() #Make name safe for output if it has an ' in it $NodeName = $NodeName.Replace("'","''"); $NodeType = $NodeType.Replace("'","''"); #write the Node $WriteThis = "INSERT INTO $StagingSchema.Node (FileName, NodeId,Name,NodeType) `r`n" + "VALUES ( '$BaseName'," + $line.Substring(0, $line.indexOf(' ')).trim() + ",'" + $NodeName + "','" + $NodeType + "');" $WriteThis | Out-File -FilePath $OutputFile -Append } else { #Write the Edge #Parsing this line is not as simple as using split because the third part of the line is #the name and the name can have spaces (and the fields are split on space) #From Node is Simple, char 0 to first space $WriteFromNodeId = $line.Substring(0, $line.indexOf(' ')).trim() #get the value after the from node. it may or many not have additional information after it $AfterFromNode = $line.Substring($line.indexOf(' ') + 1, 100 ) #pad for the substring $AfterFromNode = $AfterFromNode + " " * 100 #Get the numeric surrogate of the from node for the insert $WriteToNodeId = $AfterFromNode.Substring(0, $AfterFromNode.indexOf(' ')).trim() #Fetch any additional data from the string, and trim it $AdditionalInfo = $AfterFromNode.Substring($line.indexOf(' ') + 1, 100 ).Trim() #if the data has no length, set it to NULL in the output if ($AdditionalInfo.Length -eq 0) { $AdditionalInfo = 'NULL' } ELSE { #otherwise, add single quotes and double up single quotes $AdditionalInfo = "'" + $AdditionalInfo.Replace("'","''") + "'" } #double up single quotes and surround by a ' $DefaultEdgeType = "'" + $EdgeType.Replace("'","''") + "'" #Edgetype is defaulted to the edge name, or the default $WriteEdgeType = "COALESCE (" + $AdditionalInfo.Trim() + "," + $DefaultEdgeType.Trim() + ")"; #The script to output the edge $WriteThis = "INSERT INTO $StagingSchema.Edge (FileName, FromNodeId, ToNodeId, EdgeType) `r`n" + "VALUES ('$BaseName'," + $WriteFromNodeId + "," + $WriteToNodeId.trim() + ", " + $WriteEdgeType + ");" #write this line $WriteThis | Out-File -FilePath $OutputFile -Append } } if ($VerboseMode) { if ((($Rowcount + 1) % $VerboseCountAnnounce) -eq 0) { "Processed " + $RowCount + " lines in the file" } } $RowCount++; } $WriteThis = " GO --Queries to output the nodes that have been created SELECT * FROM NodeStaging.Node WHERE Node.Filename = '$BaseName' SELECT * FROM NodeStaging.Edge WHERE Edge.Filename = '$BaseName' ORDER BY Edge.FromNodeId,Edge.ToNodeId GO " #Write the start of the file, clobbering existing file $WriteThis | Out-File -FilePath $OutputFile -Append if ($VerboseMode) { "Finished file:" + $Request + " with " + $RowCount + " lines. Wrote script to " + $OutputFile } } if ($VerboseMode) { "" "Import End time: $(Get-Date)" "" } |
Hop this is a help as you start using graph tables also. If you are keen to export a graph, Arvind Shyamsundar has the basis of that code in a project that was done to visualize Pass Summit sessions in 2017, to output the graph as a GRAPHML file. (https://deep.data.blog/2017/11/03/how-we-did-it-pass-2017-summit-session-similarity-using-sql-graph-and-python/) .
This document contains proprietary information and is protected by copyright law.
Copyright © 2026 Red Gate Software Limited. All rights reserved


Load comments