The Underground Map of Redgate Monitor
The "metro map" of Redgate Monitor, with sightseeing tips and essential stops along every line....
Original concept and design: Phil Factor.
Download the Map as a PDF wallchart: UndergroundMapOfSQLMonitor
Download the Map in SVG format: UndergroundMapOfSQLMonitorSVG
Highlights of Monitor Town
Sightseeing tips and essential stops along every line….
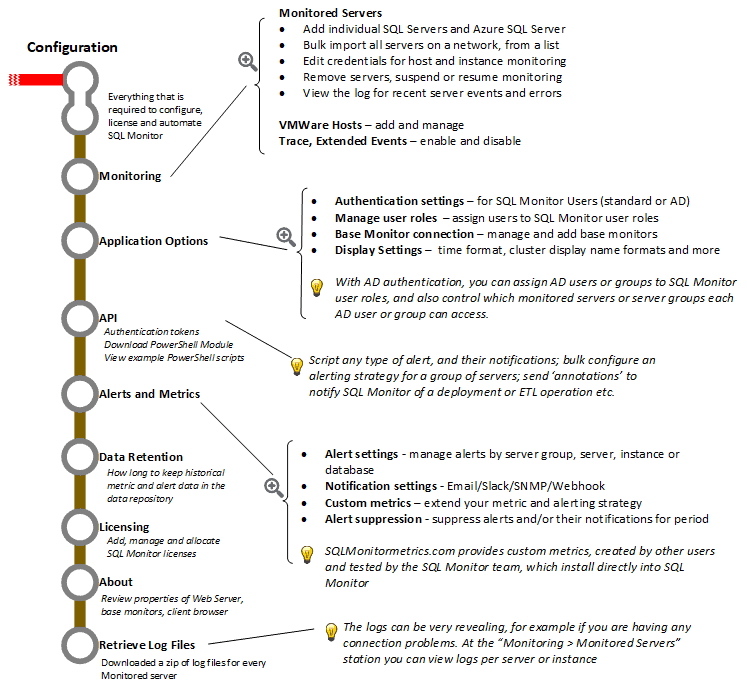
The Configuration “line” of Redgate Monitor is where you go to manage monitored servers and Redgate Monitor users, to configure, customize and automate your monitoring and alerting strategy, for each server, manage your licenses, investigate errors and more.
Download the Configuration Map as a PDF: MonitorConfiguration
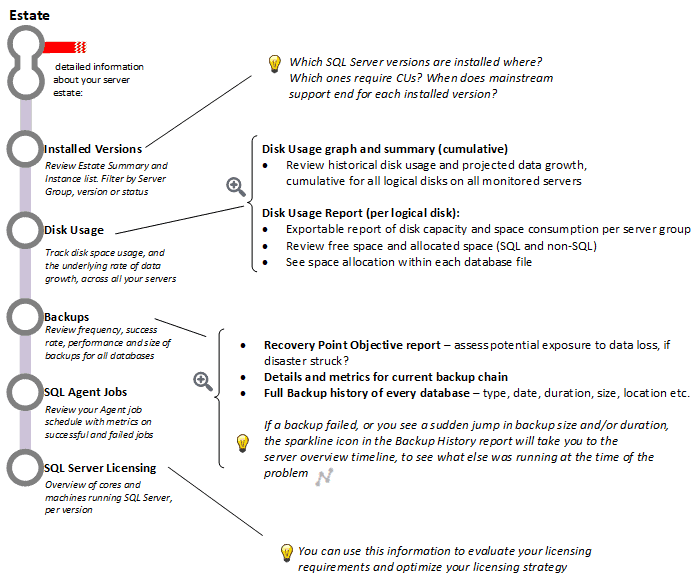
Time spent exploring the Estate line will help DBAs to monitor and safeguard the security, stability and availability of all servers in their care.
Download the Estate Map as a PDF: Estate
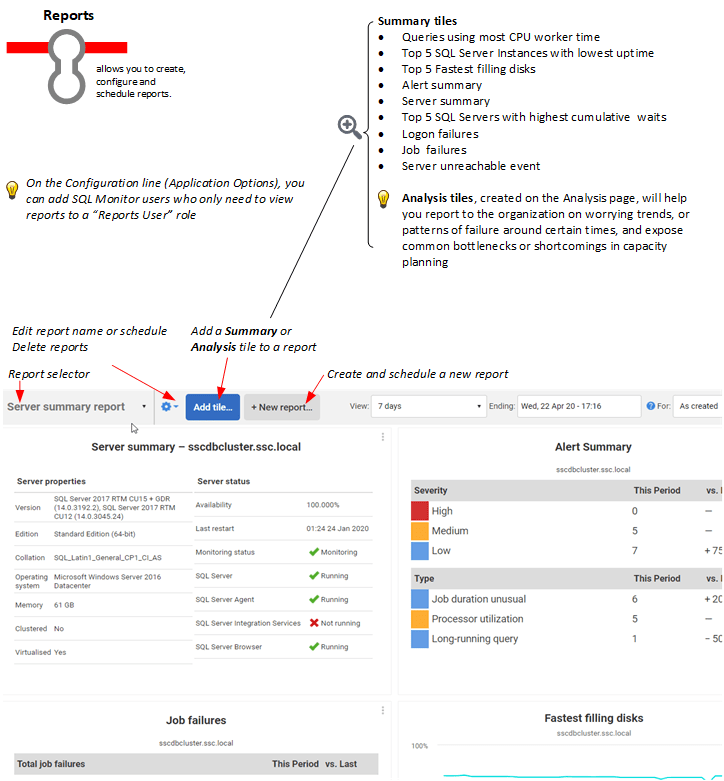
Stop off at Reports to create, configure and schedule reports to share with others in your organization.
Download the Reports Map as a PDF: Reports
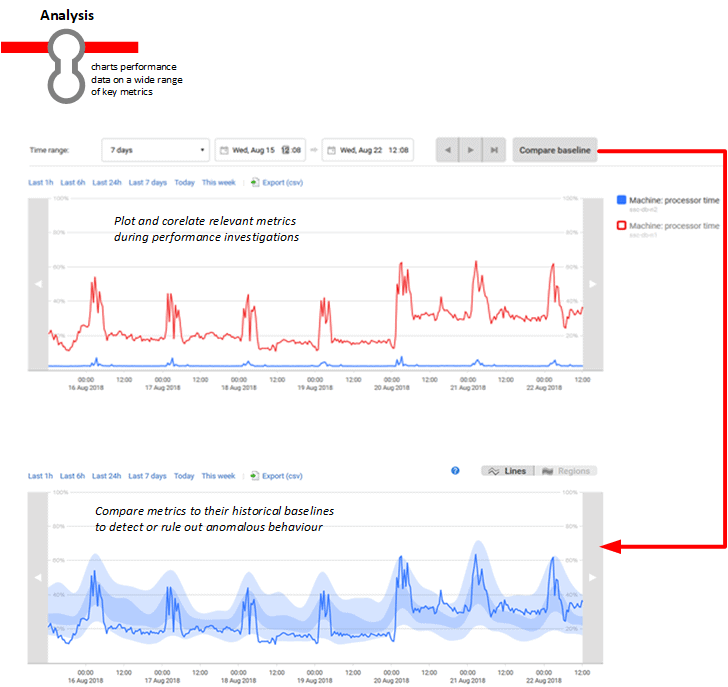
Any metric sparkline in Redgate Monitor provides a connection over to the Analysis page, where you can plot graphs showing the behavior of a group of metrics, around the time of slow performance, or a specific problem. This will help you expose the root cause of common bottlenecks, spot worrying trends, or patterns of failure around certain times.
Download the Analysis Map as a PDF: Analysis
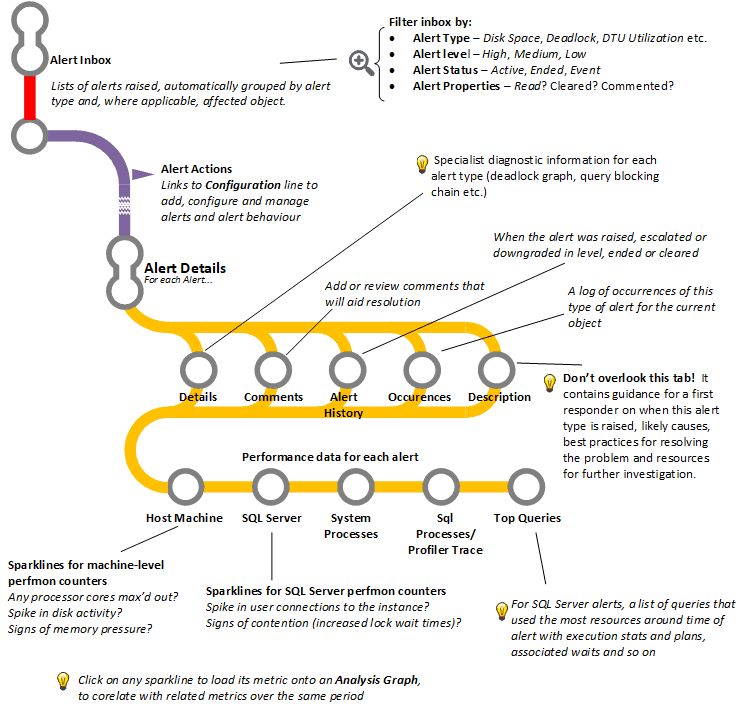
Teams will visit the Alerts Inbox most days, in order to investigate and resolve problems that arise on any SQL Server. These might include: resource bottlenecks (CPU, memory or I/O issues); disk space warnings; failed backups and other scheduled jobs; slow performance, such as caused by ‘blocking’ or other other query problems; specific SQL Server errors, such as deadlocks. The Alert Details provide specialist diagnostics for each alert type and the Performance data for each alert tell you what was happening on the server and instance during and around the time the alert was raised.
Download the Alerts Map as a PDF: Alerts
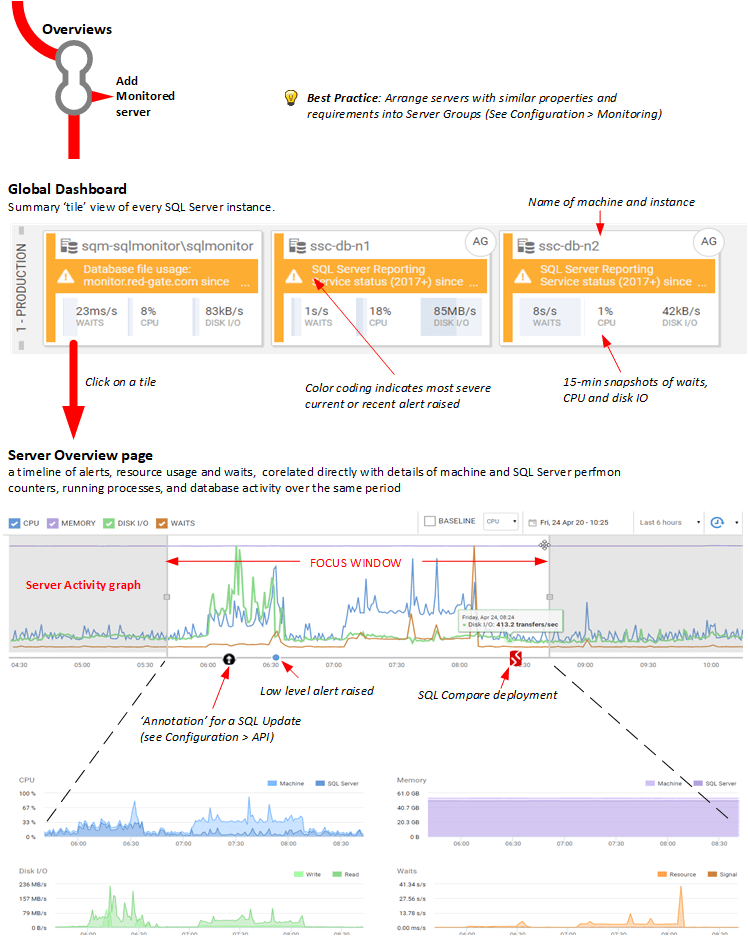
The Overviews line is to Redgate Monitor what the Central line is to London or the A-train to New York City. It is where you can review any problems that arise, directly within the context of server activity over that period.
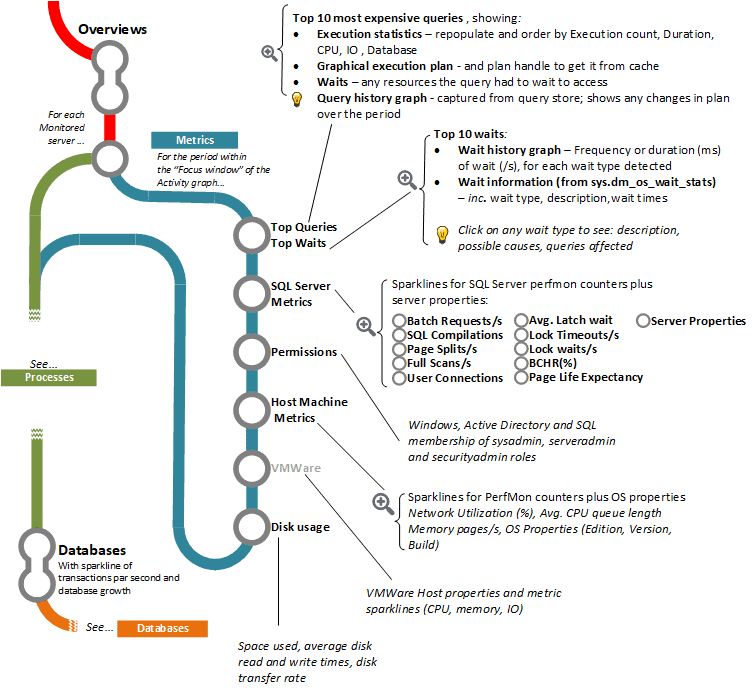
The Metrics branch of the Overview line…
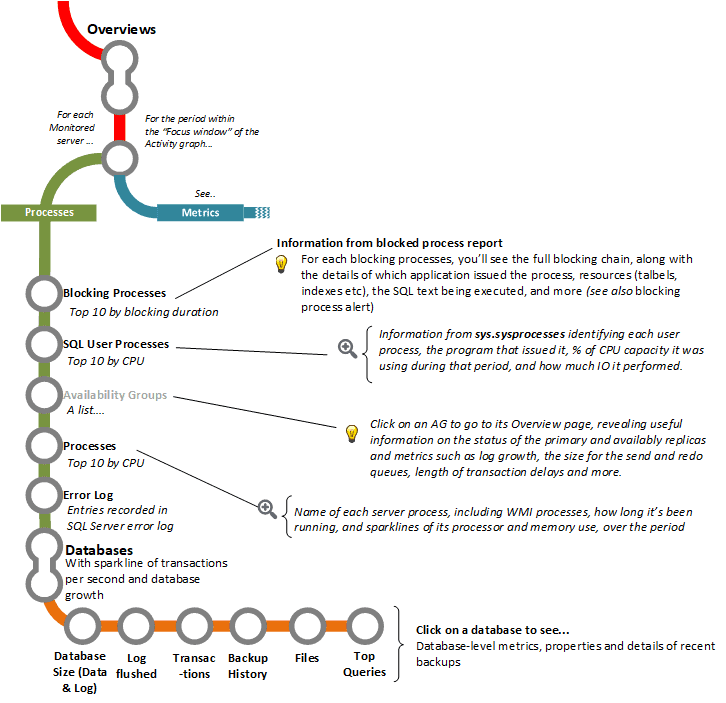
The processes and databases branches of Overviews…
Download the Overviews Map as a PDF: Overviews
Tools in this post
Redgate Monitor
Real-time multi-platform performance monitoring, with alerts and diagnostics


