
- The SQL Server 2016 Query Store – Part 1: Overview and Architecture
- The SQL Server 2016 Query Store – Part 2: Built-In Reporting
- The SQL Server 2016 Query Store – Part 3: Accessing Query Store Information Using DMVs
- The SQL Server 2016 Query Store – Part 4: Forcing Execution Plans Using the Query Store
- The SQL Server 2016 Query Store – Part 5: Analyzing Query Store Performance
With the release of the first Community Technology Preview (CTP) of SQL Server 2016 we were finally able to play around with one of the most anticipated new features, the Query Store. In this series of articles wel take a look at every aspect of the Query Store, how it can give you valuable performance insights and even increase query performance!
In this final article in the Query Store series we will take a look at the price of all these great new features when we analyze the performance of the Query Store.
Query Store performance impact
At the time that I write this, all that we know so far about the Query Store and its impact on performance is based on information from Microsoft and our own tests. This isn’t very strange since SQL Server 2016 isn’t released yet so we don’t have much information about Query Store performance on live SQL Server 2016 environments. This means that inside this article we cannot specifically tell you how much performance the Query Store will take, however, we can take a look at the various new performance counters that are related to the Query Store so you know what to monitor when implementing the Query Store in the future!
So far Microsoft has indicated that enabling the Query Store in SQL Server 2016 will result in a performance impact of 3-5% on average. A number of factors will determine how big the performance impact is: The amount of queries that are executed or unique queries that are compiled and executed within a set time-period will do so. We also know of some Query Store configuration options that also play a role in the performance impact of the Query Store, most notably the data flush interval option.
If you read the first article in the Query Store series, The SQL Server 2016 Query Store: Overview and Architecture, you would have seen that Microsoft put a lot of thought into the process of capturing and storing query runtime statistics and Execution Plans to minimize the impact of the capture of these metrics. By storing the query metrics and plans into memory first, expensive physical IOs to the storage subsystem are avoided. However, to persist the data, the Query Store will have to store it on the physical storage subsystem eventually and the frequency with which this occurs depends on the data flush interval setting. Flushing Query Store data quicker means more physical IOs to the storage subsystem, setting the flush interval to a higher value means less physical IOs but the downside is that it increases the chance of losing Query Store data when a SQL Server crash or restart occurs.
Let’s take a more detailed look at the way the Query Stores persists its data to the storage subsystem.
Asynchronous writes
The Query Store itself doesn’t persist the data it holds in memory to the storage subsystem. Instead it places the data inside an asynchronous queue. From there, an internal process will write the data inside the queue to the storage subsystem. By using this asynchronous queue, the writes are not directly processed but are, instead, scheduled and the Query Store process can continue without waiting for the data write to complete.
In the previous section, we said that the Data Flush Interval setting controls the interval at which the Query Store persists its data to the storage subsystem. However, this is not entirely true. As a matter of fact the Data Flush Interval only represents the interval that Query Store data is added to the asynchronous queue. After it is placed in the queue, the speed at which the data is persisted to the storage subsystem depends on the internal asynchronous writer process.
Another important thing to mention is that the Data Flush Interval only effects query runtime information. Query texts and Execution Plans are added to the asynchronous queue immediately to avoid data loss of those objects.
Because a picture says more than a thousand words, figure 26 shows the behavior above.
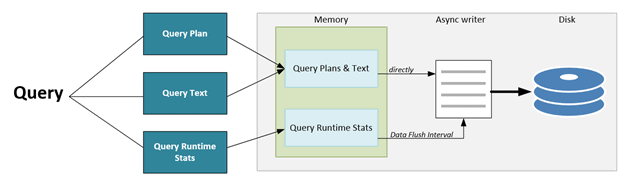
Figure 26 Query Store data movement
Query Store Perfmon Counters
With the release of the Query Store in SQL Server 2016, a number of new Windows Performance Monitor (Perfmon) counters were added that directly relate to the Query Store. All of these new counters can be found under the category SQLServer :Query Store as shown in Figure 27 below.
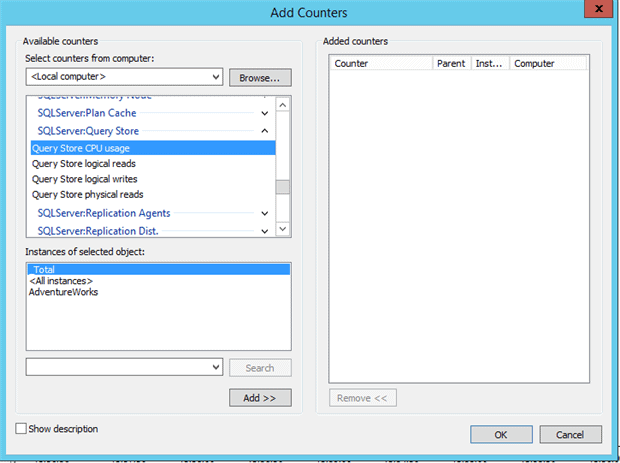
Figure 27 Query Store Perfmon counters
At the time of writing this article, there are four counters available to monitor Query Store performance through Perfmon:
- Query Store CPU usage
- Query Store logical reads
- Query Store logical writes
- Query Store physical reads
All of these new Query Store Perfmon counters can be selected per-database, for all databases or just the total.
Most of the Perfmon counters are pretty self-explanatory in what they monitor, though the Query Store logical writes counter deserves a bit more explanation. This counter can be used to monitor how much data is being queued in the asynchronous writer to be written to disk. The physical writes to the storage subsystem cannot be monitored through the Query Store Perfmon counters since these writes are not being performed by the Query Store. So if you want to track how much data the Query Store is queuing to write to disk, this is the counter you want to monitor.
Query Store Extended Events
Many new Extended Events that are related to the Query Store were added in SQL Server 2016, fifty-eight in SQL Server 2016 CTP3, allowing you to get a better idea of what the Query Store is doing underneath the hood or if it is running into any issues. Figure 29 below shows the list of the new Query Store Extended Events together with the description Microsoft gave them.
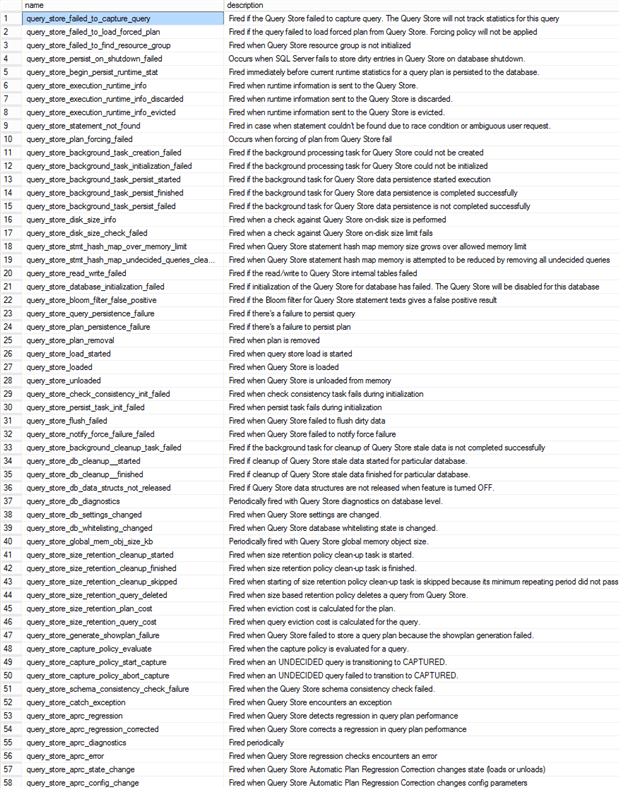
Figure 29 Query Store Extended Events
Query Store Wait Statistics
With every SQL Server version, new wait types become available that allow you to track extra resource waits. The Query Store also adds a number of new wait types, 17 in SQL Server 2016 CTP3, and they are easily identified through the QDS_ prefix in the wait type name as shown in Figure 30.
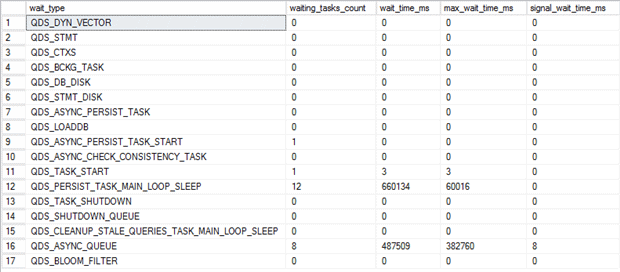
Figure 30 Query Store wait types
For now, none of these wait types are documented at all so we can only guess at their function.
So far it seems that two wait types are constantly being recorded by SQL Server, QDS_PERSIST_TASK_MAIN_LOOP_SLEEP and QDS_ASYNC_QUEUE. If you were to query the sys.dm_os_waiting_tasks DMV with the Query Store enabled you will definitely see these two wait types as shown in Figure 31.
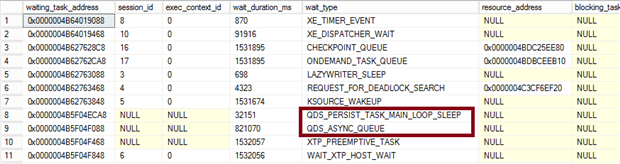
Figure 31 Query Store wait types in sys.dm_os_waiting_tasks
It seems that the QDS_PERSIST_TASK_MAIN_LOOP_SLEEP is a wait type that is constantly recording wait time, through a loop, while the Query Store is waiting to persist data. It seems to do this around every 60 seconds, since after 60 seconds the wait time inside the sys.dm_os_waiting_tasks DMV is reset to 0 again and the wait time inside the sys.dm_os_waiting_tasks is written to the sys.dm_os_wait_stats DMV.
The QDS_ASYNC_QUEUE behaves much in the same way, but it only seems to flush its wait times to the sys.dm_os_wait_stats DMV whenever either the configuration of the Query Store changed, SQL Server is restarted or the Query Store is flushed. By the name of this wait type, I am guessing it has something to do with the asynchronous queue we discussed earlier.
Summary
In this article we took a look at the performance impact of the Query Store. We went into more detail about how the Query Store persists its data, what Perfmon counters are available to monitor Query Store performance, Query Store related Extended Events and finally Query Store Wait Statistics.
Because SQL Server 2016, and thus the Query Store, hasn’t officially been released yet, it is difficult to see how much impact the Query Store will have on the performance of your SQL Server Instance. From what I saw so far during my testing, it doesn’t seem to have such a big impact, even when hundreds of concurrent connections are constantly firing random queries that the Query Store needs to process, but time will tell when more people will be working with SQL Server 2016 after its release.
This concludes the fifth, and final, article in the Query Store series. Hopefully this series of articles gave you a good idea what the Query Store is, how it works and the performance insight it can give you!
Load comments