
As mentioned on the simple-talk blog, Microsoft recently acquired Revolution Analytics, a leading commercial provider of software and services for the open source R programming language. IT Professionals are now more likely to encounter R as it is integrated into Microsoft’s platforms and is used in conjunction with other software.
Microsoft’s interest reflects that of the wider technology community where R has been growing in popularity in recent years. Oracle has contributed R packages and provides Oracle R Enterprise as a component of the Oracle Advanced Analytics Option of their database. Commercial support by large corporation demonstrates that R, though open source, provides significant commercial value. Scientists and academicians who have historically used the language have long recognized this and continue to comprise a significant number of R users.
Why R?
R has its origins in the S programming language created in the 1970’s. S was originally intended to simply be an interactive interface to well-used Fortran routines at Bell Labs. R was created as an open-source alternative in the 1990s. Since then R has been used by scientists, statisticians and more recently data scientists as a convenient environment for interactive exploratory data analysis.
But R is not limited to interactive sessions. Because it is a programming language, entire scripts can be created and packaged as libraries. Scripted solutions provide more consistent and reliable results than workflows that require a great deal of manual interaction with a graphical user interface. R has attracted a user base unlike many other general purpose programming languages. Many users of R are technically savvy but not from a traditional computer science or programming background. But those who work with R regularly often find themselves delving into programming to customize solutions to the problems they are pursuing.
This historical background explains how R has garnered a loyal community over the years, but does not demonstrate that it has any practical value or relevance today. And yet, R continues to be popular, and even is being adopted in settings where it was not previously used. Why would anyone choose R over a popular general-purpose programming language?
In fairness, R is often not considered a general-purpose programming language. It tends to be compared with specialized statistical products such as SAS, SPSS and Stata. It is frequently discussed when considering data manipulation using Excel spreadsheets or a relational database like SQL server. R is best used to manipulate moderately sized datasets, do statistical analysis and produce data-centric documents and presentations. It addresses a relatively specific niche, and there is no comparable technology that exhaustively covers the range of functionality available through R.
R’s popularity is largely due to its interactive nature, its expressiveness, and the extensive collection of third-party libraries created for it. These qualities together differentiate it from other popular programming languages and data analysis tools that are available today.
Installing R
R is distributed under a GNU General Public license as a Windows-style installer and is designed to be as close as possible to the same version on other platforms. It is a 54 Mb download from the CRAN (Comprehensive R Archive Network) site and will run on all current Windows operating systems. The distribution includes a text-based command-line version, R.exe, RScript.exe that is designed to be used in scripts and CMD batch files, and RGui.EXE, which provides both a command interface and a GUI. The R package can also be downloaded via Chocolatey (choco install r.project).
R is best used in conjunction with the RStudio Integrated Development Environment (IDE). The Desktop version is freely available for download from RStudio.com. To replicate the examples presented later in this article, two packages (ggplot2 and dply) must be installed. These can be installed using function calls within R, or by clicking the Packages tab and choosing to install each package using RStudio. The syntax to install the packages using function calls is as follows:
|
1 2 |
install.packages("dplyr") install.packages("ggplot2") |
This makes the packages available for use, but they need to be referenced within a script which will use them. These packages will be loaded into R when they are required in the examples below. Also note, R packages can contain not only code, but also other resources like documentation and sample data sets. The data sets referenced below are found in these two packages.
R’s Interactive Nature
Individual R expressions can be entered at a command line interpreter and an immediate response is produced.
|
1 2 |
mean(c(9, 7, 3, 1)) [1] 5 |
This example includes two function calls. The c() function combines its arguments into an R vector which is like an array in other programming languages. A vector contains variables of the same type, and casts all of its arguments automatically to the lowest common data type available to the arguments provided. The mean() function returns the arithmetic mean of the values in this vector which in this case is 5.
This illustration hints at why R is so popular among professionals who are looking for immediate results to calculations. With a single line of code, and a minimal number of characters, a calculation can be done. No special commands are required to compile or run a program to produce a result.
Calculating a mean is a trivial example, but R has built in capabilities that cover a wide range of mathematical and statistical functions. These are not available using SQL and are cumbersome if available at all in other general purpose programming languages. Recall that R includes a number of datasets within its packages. A list of data sets in the ggplot2 package can be displayed by calling the data function.
|
1 |
data(package='ggplot2') |
One of the data sets available is named mpg and contains fuel economy data for 38 models of car. You can load the ggplot2 package to make this data available within your R session and view the first few rows using the head command.
|
1 2 3 4 5 6 7 8 9 |
library(ggplot2) head(mpg) manufacturer model displ year cyl trans drv cty hwy fl class 1 audi a4 1.8 1999 4 auto(l5) f 18 29 p compact 2 audi a4 1.8 1999 4 manual(m5) f 21 29 p compact 3 audi a4 2.0 2008 4 manual(m6) f 20 31 p compact 4 audi a4 2.0 2008 4 auto(av) f 21 30 p compact 5 audi a4 2.8 1999 6 auto(l5) f 16 26 p compact 6 audi a4 2.8 1999 6 manual(m5) f 18 26 p compact |
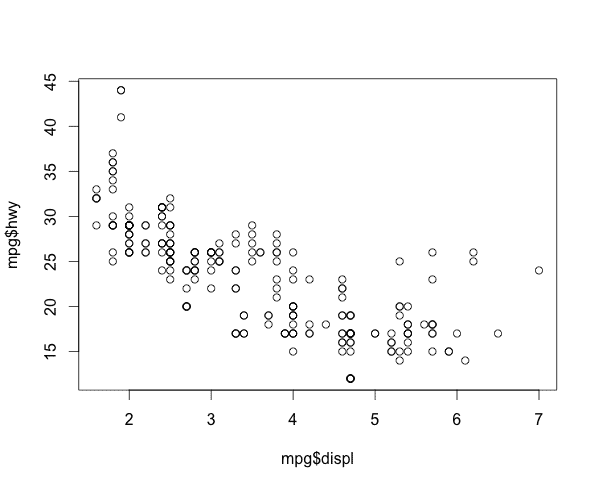
Suppose you wanted to perform a linear regression to determine the effect of engine displacement on gas mileage. A simple plot of the data using R base graphics results can be performed in a single line of code, specifying the x and y columns as the arguments.
|
1 |
plot(mpg$displ, mpg$hwy) |
Again, R’s interactive nature comes to the fore. Immediately a plot of the data is displayed.
A linear model can be fit and a summary generated in two lines of code.
|
1 2 3 4 5 6 7 8 9 10 11 12 13 14 15 16 17 18 19 20 |
fit<-lm(hwy ~ displ, mpg) summary(fit) Call: lm(formula = hwy ~ displ, data = mpg) Residuals: Min 1Q Median 3Q Max -7.1039 -2.1646 -0.2242 2.0589 15.0105 Coefficients: Estimate Std. Error t value Pr(>|t|) (Intercept) 35.6977 0.7204 49.55 <2e-16 *** displ -3.5306 0.1945 -18.15 <2e-16 *** --- Signif. codes: 0 '***' 0.001 '**' 0.01 '*' 0.05 '.' 0.1 ' ' 1 Residual standard error: 3.836 on 232 degrees of freedom Multiple R-squared: 0.5868, Adjusted R-squared: 0.585 F-statistic: 329.5 on 1 and 232 DF, p-value: < 2.2e-16 |
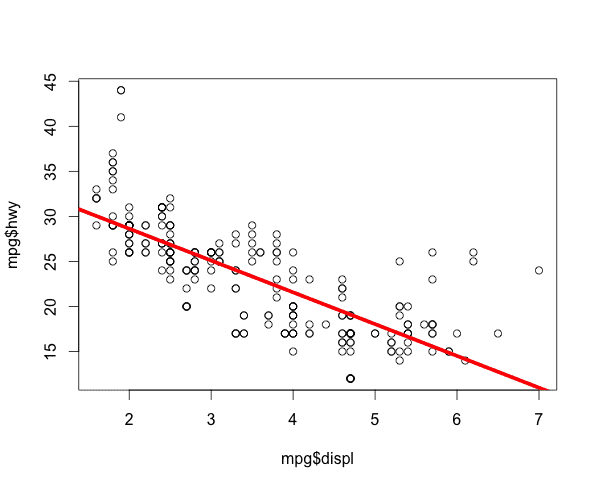
Even if you are not interested in this degree of statistical detail, the plot generated earlier can use this model to fit a regression line expressing the trend in the data.
|
1 |
abline(fit, col='red', lwd=5) |
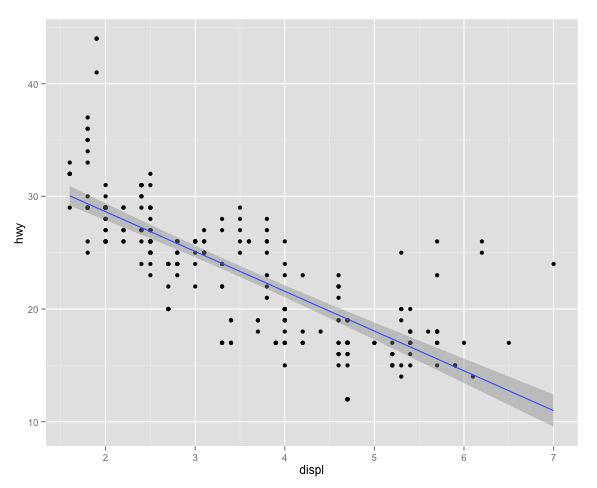
In R, there is often more than one way to perform the same task. Using the ggplot2 package graphics, the plot above can be created with different styling. The geom_smooth method does the linear regression calculation internally, so this listing is not dependent on the previous one.
|
1 2 3 4 |
library(ggplot2) ggplot(mpg, aes(displ, hwy)) + geom_point() + stat_smooth(method="lm") |
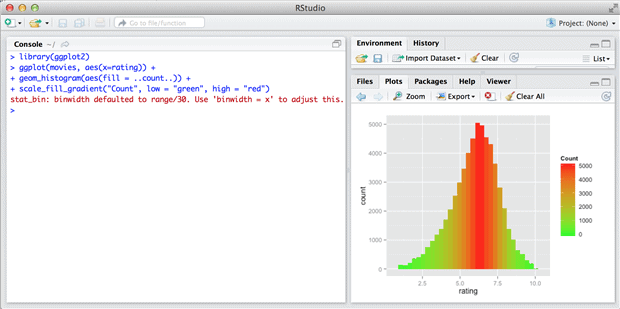
The interactivity of R is greatly increased when used in conjunction with the R Studio IDE. RStudio makes working with R easier by providing shortcut keys, code completion, window management, and graphical interactions that can be used instead of complex function calls. The following example shows how to create a histogram with a color gradient in only four lines of code. This example presumes the previous installation of the ggplot2 library to provide both the graphic capabilities and the data used to render the plot. The plot generated is a histogram which indicates the number of ratings that appear in the data set. Very few are at zero or 10, while the majority of the ratings center around the mean of 5.9. There are a larger number of values close to the mean, which appears in red, while the color gradually fades towards green at the lower and upper ends of the range where there are fewer ratings.
|
1 2 3 4 5 |
library(ggplot2) ggplot(movies, aes(x=rating)) + geom_histogram(aes(fill = ..count..)) + scale_fill_gradient("Count", low = "green", high = "red") |
RStudio can also be used to easily create HTML or PDF documents, and HTML based presentations from templates. It simplifies common processes like exporting images and importing and exporting data files. It provides visibility to a great deal of information about the R environment and the commands run interactively during a session. In short, RStudio further enhances the existing strength of R as an interactive environment for statistical analysis. It also enhances R’s ability to easily express complex concepts using simple expressions or interactions.
Using R in Batches
R is not limited to interactive execution. Scripts that involve a series of function calls can also be executed. Such scripts are saved with a “.R” extension by convention. The image shown above in RStudio can be generated by creating a script named movies.R with the following content.
|
1 2 3 4 5 6 7 |
library(ggplot2) ggplot(movies, aes(x=rating)) + geom_histogram(aes(fill = ..count..)) + scale_fill_gradient("Count", low = "green", high = "red") ggsave('movies.png') |
The one addition to the previous listing is a call to ggsave to save the image in a file named movies.png. The image is created by invoking the script using RScript (OSX) or RScript.exe (Windows). Note that depending upon your environment, you may need to specify the path to the RScript executable.
|
1 |
Rscript.exe movies.R |
R’s Expressiveness
The code snippet shown earlier also suggests something about R’s expressiveness.
|
1 2 |
mean(c(9, 7, 3, 1)) [1] 5 |
The notation is close to standard mathematical notation. There is very little extraneous syntax related to the design of the language.
This example also demonstrates why R is so frustrating to many professional programmers. The function name c() is short and not descriptive. The result is displayed beside a [1] because the result is also a vector of length one and the 1 indicates the index of the value being displayed. R has no notion of independent primitive values. An individual value is a single element contained within a vector.
The data types in use are significant, but not explicitly called out as in statically typed languages. Data type conversions occur automatically. This can be incredibly useful, but also confusing. In the following example, TRUE evaluates to 1, and both integers and decimals are included.
|
1 2 |
mean(c(9.0, 7, 3, TRUE)) [1] 5 |
These idiosyncrasies aside, R does “what you want” in many cases, particularly if the user is reasonably disciplined about writing clear code. Besides, R is often used in an interactive manner that involves crosschecking that helps to identify problematic code. In addition, third-party libraries can hide many low level details of the language from the average user. The dplyr library utilizes an operator (%>%) to stream the results of one function to the next in a manner like UNIX piping. In the following example, the movies dataset is filtered to select only animation movies longer than 120 minutes that were released in 2004. The title and rating of these movies is displayed.
|
1 2 3 4 5 6 7 8 9 |
library(dplyr) movies %>% filter(year == 2004 & Animation == 1 & length > 120) %>% select(title, rating) title rating 1 Incredibles, The 8.3 2 Steamboy 6.6 |
In this example, movies is a data frame in the local environment containing rows and columns. The syntax used by dplyr maps to concepts in SQL. In fact, dplyr can also be used in close conjunction with relational databases like SQLServer. When used in this manner, dplyr generates SQL behind the scenes to interact with the database.
R’s Extensive Collection of Third-Party Libraries
At the time of writing this article, R has over 6,000 packages that are freely available from CRAN (the Comprehensive R Archive Network) and numerous other packages and scripts can be found at Bioconductor and GitHub. These packages often provide simple APIs that function as Domain Specific Languages for experts working in a given field.
Because of R’s flexibility, and the nature of the language these packages can be challengingly diverse and inconsistent. Fortunately, largely because of the work of a few individuals, many packages are becoming more consistent in their structure and function. Hadley Wickham has created a number of popular packages related to data manipulation, plotting and the creation of R packages. The dplyr and ggplot2 libraries introduced earlier are among his best-known creations. In addition, the reshape, stringr and lubridate packages are extremely useful for standard data manipulation and processing of data frames. Most R users have a favorite group of packages that are geared towards their particular workflow and requirements. Though not part of the core language, they are inseparable from the language’s success.
Conclusion
R is a quirky yet powerful language and statistical environment that is making inroads in settings where increasingly sophisticated data processing is being performed. Simple tasks can be performed using a function call or two, yet R also provides the tools to allow statisticians and scientists with stringent mathematical and data processing needs. R will continue to grow in popularity among IT professionals as long as there is a need to reliably and efficiently produce business information from an ever increasing deluge of data.
This document contains proprietary information and is protected by copyright law.
Copyright © 2026 Red Gate Software Limited. All rights reserved
Load comments