Here at Red-Gate – as our tag-line states- we try to make our software ingeniously simple to use. This, I think, is what people *really* want. Faced with so many new ways of interacting with the computer, learning how to use a new tool can be a burden. With honourable exceptions (Apple and Google, in particular) no-one else seems to take this obvious but important message to heart. But we do, and so using our tools is usually a very smooth experience: point it at your desktop app, fire it up and you’ve got results. Lovely.
As a result, any exception to this rule sticks out like a sore thumb, and profiling SharePoint has been one such exception. We produced “How-To” documentation and, for a while, relied on this to help SharePoint developers. But I wasn’t happy with this; I knew the process could and should be made much easier. And we did just that – throw away that old manual! Following on from Andrew Woodward’s excellent article, I’ve created a pared-down version encouraging developers to once again use ANTS, because it now works like it always should have done: just point and click and you’ll get results.
Environment
The environment that I tested on is a virtual machine with the following application specifications:
- Windows 2003 Server, SP2 (32bit)
- Visual Studio 2008
- Microsoft Office SharePoint Server 2007
- SQL Server 2005
I have, informally, tested on Windows 2008, IIS7 and found the process and results identical.
Installing ANTS
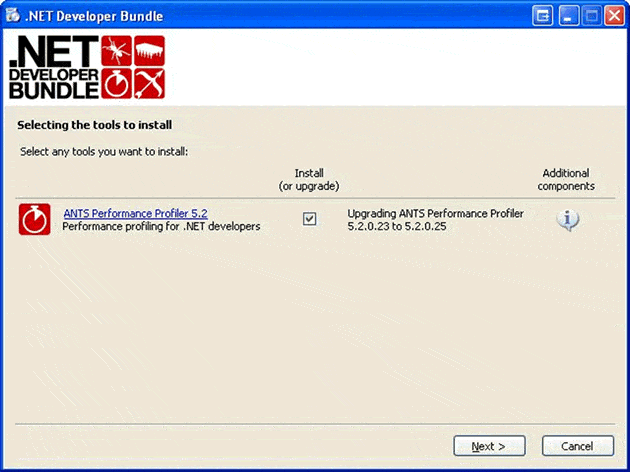
The latest version of ANTS, version 5.2, will install straight over any previous 5.x version (How many other vendors make upgrading this easy?). So, start the install and you’ll get confirmation of the upgrade process:
Click on the image for an enlarged view
Go ahead with all the defaults, unless you want to change the default install directory.
Setting Up SharePoint
There really is nothing special you need to do in SharePoint to ensure you get profiling results. The one remaining necessary configuration is to ensure that ANTS can read from a directory that the SharePoint app pool can write to. By default, this is set to whatever Windows identifies as the application data directory for the w3wp process, and this is usually the same as the local system account (which is sub-optimal, and precisely why it needs manually setting in this case).
The easiest way to do this is create a temporary directory somewhere innocuous (like C:\temp), allow the above permissions (or for expediency and, as long as you’re not on a sensitive system, just allow full control to everyone) and then set a user environment variable RGIISTEMP equal to this directory path. I even created a simple application to do this for you.
For the C# code to profile, I used the Mortgage Calculator web part from Microsoft – this has the advantage of being simple to deploy and actually quite useful in these times of fluctuating interest rates.
Profiling
Step 1:
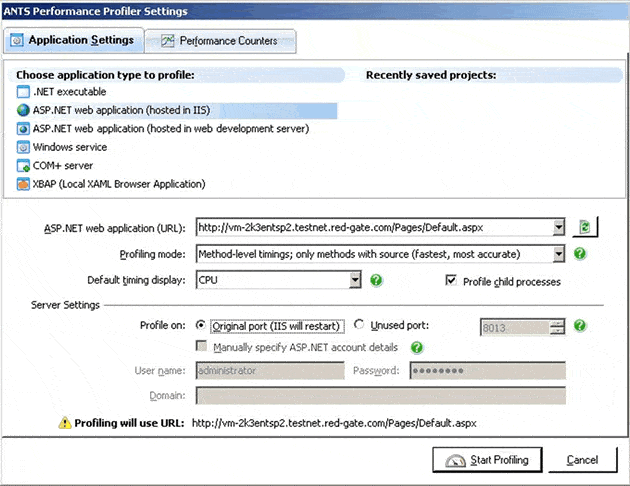
Click on the image for an enlarged view
- Fire up ANTS and select the option of “ASP.NET web application (hosted in IIS)”
- If you’re able to do an iisreset, then use the original port – otherwise select the “unused port” option
- Don’t manually specify ASP.NET account details
- And lastly, start with the “fastest, most accurate” profiling mode and later move on to “most detailed” (this way, you’ll save time – trust me!).
When you get comfortable with how ANTS works, feel free to choose different options, especially different performance counters: I/O stats can be particularly useful.
Step 2:
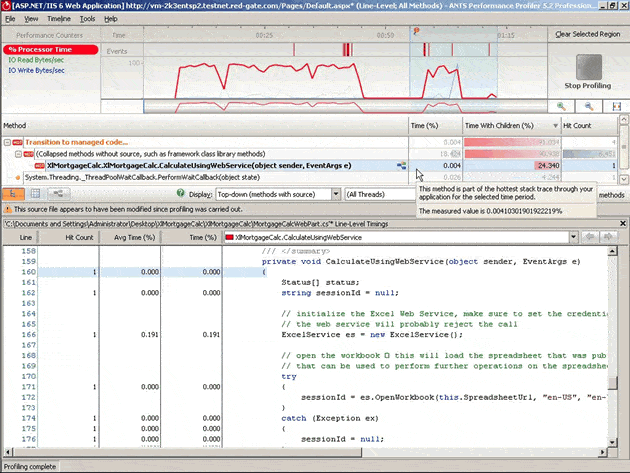
Click on the image for an enlarged view
When you’ve finished looking at the parts you want to test, just kill the original IE window or click the big blue “Stop profiling” button. ANTS will immediately point you to the most time-expensive code paths, but be sure to toggle between “CPU time” and “Wall-Clock time” and spot the difference. If you can’t see the methods you want then select the “methods view” button (one of three small grey buttons at the bottom left) and you’ll get the classic “spreadsheet” view, showing you all “significant” profiled methods. Not may clicks before you g0t useful data, right?
Interact with the timeline, focusing on the time sections that will contain your code; this filters out the data that you probably won’t be interested in (start-up routines, especially).
When you progress to the “most detailed” mode (i.e. line-level profiling), if your pdbs are accessible (see below), then you’ll get to see the performance of your code in situ (in source code view, F10). The default view will help you focus on the code which is taking the most time (the method highlighted in light blue). On the other hand…
Step 3:
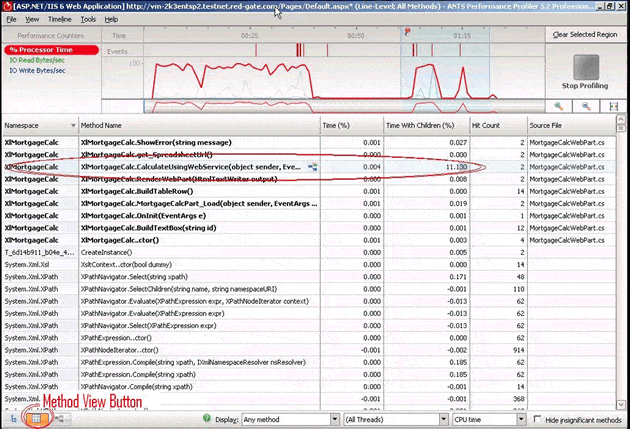
Click on the image for an enlarged view
… if you then select the Method View (bottom left button – see the screenshot above) and sort on the “Namespace” column, you’ll easily be able to see which of your methods are taking the most time by doing a simple comparison of the Time column values.
Some people prefer one view over the other, and ANTS gives you the choice with one simple click.
Using ANTS in this example, I could easily see that it wasn’t the rendering that was taking up the most time – it was initializing the ExcelService. This confirmed my suspicions: performance has dropped off considerably since 2003, I’m eagerly awaiting the updates in 2010!
And finally…
If you’re not seeing your source code, you may need to register your (source) assembly in the GAC (‘gacutil -i …’) and then add the corresponding pdb file to the same directory that the assembly ends up in.
*I know* that hardcoding IE as the browser is sub-optimal, but feel free to use you browser of choice once profiling has started – Just use the exact same URL.
You can download a free trial of ANTS Performance Profiler from Red Gate’s website and try it on your own application.


Load comments