
Usually, .NET developers don’t need to think too much about how their objects are being laid out in physical memory: after all, .NET has a garbage collector and so is capable of automatically removing ‘dead’ objects and rearranging memory so that the survivors are packed in the most efficient manner possible. The garbage collector has limits to what it can do, however; and when these limits are reached, then the runtime can exhaust memory in a way that is surprising and confusing to any developer who is not aware of how .NET chooses to lay out objects in memory.
.NET manages memory in four different regions, known as heaps. You can think of each of these as continuous regions of memory, though in practice .NET can create several fragmented regions for each heap. Three of the heaps, called the generation 0, 1 and 2 heaps are reserved for small objects: In current versions of .NET ‘small’ means objects that are 85,000 bytes or less. Any object is assigned to one of these generations according to the number of garbage collections it has survived, the veterans ending in generation 2. .NET knows that younger objects are more likely to be short lived and can reduce the performance cost of garbage collections by initially only looking at the recently allocated objects on generation 0. Perhaps more importantly, it can also move the survivors of a collection around so that there are no gaps, ensuring that the free space available for new objects is always together in one large lump. This helps with performance – .NET never needs to search for a hole big enough for a new object, unlike unmanaged code: if there’s enough memory available it’s always in the same place. When it needs to compact a series of objects, .NET actually copies all of them to a new block of memory rather than moving them in place; this improves performance by simplifying how objects are allocated. In these small heaps this means that the free space is always at the end, so there is never any need to scan elsewhere for a ‘hole’ big enough to store a new object.
The fourth heap is known as the Large Object Heap, or LOH. ‘Big’ objects go here – as the size at which an object may end up on this heap is 85,000 bytes, this usually means arrays with more than about 20,000 entries. It’s treated separately by the garbage collector, which will generally try to reclaim space from the other heaps before trying to tackle the giant objects that lurk here. Large objects pose a special problem for the runtime: they can’t be reliably moved by copying as they would require twice as much memory for garbage collection. Additionally, moving multi-megabyte objects around would cause the garbage collector to take an unreasonably long time to complete.
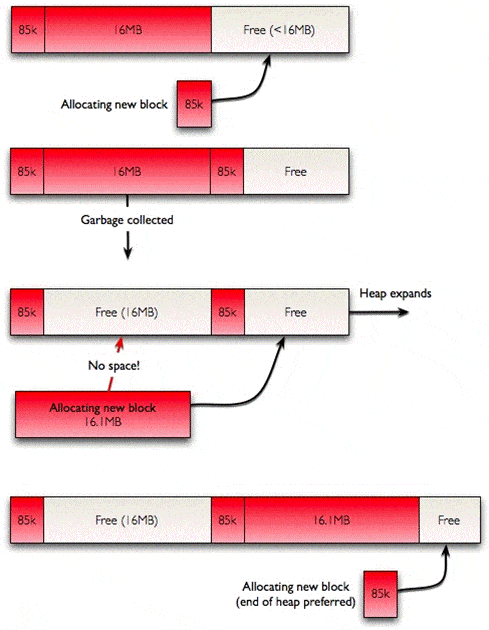
.NET solves these problems by simply never moving large objects around. After large objects are removed by the garbage collector, they leave behind holes in the large object heap, thereby causing the free space to become fragmented. When there’s no space at the end of the large object heap for an allocation, .NET searches these holes for a space, and expands the heap if none of the holes are large enough. This can become a problem. As a program allocates and releases blocks from the large object heap, the free blocks between the longer-lived blocks can become smaller. Over time, even a program that does not leak memory, and which never requires more than a fixed amount of memory to perform an operation, can fail with an OutOfMemoryException at the point that the largest free block shrinks to a point where it is too small for the program to use. In the worst cases, the amount of usable memory can shrink at a rate that seems unbelievable.
The worst case scenario
The design of the Large Object Heap means that its’ worse case will occur when the short-lived arrays are large and can vary in size a bit, and if the longer-lived arrays are small. The variation in size makes it likely that, when a new short-lived array is allocated, it won’t fit into the space left by one of its predecessors; .NET will then have to extend the LOH to ever-greater extents. This might not seem so bad: surely the smaller blocks can be put in the large gaps that are left behind?
Well, they can, but there’s a catch. As mentioned previously, .NET prefers to put new memory blocks at the end of the heap, as it has to do less work to find a space where a block will fit: This means that when there’s a new large block on the heap, the next smaller block will be allocated immediately after it, with the consequence that it will have to further extend the heap if the program ever wants to allocate a larger block.
What does this look like in a practical program? It seems fairly esoteric: allocate something big, then something small, keep the small thing and throw away the big thing. There are a few scenarios where this pattern can appear, and it can drastically reduce the amount of memory available to a program. The most trivial scenario could just be this:
|
1 2 3 |
List < int > list; ... list.Add(x); |
A List object’s underlying implementation is an array and when it needs to grow, .NET allocates a new, larger array and throws the old one away. All that’s needed to start to cause problems with fragmentation is to put some other object on the LOH before the array needs to grow. The main effect here is that you might be surprised how small the size is that your ‘large’ list can grow to before .NET tells you that it has run out of memory – long before the program is using up its 2Gb theoretical maximum.
#
Perhaps a more interesting case is this: a program is designed to read in a large data file, one that varies in size but is usually around 16Mb or so. It reads this into memory, processes it, and then produces a 90k summary. It is later adapted to run as a batch job: processing many of these files and storing the results in memory. Quite a lot of data processing applications can look a bit like this. You might expect that it could process tens of thousands of files before memory becomes a problem: after all only the 90k summary is kept between files, but testing surprises us with failure after only a few hundred files, by using up much more memory than expected.
The following program demonstrates this case. It fills up a list with 90,000 byte arrays and prints out how many bytes were allocated before .NET throws an OutOfMemoryException. It can also, optionally, allocate larger arrays between these allocations. These are short-lived, so they don’t look like they should significantly affect the number of smaller arrays that can be allocated. Unfortunately, each time the program allocates a larger array it allocates one more byte than last time.
|
1 2 3 4 5 6 7 8 9 10 11 12 13 14 15 16 17 18 19 20 21 22 23 24 25 26 27 28 29 30 31 32 33 34 35 36 37 38 39 40 41 42 43 44 45 46 47 48 49 50 51 52 53 54 55 56 57 58 59 60 61 62 63 64 65 66 67 68 69 70 71 72 73 74 75 76 77 78 79 80 81 82 83 84 85 86 87 88 89 90 91 92 93 94 95 96 97 98 99 100 101 102 103 104 105 |
// Copyright (c) 2009, Red Gate Software Ltd // // Permission to use, copy, modify, and/or distribute this software for any // purpose with or without fee is hereby granted, provided that the above // copyright notice and this permission notice appear in all copies. // // THE SOFTWARE IS PROVIDED "AS IS" AND THE AUTHOR DISCLAIMS ALL WARRANTIES WITH // REGARD TO THIS SOFTWARE INCLUDING ALL IMPLIED WARRANTIES OF MERCHANTABILITY // AND FITNESS. IN NO EVENT SHALL THE AUTHOR BE LIABLE FOR ANY SPECIAL, DIRECT, // INDIRECT, OR CONSEQUENTIAL DAMAGES OR ANY DAMAGES WHATSOEVER RESULTING FROM // LOSS OF USE, DATA OR PROFITS, WHETHER IN AN ACTION OF CONTRACT, NEGLIGENCE // OR OTHER TORTIOUS ACTION, ARISING OUT OF OR IN CONNECTION WITH THE USE OR // PERFORMANCE OF THIS SOFTWARE. using System; using System.Collections.Generic; using System.Linq; using System.Text; namespace LOH_test { class Program { /// <summary> /// Static variable used to store our 'big' block. This ensures that the block is always up for garbage collection. /// </summary> static byte[] bigBlock; /// <summary> /// Allocates 90,000 byte blocks, optionally intersperced with larger blocks /// </summary> static void Fill(bool allocateBigBlocks, bool grow, bool alwaysGC) { // Number of bytes in a small block // 90000 bytes, just above the limit for the LOH const int blockSize = 90000; // Number of bytes in a larger block: 16Mb initially int largeBlockSize = 1 << 24; // Number of small blocks allocated int count = 0; try { // We keep the 'small' blocks around // (imagine an algorithm that allocates memory in chunks) List<byte[]> smallBlocks = new List<byte[]>(); for (; ;) { // Write out some status information if ((count % 1000) == 0) { Console.CursorLeft = 0; Console.Write(new string(' ', 20)); Console.CursorLeft = 0; Console.Write("{0}", count); Console.CursorLeft = 0; } // Force a GC if necessaryry if (alwaysGC) GC.Collect(); // Allocate a larger block if we're set up to do soso if (allocateBigBlocks) { bigBlock = new byte[largeBlockSize]; } // The next 'large' block will be just slightly largerer if (grow) largeBlockSize++; // Allocate a new block smallBlocks.Add(new byte[blockSize]); count++; } } catch (OutOfMemoryException) { // Force a GC, which should empty the LOH again bigBlock = null; GC.Collect(); // Display the results for the amount of memory we managed to allocate Console.WriteLine("{0}: {1}Mb allocated" , (allocateBigBlocks ? "With large blocks" : "Only small blocks") + (alwaysGC?", frequent garbage collections":"") + (grow?"":", large blocks not growing") , (count * blockSize) / (1024 * 1024)); } } static void Main(string[] args) { // Display results for cases both with and without the larger blocks Fill(true, true, false); Fill(true, true, true); Fill(false, true, false); Fill(true, false, false); Console.ReadLine(); } } } |
When run on a 32-bit Vista system, the program gives the following result:
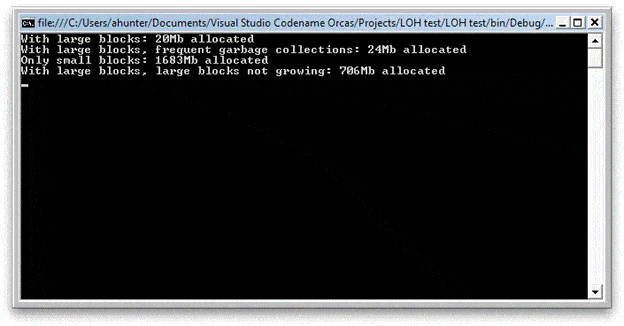
Oh dear. When the program tries to allocate the larger blocks, it’s a disaster – it only manages to end up using around 20Mb of long-term storage, out of a theoretical maximum of 2GB! Forcing garbage collections barely helps at all. Even in the case where the larger blocks don’t grow the amount of memory the program can use is reduced by over half. If the large blocks are taken away, the program easily creates 1.6GB of data.
The last case in which the blocks don’t grow, but the amount of available memory is still reduced, is interesting. When the LOH fills up and the program wants to allocate a new small block, .NET tries to re-use free space before it grows the heap: this means that the space where the larger block was previously being put becomes too small, and the LOH has to grow in a similar way to before. It’s not as critical, but it does still result in the amount of available memory slowly going down.
Switching to a 64-bit system will improve matters: the program will be able to use up a lot more memory before it fails, but perhaps the situation is worse – because that memory is assigned to the program, the operating system will be paging it all out to disk resulting in considerably reduced performance for every program on the system and perhaps eventually running out of disk space.
It is difficult to diagnose this problem with the tools that are currently available. The best approach available at the moment is to combine a memory profiler with the performance counters. You can look at the ‘Large Object Heap Size’ performance counter to discover how many bytes are allocated to the large object heap. This counter includes free space, so to discover whether or not the problem is that memory has run out or because the memory that is available has become too fragmented to be used you will need to use a memory profiler. A good profiler will be able to tell you the total size of all of the live objects on the large object heap. If there is a big discrepancy between the two numbers, then it is possible that your program is suffering from heap fragmentation. Unfortunately, this isn’t guaranteed: there’s no problem if there’s a large amount of free space at the end of the heap – .NET just won’t clean it up until it has to for performance reasons.
Working around the problem
It might seem that nothing can be done to solve this problem apart from periodically stopping and restarting the afflicted program. This is probably the case if there is really no choice other than to deal with very large arrays of objects (or very large strings), but often it is possible to reduce or eliminate the need to use the large object heap, or to use it in such a way as to prevent fragmentation from occurring.
The best way to prevent fragmentation from occurring is to ensure that no objects above 85k in size are used for permanent storage. This ensures that the free space in the large object heap will always end up in one big chunk as short-lived objects are removed from play.
If large data structures need to live for a long time, and especially if they need to grow in size over time, the best approach is simply to consider using or writing a different data structure to store them. Arrays can contain up to around 10,000 elements before they are put on the large object heap and can cause problems, so a very effective way to store 100,000 entries might be to store 10 arrays each containing 10,000 elements: none will end up on the large object heap so no fragmentation will occur. This could be written as an IList subclass, which would make it easy to drop in transparently to replace existing code.
Depending on the design of the code, a simpler approach might simply be to make the ‘temporary’ but large structures more permanent. If a program needs to deal with a set of large files, it will make more efficient use of memory if it allocates enough space to deal with the largest one first, and then re-uses that for every file instead of allocating just enough for each and then throwing the memory away later. Many of the classes in System.Collections have a ‘Capacity’ property to facilitate this design pattern, and thread local static variables can be used (with care) to help share a large data structure in multithreaded applications.
It is unfortunate that the CLR garbage collector deals with large objects in this manner. The effect is similar to a memory leak, but one where we get no clue as to the cause by measuring the size of the objects in memory: a memory profiler will tell you that there’s no problem, while task manager tells you that the program’s memory usage is growing ever larger – which could be due to this issue or which could be due to the behavior of unmanaged code. What is needed instead is a way of finding out where objects are in memory and how they are affecting the free memory available to .NET. This can be done with some detective work: code can be inspected for areas where large amounts of memory are likely to be allocated, and a memory profiler can be used to help discover these areas. Once these are known, a debugger can be used to step through the code and some pen and paper can give an idea of what the large object heap looks like, which can be used to decide on the best way forward.
There is a feature on the drawing board for ANTS Memory Profiler 5 that will help diagnose this issue and distinguish it from an unmanaged memory leak, and there are plans for features in future versions that will help isolate the specific cause once the issue is diagnosed.
Load comments