How does Windows decide what threads need time on the CPU?
Multitasking operating systems such as Windows have for a long time divided up their workload into processes: running copies of applications that execute ‘simultaneously’. Since pre-emptive multitasking became common, operating systems have further divided up processes into threads, separate simultaneous tasks within a single process.
In practical terms, a computer can only perform a certain number of tasks at any one time, so the operating system must decide how to allocate the available processing resources to the running threads and processes. It relies on the tasks running in the threads themselves to decide what should run and when: each thread can indicate to the OS that it wants to wait for something to happen, and the OS will then block that thread from running until that event occurs, freeing up processing resources for threads that have actual work to do.
Threads that aren’t blocked in this way are scheduled to run on one of the available cores at the next opportunity. If there are more threads waiting to run than cores available to run them, then the OS will run each for a certain length of time and then switch them around so they each get a fair amount of time running. If there are two threads waiting to run on just a single processor core, then they will both appear to be running at half the speed to the user, so can be crucial to the overall performance of the system to make sure that the OS knows which threads it doesn’t need to run at any one time .
A slightly simplified diagram of the states a particular thread can be in under XP is as follows:
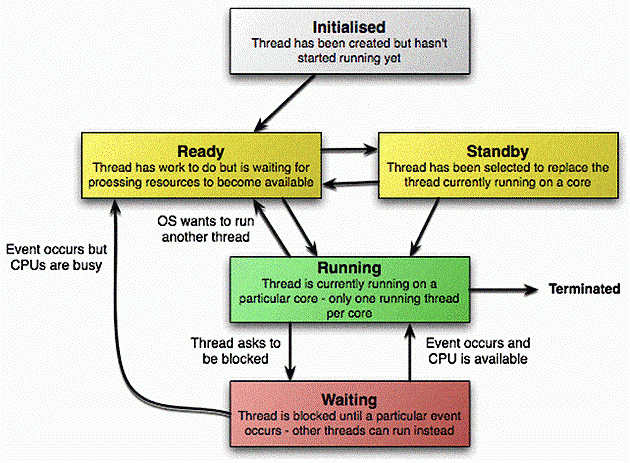
A thread’s transition through the states is mostly managed by the OS, but a program does have control over when the thread should enter the waiting state and become blocked and how the OS should wake it up again. There are many ways to tell the OS to block a particular thread. Most of these are performed automatically: for example, a thread will block while it waits for data to be read from the hard disk. There are also some ways that this can be controlled more directly – in .NET, the basic way of doing this is to use the Monitor class, which has a ‘Wait’ method that will cause a thread to be blocked until another thread wakes it up again.
Profiling threads
A good profiler will understand that threads that are blocked are not actually running and don’t use up any CPU time. The following program provides a simple demonstration of this. It uses Console.ReadKey to ask Windows to block its main thread, and then displays the amount of processor time used.
|
1 2 3 4 5 6 7 8 9 10 11 12 13 14 15 16 17 18 19 20 21 22 23 24 25 26 27 28 29 30 31 32 33 34 35 |
using System; using System.Collections.Generic; using System.Diagnostics; using System.Text; using System.Threading; namespace SimpleBlock { class Program { static void Main(string[] args) { // Illustrates that the 'current' thread will always be running Console.WriteLine("Current thread is {0}", Thread.CurrentThread.ThreadState); Console.WriteLine("Press a key:"); // Asking the OS to read a key will cause it to block this thread // until the user actually presses a key Stopwatch sw = new Stopwatch(); sw.Start(); Console.ReadKey(); sw.Stop(); // Display the time taken to the user Console.WriteLine("Took {0} seconds realtime", sw.Elapsed); // Read the amount of time this process was actually running on // the processor (will be 0 or very close to it) Console.WriteLine("Used {0} seconds processor time", Process.GetCurrentProcess().TotalProcessorTime); // Wait to allow the user to read the results Console.ReadKey(); } } } |
Running this program might produce a result similar to the following:
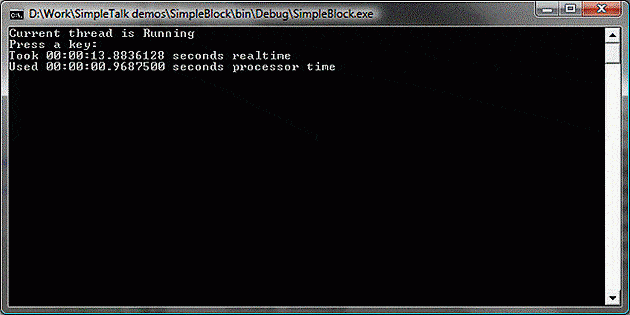
There are a few things to notice: we display the amount of real time that elapses while the thread was waiting for the ReadKey call to return, which can be quite high depending on how long the user waits. The thread isn’t actually running during this time, so it uses very little resources, and we can see that the amount of processor time used is very much lower.
If we profile this program in ANTS profiler, we can see that the profiler records this information:
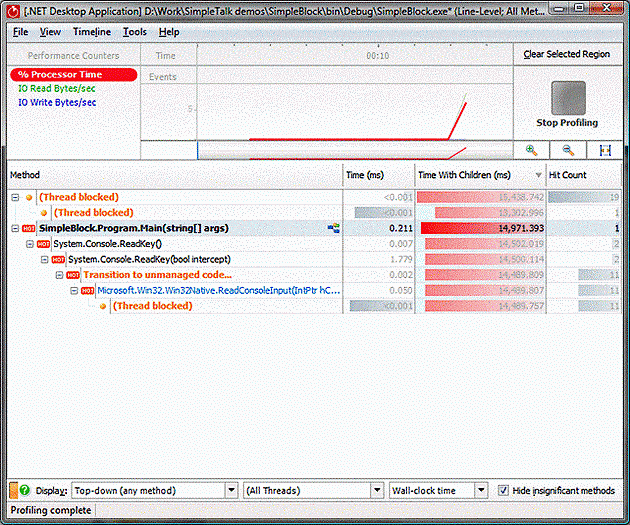
Whenever the program being profiled makes a call that causes Windows to block a thread, moving it to the Waiting state, the profiler notices and adds a fake function call to indicate the time the thread spends waiting. The profiler is showing here that in the Main function the ReadKey function took by far the most time, but that almost all of it was spent waiting for the OS to wake the main thread up again.
There is one other ‘thread blocked’ call here that doesn’t appear to be associated with any .NET code: this is actually caused by another thread created by the .NET runtime to run object finalizers. The CLR puts this thread to sleep when there are no finalizers to run – which there aren’t most of the time, so this thread often bubbles to the top of the methods list when looking at wall-clock times. The times add up to more time than the program actually ran for because the threads were being run simultaneously: they both ran for about 15 seconds, but simultaneously – in real-time terms, these two periods of time are exactly the same. The ‘All Threads’ drop-down could be used to select a specific thread and eliminate this time.
Switching the profiler to CPU time removes any time spent the threads spent blocked from running:
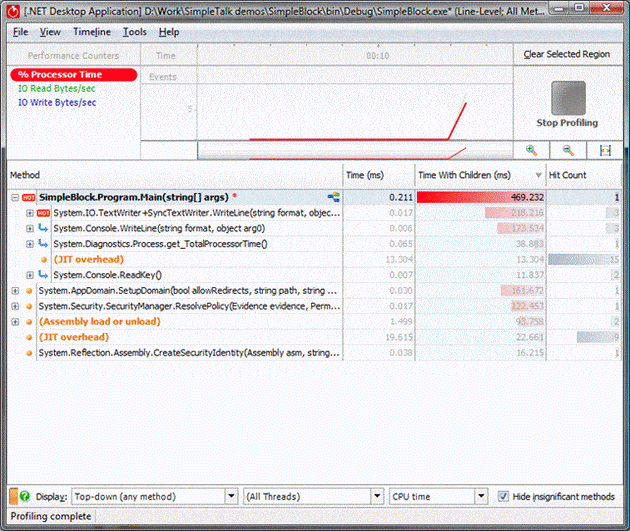
This is nearly always the most useful way to view the results. The time spent waiting for ReadKey to return wasn’t really time spent running any code, but waiting for the user to do something to make the program continue. This time doesn’t actually affect the performance of the program (it’s more of a measure of the users performance in this case). Taking this time away reveals where the program actually spent its time – in this case it spent the time it had actually running on the CPU displaying text in the console, which isn’t surprising given the simple nature of the program.
Although blocking time is nearly always uninteresting in this way, being time spent by a particular thread waiting to be given something to do, there are on the other hand times when it can be very useful in tracking down a performance problem. For example, if a program accesses a SQL Server database, it will send the requests to SQL Server and then block until the response is available. If the database is running slowly, then the thread will spend a lot of time waiting and will appear slow to the user. Investigating these cases can take a little more work as the profiler doesn’t know the difference between a thread that is waiting for the user to do something and one that is waiting for some other process to complete – the process by which SQL Server communicates with an application is very similar to the way that a users web browser might do as far as the profiler is concerned.
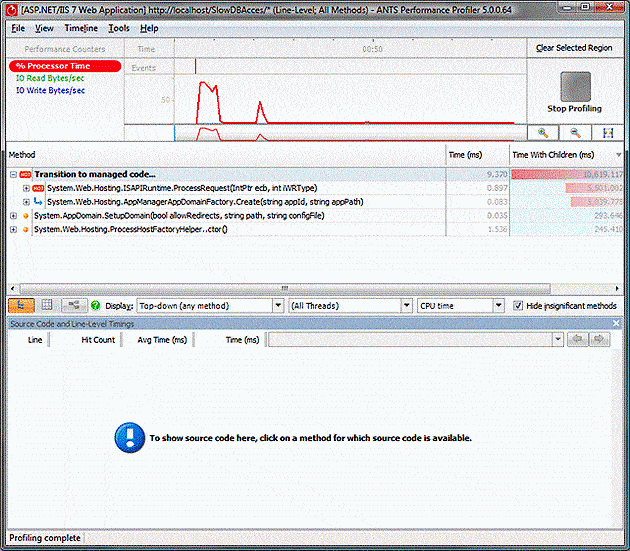
If the profiler is pointed at a website being affected with a slow database connection, the results might not indicate that there is any kind of problem if only the CPU time is examined. In this example, a problem page has been loaded 4 times, taking around 10 seconds each time, so we should be able to find where 40 seconds have been spent loading the page, but when measured in CPU time, the time spent processing requests seem to be about the same as the amount of time spent starting up:
We do know the page that is causing the problem, so we can find the Page_Load method in the all methods tab and focus on it using the call graph, but the results still don’t explain where all the time is being spent:
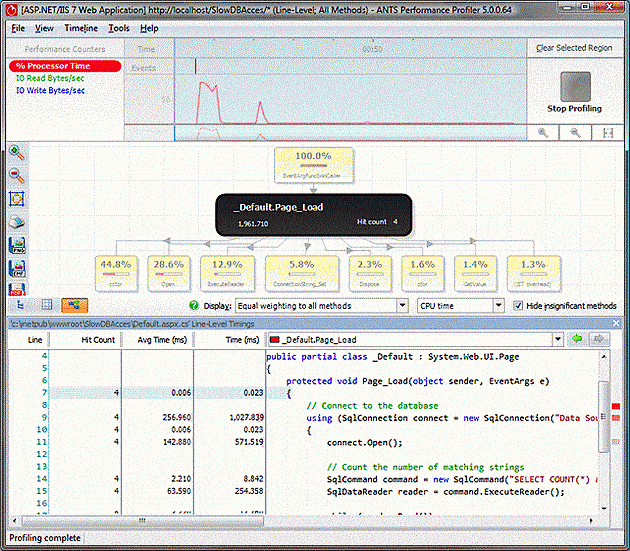
4 attempts at loading the page appear to only require 2 seconds of time total, and most of that is in a .cctor method – which is a class constructor and only called the first time the page is loaded. Still, there is a clue in the source for the method: it is performing a database query, and the delay might be due to the communication with the database causing the thread to block. Another clue to this is in the % Processor time graph: despite the fact I was asking the website to do some work, it appears to indicate that it was doing nothing at all: perhaps having a look at the wall clock time will help.
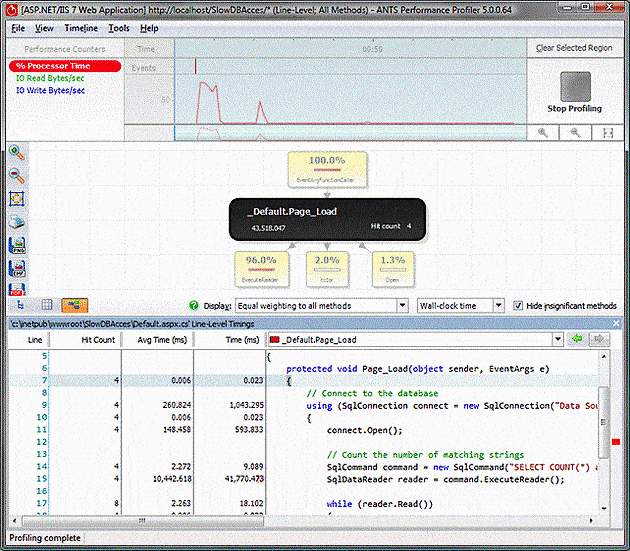
Performing the switch tells a completely different story: the ExecuteReader method completely dominates the time, and as it takes 10 seconds it explains the performance issue that was being seen in the website. When the call is made, the .NET framework asks Windows to block its thread until the query is completed on the database – this delays loading the page but doesn’t require that the thread use any CPU time, so the web server doesn’t appear to be running slowly. The database process would show quite a lot of work being done here, but it’s not being profiled and so doesn’t show up in the results if the blocking time is not taken into consideration.
A similar situation can arise when the delay is due to the time taken for communications to arrive. For instance, a SAS application might make a request to a remote server through a slow communication link – neither the server nor the client will appear to be using a lot of CPU time but will spend a lot of time blocked, waiting for the slow communications link.
Running multiple threads
So much for threads that block: what happens when there are multiple threads that are ready to run, but only a limited number of CPUs available for them to run on? Windows will run them each for a limited period of time, known as the thread’s quantum, then cycle through in a round-robin fashion. The length of a quantum actually depends on the hardware that Windows is running on as well as whether or not it is a desktop or server version, but the effect is that each of the threads appear to run slower by the proportion of the number of ready threads to the number of CPUs.
This can look a little odd in a profiler. Take a look at this program:
|
1 2 3 4 5 6 7 8 9 10 11 12 13 14 15 16 17 18 19 20 21 22 23 24 25 26 27 28 29 30 31 32 33 34 35 36 37 38 39 40 41 42 43 44 45 46 47 48 49 50 51 52 53 54 55 56 57 58 59 60 61 62 63 64 65 66 67 68 69 70 71 72 73 74 75 76 77 78 79 80 81 82 83 84 85 86 87 88 89 90 91 92 93 94 95 96 97 98 99 100 101 102 103 104 105 106 107 108 109 110 111 112 113 114 115 116 117 118 119 120 121 122 123 124 125 126 127 |
using System; using System.Threading; using RedGate.Profiler.UserEvents; namespace MultiThread { class Program { private static readonly object s_StartMonitor = new object(); private static readonly object s_Monitor = new object(); private static int s_Started; /// <summary> /// Calculates a particular position in the Fibonacci sequence /// </summary> static int CalcFib(int num) { int a = 0; int b = 1; for (int x = 2; x < num; x++) { int nextA = b; b = a + b; a = nextA; } return b; } /// <summary> /// Does some work /// </summary> static void Fib(int count) { // Fill up an array with some calculated values (really just does some work) int[] res = new int[count]; for (int x = 0; x < count; x++) { res[x] = CalcFib(1000); } } /// <summary> /// Calculates 2000000 numbers with the specified number of threads /// </summary> static void DoWork(int numThreads) { Console.WriteLine("{0} threads", numThreads); ProfilerEvent.SignalEvent("Starting {0} threads", numThreads); if (numThreads == 0) { Fib(2000000); } else { // Create numThreads threads, each which will do a portion of the work Thread[] threads = new Thread[numThreads]; int count = 2000000 / numThreads; s_Started = 0; for (int x = 0; x < numThreads; x++) { int thisThread = x; threads[x] = new Thread((ThreadStart)delegate { // Set a thread name so we can identify the thread in the profiler Thread.CurrentThread.Name = string.Format("Fib thread #{0}", thisThread); lock (s_Monitor) { // Signal to the main thread that this thread is ready lock (s_StartMonitor) { Monitor.PulseAll(s_StartMonitor); s_Started++; } // Wait for the main thread to signal that this thread should start Monitor.Wait(s_Monitor); } Fib(count); }); } // Start all the threads for (int x = 0; x < numThreads; x++) { threads[x].Start(); } // Wait for all threads to signal that they are ready lock (s_StartMonitor) { while (s_Started < numThreads) { Monitor.Wait(s_StartMonitor); } } // Tell all threads to start doing work at the same time (there's a setup delay, so just starting and doing the work will distort the results) lock (s_Monitor) Monitor.PulseAll(s_Monitor); // Wait for the threads to finish for (int x = 0; x < numThreads; x++) { threads[x].Join(); } } ProfilerEvent.SignalEvent("Finished {0} threads", numThreads); } static void Main(string[] args) { Thread.Sleep(5000); DoWork(0); Thread.Sleep(5000); DoWork(2); Thread.Sleep(5000); DoWork(10); Thread.Sleep(5000); DoWork(100); } } } |
This program makes 2,000,000 calls to CalcFib(1000) using either the main thread, or 10 or 100 simultaneous threads. I’ve added some synchronisation code to make sure that all the threads start running at the same time, which will ensure that the delay caused by starting new threads doesn’t affect the results. The results for the single threaded case are pretty predictable:
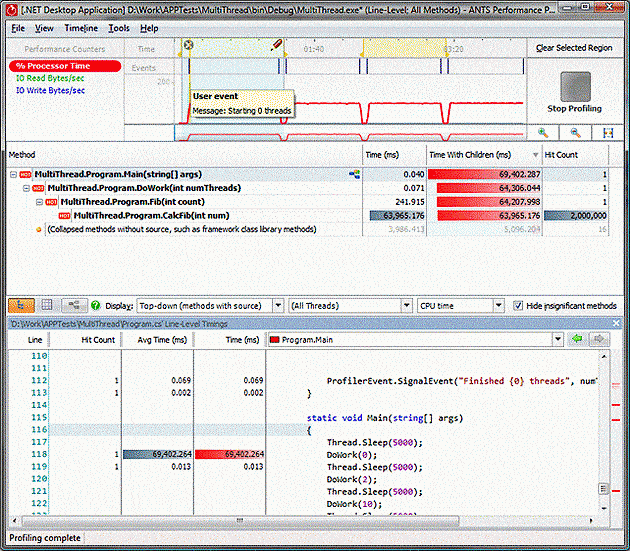
However, when we look at the 10 thread case, something interesting happens. There are still 2,000,000 calls to CalcFib(1000) but they appear to take 10 times as much time!
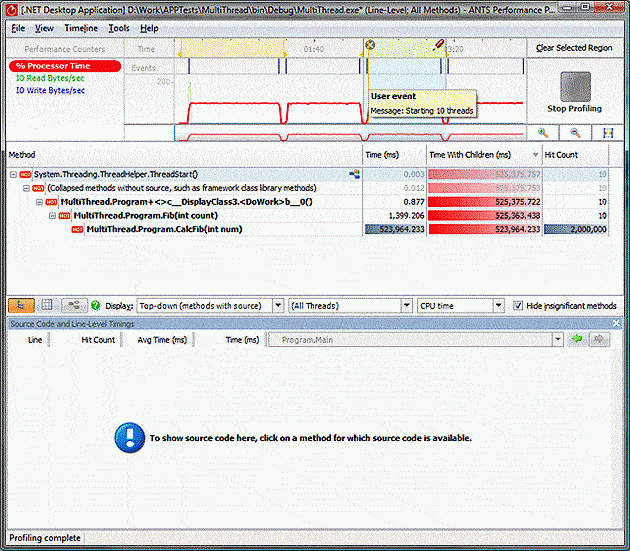
It’s pretty easy to tell by looking at the timeline that the program is taking roughly the same amount of real time to complete its task: the time for 2,000,000 calls to CalcFib require the same amount of time to complete on a single CPU regardless of the number of threads.
What’s happening is that the profiler is adding up the time taken by the calls on all the threads to create the final result. The operating system is interleaving the threads, and each thread can only get 1/10th of the work done that it could have done if there was only a single thread that needed to run; this means that any given operation takes 10 times longer. When the time is added up across all 10 threads it then appears to be much too large. This can be seen clearly by looking at one of the running threads:
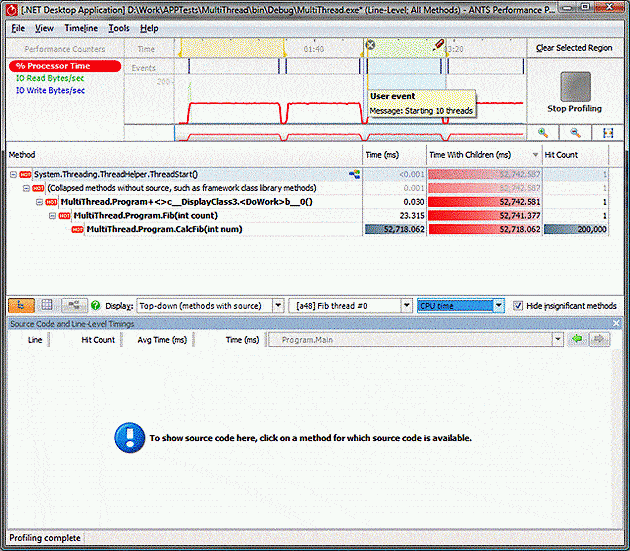
The CalcFib takes much more time than the single threaded case, but this is because it is having to share runtime on the CPU.
Conclusion
To ensure the best performance of a multi-threaded application, it is important to understand how the OS decides which threads need to run on the limited number of processors available. If each thread is primarily processing data and using CPU time, there is nothing to be gained by adding more threads than available CPUs: the overall time taken will be the same, or possibly worse if there are synchronisation issues.
If, on the other hand, a thread has to wait for the operating system, or other threads or processes, in order to complete certain operations, then you can make it possible for an application to continue doing work while the blocked threads are waiting, by adding extra threads. This is commonly used in applications with a user-interface. to ensure that the application continues to respond to user actions while the a long-running operation completes: This can be extended to other operations: a database application might, for example, process results from a previous query while waiting for the results from the next one, as most of the time taken to perform a query is spent waiting for the relatively slow disks to respond, leaving the CPU free for other work.
A good profiler can distinguish a thread that is running, or ready to run, from one that is waiting and not using any processor resources. Often the time spent waiting isn’t important in terms of performance as it is simply the time taken while the application is waiting for data to process, but it is useful to understand that there are times when this time becomes important – when it can’t proceed until some other operation completes, such as reading from a disk or waiting for a response from an external program like a database.

Load comments