
In this article, I am going to use a number of tools to show how, because .NET applications run on top of the CLR, things are not always as straight forward as they seem. I’m also going to prove to you that high CPU usage and slow performance in your applications are not always caused by slow code, but sometimes by poor or excessive memory use.
The example that I will use is of an ASP.NET website where users have complained of random slowness. As usual, the DBA has been blamed, but has investigated and assured everyone that the database isn’t responsible, so it’s time to grab a profiler and dig into the problem.
I should point out that this article is a walkthrough of how to use different tools to track down performance issues, rather than a stick to beat the garbage collector with. In this case the performance issues can be frustrating, but the garbage collector is doing its best with what the ASP.NET developers have given it. The behaviour we’ll be seeing is also limited to ASP.NET, as it uses the “server-mode” garbage collection, which aims to optimise throughput over responsiveness.
The Problem
The demo site (downloadable from the top of this article) is made up of one page with three buttons; the first button uses large chunks of memory, the second frees that memory, and the third performs an operation which normally takes around 1 millisecond to complete. When any of the buttons are pushed, the time of day and time to run are displayed. To make it easier to reproduce a problem, I am using a 32-bit process, so we are limited to a mere 2GB of memory (yes, I know I could push it to 3GB, but let’s not complicate matters). In case you are wondering how realistic this demo is, with respect to having one button to immediately allocate loads of memory, in a real life situation there may well be a background operation that suddenly uses up great chunks of memory, or it might be lots of users hitting pages all at once which causes the memory usage to abruptly go up.
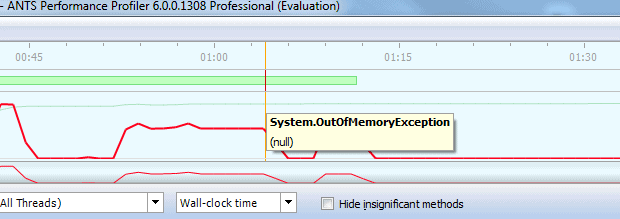
This exciting screenshot shows how button 1 usually takes ages to complete and, before it suddenly failed with an OutOfMemory Exception at 12:49:38, the longest button 3 had taken to complete its operation was 21 milliseconds. After this inexplicable failure, we start to see memory pressure, and button 3 can randomly take anything from 0 to 561 milliseconds to complete, so there is clearly a lack of consistency.
Profile Time
This is where it actually gets a little tricky. If we assume that this is a live site which is afflicted randomly, it would be very hard to reproduce this in a test environment without actually knowing what was causing the problem (i.e. to reproduce this you would need to make sure that you could get enough memory pressure to trigger the garbage collection). With that in mind, we need to go to the environment where we actually have the problems and get a profiler running, and for this demo I will use ANTS Performance Profiler 6. Any profiler will do, but if you use one that doesn’t have line-level timings then it will be a lot harder, especially if the slow method also does things like db access, or anything over WCF etc., as they are too easy to blame as performance culprits.
I have attached a copy of the timings and also the ANTS profiler trace to this article, so if you want you can use those to follow this demonstration, instead of actually running the site, which is also attached for you to have a tinker with.
If you start the web site under ANTS and push the buttons to get some timings, in the profiler you should immediately notice that the first button causes high CPU. As I mentioned earlier, this may be taken as modelling a background process or many users hitting pages. After pressing the first button a few times you should get a failure notice, and at this point we have enough memory pressure to cause the timed operation to inexplicably fluctuate between being quick and slow, with nothing else changing.
The users are complaining about the response time when clicking on the third button, so that is where we focus our attention; while we do see some CPU peaks in ANTS, these are not related to problem method being called by the third button: TimedOperation_Click. If you look at the screenshot below (figure 3), we can see a number of CPU peaks (the red trace line at the top), and the green bars in the events row are where the selected stack is being called. Significantly, we can quickly identify that, at the times of high CPU load, our TimedOperation_Click method was not involved.
If we compare this to the times when our method was being called (see figure 4, below), we can see that, apart from the last peak, the CPU load was pretty much zero every time the TimedOperation_Click method was called:
Just to make sure we all know what we’re looking at, the single red line in the events row (just after 1:03 minutes) is the out of memory exception.
We know that, before the exception occurred, the timed operation was always fast, so let’s zoom in on the period just before the exception and have a look at our suspect method. We see that the TimedOperation_Click method was called 15 times, with the loop executing 15,000 times, and the slowest line, “s.PadRight(100, ‘a’)“, completed the 15,000 operations in a mere 4.273 milliseconds.
Compare that to the two occasions the method was called after the exception, when it completed the same line just two thousand times and yet took a whopping 3,523.565 milliseconds – that’s a massive difference for something that doesn’t do any external work (like, for example, a db lookup).
At this point, the obvious suspicion is that something else is running that is causing us to experience a slowdown, either in our process or on the machine. However, on closer inspection of our method, we can see that the rest of it is absolutely fine, and it’s only the PadRight or PadLeft methods which are causing us problems. With that in mind, we can use .NET Reflector to have a look inside these methods to see what they’re doing, although in this case we don’t get much help, because the PadLeft and PadRight methods just call PadHelper, which is a native method in mscorlib. As a result, all we see is the signature below:
Where Else Can We Look?
Although this seems like a confounding problem, there is a ray of hope; we know that the method is doing a string operation, which can take up a lot of memory, so let’s have a look to see if garbage collection is going on (Not to spoil the surprise, but I think it will be). To see when a GC is run and how much time is spent running it, we can use Perfmon and the “.Net CLR Memory\% Time in GC\InstanceName” counter – the instance name will either be W3Wp.exe or, in a visual studio 2008 test environment, WebDev.WebServer.
Now bear in mind that the counter is a little unintuitive, in that it only changes when a GC runs. So, even if the line is at 100, it might not actually be doing any garbage collection and, if it was at 100 and then dropped to almost nothing, then a GC is running, but not much of the time is being spent on it. In short, a dropping line could actually mean that more time was spent collecting the garbage, compared to a steadily high line. With this in mind, the thing to look for is when the counter changes, as opposed to the current value, so let’s try and simulate some user behaviour and see what happens.
If you look at figure 9 below, you can see the of the counter value change as the memory hog button (button 1) is pushed four times and we see four resulting CPU peaks (the red trace is CPU load, and blue is time spent in the garbage collector). The very first peak in the trace is unrelated to the demonstration.
Now that we’ve created some memory pressure, we can start pressing the timed operation button; the first time it’s pressed, we get a runtime of 43 milliseconds just before 14:48. At the same time, the blue line drops – meaning that the GC did some work – and comes down to 2.571, which means 2.571% of the time was spent running a collection. Subsequent presses of the timed operation button took between 0 and 1 millisecond with the blue line staying steady, so no GC operation was run.
This shows that, when we have a slow runtime, the GC was active, and when the GC was not doing anything, the runtime was fast. The demo behaviour is fairly consistent, but in the real life scenario it would be random as memory is created and consumed at different points (unless there was one operation which always allocated xx bytes or xx number of objects and triggered a slowdown) Unfortunately, the counter is not very intuitive; it would be nice to see a counter along the lines of “% Time Spent as GC Overhead Per Method“, but it isn’t there, so we need to work with the idea that when the line changes, the GC did something, and then look for further evidence in other places .
We want proof
Of course this all looks good and very likely to be the cause of the slowdowns, but we want to be more accurate and we want proof, so we need to get our old friends cdb and sos.dll out and take a peek under the hood of this site. What we want to find out is:
- Exactly when is our method called?
- Is it fast?
- Is the garbage collector ever doing its “thing”?
- Conversely, when our method is slow, is the garbage collector always doing a collection?
Note that if either of the last two items are not happening, then the theory that the garbage collector is running and slowing down the normally fast method is flawed.
The demo app I have included at the top of this article is in .NET 3.5, so use mscorwrks. Alternatively, if you have a .NET 4 app which you’re trying to debug, then replace all mscorwks references below with clr (mscorwks.dll became clr.dll)
Start the web application and attach using cdb:
|
1 |
Cdb -p [pid] |
Because we are going to be looking at .NET internals, we will need to make sure that we have the correct symbol path for mscorwks, otherwise we will have no idea what mscorwks is doing. If you’re not sure what to put in here, this is the symbol path I used and it works for this demo, so use:
|
1 2 3 |
.sympath srv*c:\symbols*http://msdl.microsoft.com/download/symbols;srv*c:\referencesymbols* http://referencesource.microsoft.com/symbols;srv*c:\symbols*http://source.msdn. microsoft.com/symbols;srv*c:\symbols*http://referencesource.microsoft.com/symbol |
You will naturally also need to make sure that you create the C:\Symbols and C:\ReferenceSymbols directories. To make sure you have the correct symbols for mscorwks run:
|
1 |
!lmi mscorwks.dll |
You should see this in the output: Symbol Type: PDB – Symbols loaded successfully from… (see figure 10 below)
Now that we know we’re setup correctly, we need to see what is happening when we press our button and it takes a while to complete; there are two ways to do this. The first is to set a break point on our method, wait for it to hit, and then step into each method call to see where it takes us. This is painstaking work and can take hours to get right, and besides, there is no easy way to tell if a run was quick or slow.
The second method is to say a quick prayer, press the offending button and then immediately press ctrl+c in cdb to break in. If it’s a quick run then you will definitely miss it – 1 millisecond is just too fast for you to catch.
When you finally manage to get cdb broken in at the correct point, the current thread will not be the one actually executing the code that we need. Instead, we will need to search all of the threads for our method, so load sos.dll by running:
|
1 2 3 |
.loadby sos mscorwks ( or ".loadby sos clr" for CLR 4.0 apps), followed by: ~* e !CLRStack |
This runs the !CLRStack command against all of the current threads. When you run this, you will get some stack traces, some “Failed to start stack walk“, some “Unable to walk the managed stack” and possibly some other errors; these are normal, as not all threads are managed. If you look at the stack traces you do have, you should see the TimedOperation_Click method, the OS Thread ID above the trace tells us which thread id we need to look at:
In this example it is 13, so do:
|
1 |
~13s |
… to set the current thread to 13. If we look at the managed stack, we end up in System.String.PadHelper, which we already know from looking at Reflector is a native method that we can’t do anything with. Let’s take a look at the native stack, as see if we can get any help from there:
|
1 |
Kv |
Now this is more interesting, as it shows that we moved from mocorlib_ni into mscorwks and a method called PadHelper, which shows that we are definitely in the right place and have the correct symbols (otherwise we might have gotten another method here). What we see is that we get a call to “gc_heap::GarbageCollect“, even though we haven’t done anything to cause a garbage collection in our code (think GC.Collect).
What is happening is that PadLeft is trying to allocate a string which allocates some memory, but this has failed, so the GC is called to allocate more memory. We can see how this happens by taking a look at the SSCLI aka Rotor code – unfortunately the SSCLI code is now out of date , but still gives us a pretty good idea of how the garbage collector is called when allocating memory.
To find WKS::GCHeap::Alloc, look in “clr\src\vm\gcsmp.cpp“; on line 5307, it calls gc_heap::allocate, which we don’t see in the stack trace because the gc_heap::allocate method is marked with “inline“. This method checks to see if there is enough memory available on the heap and, if there isn’t, then it tries to allocate more space in the heap by running a garbage collection. You can see the garbage collection being run in the method gc_heap::allocate_more_space which calls vm_heap->GarbageCollectGeneration(). If there is then enough space, then gc_heap::allocate attempts to allocate the memory:
So we know that when we hit the slow run, it was running a GC, but how do we know that this is what’s happening every time it’s slow? Equally, how do we know that every time it’s running fast, it’s because it isn’t running a GC?
To show once and for all that the garbage collection is actually the culprit, we can set a breakpoint in one of the native methods we have in the stack, show a stack trace, and then automatically continue the application. So, if you run:
bp mscorwks!WKS::GCHeap::GarbageCollectGeneration “.echo We have a GC…;!CLRStack;g”
… then every time we get a collection, we will show the managed stack that led up to it. Cdb will then continue, so we will have a slight delay, but it shouldn’t be too noticeable. If you then run
|
1 |
g |
… to continue, and let the app run, continuing to press the timed operation button, then when you get a slow run it should dump out the stack trace and continue; You shouldn’t ever get the stack trace for a fast run.
To expand on this slightly, you could also set a breakpoint on the TimeOperation_Click method, echo something like “TimedOperation Called” and then continue, so that you could match up runs with the output from the ASP.NET app.
What now?
Hopefully I have shown how you can discover when the garbage collector is actually causing your application to run slowly, although it is important to realise that the garbage collector is in no way to blame for this. Instead, it is the application design and the way that it uses memory.
To fix issues like this, you need to examine what is in memory, as well as what should and what shouldn’t be in memory, as well as generally reduce the memory footprint of your application, or make a decision as to whether or not to move to a 64-bit architecture and / or allocate more memory.
This document contains proprietary information and is protected by copyright law.
Copyright © 2026 Red Gate Software Limited. All rights reserved
Load comments