

This is the true story of a 64-core SQL Server brought down by poor assumptions about its data. A clustered index designed for neat, sequential IoT inserts was overwhelmed when the real readings arrived late, out of order, and in bulk. The same risk lurks in any high-write system with unpredictable insert patterns. This article shows what can go wrong and how to avoid it. In essence, it answers the question: how do you manage IoT data in OLTP (online transaction processing) systems?
The Background
This isn’t a hypothetical lab setup: this describes what can go wrong at a manufacturing site running a high-end relational database system (RDBMS) to record IoT data.
A manufacturing company rolled out over 10,000 IoT sensors across its factories to track temperature, pressure, humidity, acoustic and vibration data. The data was streamed into a RDBMS, SQL Server in this case, not particularly because it was cutting-edge, but because it was already part of their stack. Their MES system ran on it, they had additional licenses, elite-class support from Microsoft, and the cost of switching to open-source systems was too high.
The table design seemed deceptively straightforward: a clustered primary key on (SensorId, ReadingTime) as is commonly used with time series based workloads. But there was a deviation for this in OLTP RDBMS systems, and they didn’t have a DBA involved during design. Everything looked fine on frequency samples of 1000 sensors or less, but problems arose when the number of sensors increased.
However, it wasn’t just the increase in sensors that caused problems, as many of these sensors suffered from power issues, poor GSM connectivity, and delayed data transmission in production usage. The result was the arrival of backfilled inserts with old timestamps arriving hours or days late, and often in considerable bulk. This had an immediate impact on the business in that temperature gauges often showed ‘stale’ values despite sensor updates, vibration alerts sometimes failed to trigger abnormal machinery, and pressure graphs occasionally displayed gaps even though the sensors were online.
These out-of-order inserts hit earlier parts of the clustered index and triggered massive page splits. With no fill factor adjustments or fragmentation checks in place, the system began to struggle. TempDB usage climbed, CPU hit 90%, and insert latency shot up. Even with a 64-core server, the database couldn’t keep up.
Eventually, we looked deeper, monitored closely, and realized what was happening. The clustered index wasn’t the primary problem — it was the assumption that inserts would always be sequential. With no room left on pages, every backfill caused internal reshuffling, page splits, and performance degradation.
The Architecture
The design of the end-to-end data pipeline was fairly straightforward on paper, as shown below:
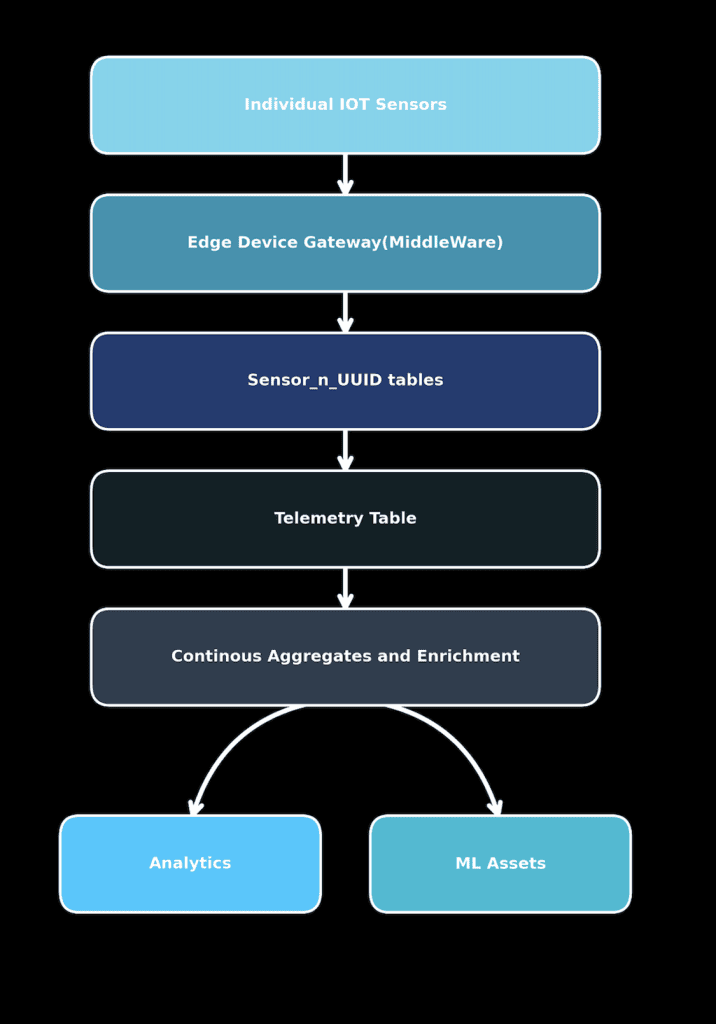
It began with individual IoT sensors that were deployed across industrial equipment, continuously measuring parameters such as temperature, vibration, pressure and humidity.
These sensors didn’t talk to SQL Server directly. Instead, their readings flowed through an Edge Device Gateway — a middleware layer responsible for temporarily buffering and pre-processing incoming data. This layer played a crucial role: it had the ability to store up to one month of telemetry data locally, which became invaluable when connectivity was lost or sensors went offline. It’s this buffer that allowed delayed data to be backfilled later into the system, but the immediate value of the data in triggering alerts on abnormal readings was lost.
From the middleware, data was pushed into staging tables within the database — dynamically created tables named like sensor_n_UUID. These were lightweight, per-sensor structures used to isolate incoming data before merging it into the main Telemetry table.
These staging tables served two purposes:
- In real-time, they handled small, continuous batches of data every few seconds or minutes.
- When receiving backfill data from the Edge Device Gateway, they accumulated much larger datasets — sometimes several days or even months worth of readings.
While the real-time flow remained efficient due to the small payload size and regular purging of staging tables, the backfill operations became a ticking time bomb. When massive, unordered inserts from these tables hit the clustered index on (SensorId, ReadingTime), they caused page splits, TempDB spills, and CPU spikes. Later, we’ll discuss the severe impacts these had.
Once the telemetry was ingested into the main table, continuous aggregates and enrichment jobs ran periodically — computing moving averages, trend deltas, and preparing enriched datasets for downstream consumers. Finally, this processed data powered analytics dashboards and machine learning pipelines for equipment health prediction, anomaly detection, and more.
First Signs of Disaster: What We Saw in Real-Time
There were several obvious signs that something was wrong, seen in alerts and notifications:
- The CPU was pinned at 90%+ on a 64-core machine
- TempDB log file growth alerts (50GB+ in an hour)
- Page splits/sec graph looked like a hospital alert (1000→ 5000+)
- Dashboard queries failing with
Timeout expirederrors - ETL job time increased greatly, with many stuck while loading from Staging Tables
Where Things Started Breaking:
- Clustered index on (SensorId, ReadingTime) meant that mid-range inserts, while back-filling, caused non-sequential writes.
- Payload bloated rows, reducing stored rows/pages drastically, in turn causing massive page splits of up to 1000 per second
- Massive TempDB usage as a result of trying to insert from the Sensor_n_UUID table to the telemetry table, in an effort to preserve data
- CPU shot up to 90%+ — even on a 64-core machine — because of so many insertions to the telemetry table running continuously in parallel
Simulating The Complete Workload
I recreated the full environment on an 8-vCPU, 64 GB RAM Azure Virtual Machine (VM) with SQL Server Evaluation Edition 2019 (feature-wise, the same as the Enterprise edition). While the original client system ran on a monstrous 64-core SQL Server Enterprise instance 2019, replicating that exact scale wasn’t feasible — Azure’s 64-vCPU machines are significantly more expensive and generally out of reach for individual users like me.
But even with modest specs, the setup was more than sufficient to faithfully simulate the bottlenecks — offering a realistic glimpse into how page splits, TempDB overload, and CPU spikes emerge when backfilled telemetry data clashes with suboptimal indexing, just as had happened with the manufacturing company in this example. It also allowed me to run tests to assess the best solution to the problem.
For the purpose of simulation, I modeled 100 sensors instead of the full 10,000+ used in production. This wasn’t just to save on data generation time, but also to keep the workload manageable while still triggering the same structural failures: backfilled inserts, bloated payloads, and fragmentation chaos. The goal wasn’t to match the client’s scale byte-for-byte — it was to mirror the architectural flaw and its side effects.
Create Main Table Telemetry
|
1 2 3 4 5 6 7 |
CREATE TABLE dbo.Telemetry ( SensorId INT NOT NULL, ReadingTime DATETIME NOT NULL, Value FLOAT NULL, Payload VARCHAR(MAX) NULL, CONSTRAINT PK_Telemetry PRIMARY KEY CLUSTERED (SensorId, ReadingTime) ); |
Simulating Reality: Data Every 10 Seconds… with GSM Glitches
In the live systems, data was expected every 10 seconds; however, for various reasons—including SIM expiry, GSM (Global System for Mobile Communications) outages, or tower handshakes—data sometimes arrived late. To address this, the application stored incoming data in temporary staging tables, with one table per sensor (e.g., sensor_1_UUID, sensor_2_UUID), which were then backfilled into the Telemetry table in parallel.
|
1 2 3 |
-- Table per sensor (simplified) CREATE TABLE dbo.sensor_1_UUID123 (... same schema ...); CREATE TABLE dbo.sensor_2_UUID234 (...); |
New tables were created during each backfill operation as data was pushed from edge devices, using a new hash suffix to reduce direct load on the main telemetry table. Since simulating edge device behavior was not possible in this context, individual hash tables were created in the next section while maintaining similar logic. Whenever new sensor data entered the system, a corresponding sensor_n_UUID table was generated.
Simulating the Work Load
To get to the bottom of the issue, I needed to recreate the entire environment in a controlled test setup and then simulate their page splits, TempDB usage and CPU hike issues on the basis of known patterns. The real system had over 10,000 industrial IoT sensors deployed across manufacturing units, each transmitting a steady stream of telemetry: temperature, acoustic signatures, pressure, humidity, and device health stats. These payloads were not lean — they were firmware-packed strings including battery level, device version, GPS location, CRC checksums, and metadata used for downstream analytics and alerting.
However, this data didn’t always arrive in real time due to GSM network blackouts, expired SIMs, and device reboots. Sometimes it came as backfilled records hours or even days later. Now, with a clustered index on (SensorId, ReadingTime) and inserts arriving out-of-order, SQL Server wasn’t happy.
To mirror this behavior, I set up a table named Telemetry with the same clustered index structure, added a Payload column of type VARCHAR(MAX), and generated synthetic data for 100 sensors covering an entire month. Each sensor had its own “missing” time windows to simulate real-life network disruptions. These windows were later used to insert backfilled data — just as happened in production.
In real deployments, the client routed late-arriving data via dynamically created staging tables (named like sensor_28_3ABF1298…) before merging it into the main table. My simulation does the same.
The goal is to reproduce the exact insertion pattern that triggered thousands of subtle but expensive page-splits:
|
1 2 3 4 5 6 7 8 9 10 11 12 13 14 15 16 17 18 19 20 21 22 23 24 25 26 27 28 29 30 31 32 33 34 35 36 37 38 39 40 41 42 43 44 45 46 47 48 49 50 51 52 53 54 55 56 57 58 59 60 61 62 63 64 65 66 67 68 69 70 71 72 73 74 75 76 77 78 79 80 81 82 83 84 85 86 87 88 89 90 91 92 93 94 95 96 97 98 99 |
DECLARE @StartDate DATETIME = '2020-01-01'; DECLARE @EndDate DATETIME = '2020-01-31'; DECLARE @SensorId INT = 1; WHILE @SensorId <= 10 BEGIN DECLARE @MissingStart DATE = NULL, @MissingEnd DATE = NULL; IF @SensorId BETWEEN 10 AND 13 BEGIN SET @MissingStart = '2020-01-04'; SET @MissingEnd = '2020-01-07'; END ELSE IF @SensorId BETWEEN 18 AND 25 BEGIN SET @MissingStart = '2020-01-09'; SET @MissingEnd = '2020-01-15'; END ELSE IF @SensorId BETWEEN 20 AND 60 BEGIN SET @MissingStart = '2020-01-05'; SET @MissingEnd = '2020-01-11'; END ELSE IF @SensorId BETWEEN 28 AND 42 BEGIN SET @MissingStart = '2020-01-18'; SET @MissingEnd = '2020-01-25'; END ELSE IF @SensorId BETWEEN 42 AND 57 BEGIN SET @MissingStart = '2020-01-11'; SET @MissingEnd = '2020-01-15'; END ELSE IF @SensorId BETWEEN 10 AND 30 BEGIN SET @MissingStart = '2020-01-25'; SET @MissingEnd = '2020-01-29'; END ELSE IF @SensorId BETWEEN 28 AND 55 BEGIN SET @MissingStart = '2020-01-02'; SET @MissingEnd = '2020-01-07'; END ELSE IF @SensorId BETWEEN 33 AND 50 BEGIN SET @MissingStart = '2020-01-10'; SET @MissingEnd = '2020-01-25'; END ELSE IF @SensorId BETWEEN 45 AND 70 BEGIN SET @MissingStart = '2020-01-17'; SET @MissingEnd = '2020-01-25'; END ELSE IF @SensorId BETWEEN 80 AND 97 BEGIN SET @MissingStart = '2020-01-10'; SET @MissingEnd = '2020-01-27'; END DECLARE @UUIDSuffix NVARCHAR(36) = CONVERT(NVARCHAR(36), NEWID()); DECLARE @SensorTableName NVARCHAR(128) = N'sensor_' + CAST(@SensorId AS NVARCHAR) + '_' + @UUIDSuffix; DECLARE @CreateSQL NVARCHAR(MAX) = ' IF OBJECT_ID(''' + @SensorTableName + ''') IS NULL CREATE TABLE ' + QUOTENAME(@SensorTableName) + ' ( SensorId INT NOT NULL, ReadingTime DATETIME NOT NULL, Value FLOAT NULL, Payload VARCHAR(MAX) NULL )'; EXEC sp_executesql @CreateSQL; DECLARE @Current DATETIME = @StartDate; WHILE @Current < @EndDate BEGIN IF (@MissingStart IS NULL OR @Current < @MissingStart OR @Current >= @MissingEnd) BEGIN DECLARE @Payload NVARCHAR(MAX) = 'Battery=92%;GPS=27.1,78.3;CRC=0xAB12F3'; INSERT INTO dbo.Telemetry (SensorId, ReadingTime, Value, Payload) VALUES (@SensorId, @Current, RAND() * 100, @Payload); DECLARE @InsertSensorSQL NVARCHAR(MAX) = ' INSERT INTO ' + QUOTENAME(@SensorTableName) + ' (SensorId, ReadingTime, Value, Payload) VALUES (' + CAST(@SensorId AS NVARCHAR) + ', ''' + CONVERT(NVARCHAR, @Current, 120) + ''', ' + CAST(RAND() * 100 AS NVARCHAR) + ', ''' + @Payload + ''')'; EXEC sp_executesql @InsertSensorSQL; END SET @Current = DATEADD(SECOND, 10, @Current); END IF @MissingStart IS NOT NULL BEGIN INSERT INTO dbo.MissingDataLog (SensorId, MissingMonthStart, MissingMonthEnd) VALUES (@SensorId, @MissingStart, @MissingEnd); END SET @SensorId += 1; END |
Backfilling the Data Behavior and Witnessing Page Splits
The following script simulates how real-world IoT sensor backfilling triggers page-splits in SQL Server.
In production, telemetry data from sensors often doesn’t arrive on time due to GSM issues, power loss, or firmware-level buffering. When the network reconnects, the device pushes old data into the database — sometimes minutes, hours, or even days late. This is known as backfilling.
Now here’s the catch: if your clustered index is on (SensorId, ReadingTime), and the late data falls into an older time range, SQL Server must insert it into already-filled pages. If those pages don’t have enough space, a page split is triggered, thereby causing extra I/O, CPU spikes, TempDB usage, and sometimes query stalls.
The query below simulates exactly this kind of backfill for one sensor:
|
1 2 3 4 5 6 7 8 9 10 11 12 13 14 15 16 17 18 19 20 21 |
DECLARE @SensorId INT = 32; DECLARE @StartDate DATETIME = '2020-01-10'; DECLARE @EndDate DATETIME = '2020-01-27'; -- Step 1: Find the sensor-specific staging table DECLARE @SensorTable NVARCHAR(128); -- latest table in case of multiple SELECT TOP 1 @SensorTable = name FROM sys.tables WHERE name LIKE 'sensor_' + CAST(@SensorId AS NVARCHAR) + '_%' ORDER BY create_date DESC; -- Sanity check IF @SensorTable IS NULL BEGIN RAISERROR('Sensor staging table not found for SensorId = %d', 16, 1, @SensorId); RETURN; END -- Step 2: Delete overlapping data from main table (optional, for clean re-run) DELETE FROM dbo.Telemetry WHERE SensorId = @SensorId AND ReadingTime BETWEEN @StartDate AND @EndDate; -- Step 3: Build and execute dynamic insert DECLARE @SQL NVARCHAR(MAX) = ' INSERT INTO dbo.Telemetry (SensorId, ReadingTime, Value, Payload) SELECT SensorId, ReadingTime, Value, Payload FROM ' + QUOTENAME(@SensorTable) + ' WHERE ReadingTime BETWEEN @Start AND @End ORDER BY SensorId, ReadingTime;'; -- Step 4: Execute with parameters EXEC sp_executesql @SQL, N'@Start DATETIME, @End DATETIME', @Start = @StartDate, @End = @EndDate; |
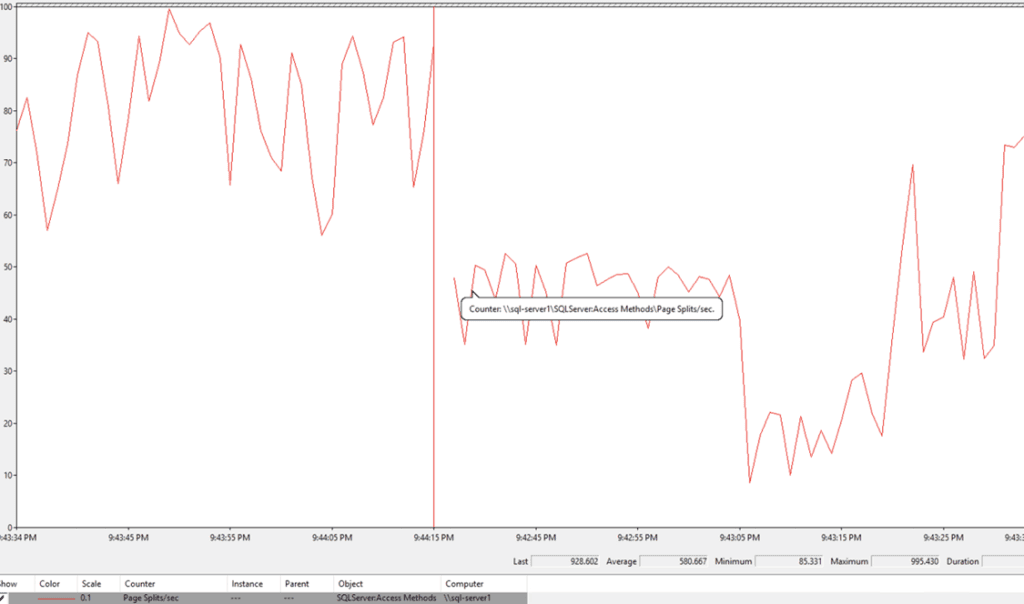
The maximum page split was 995 for the three-sensor backfilling:
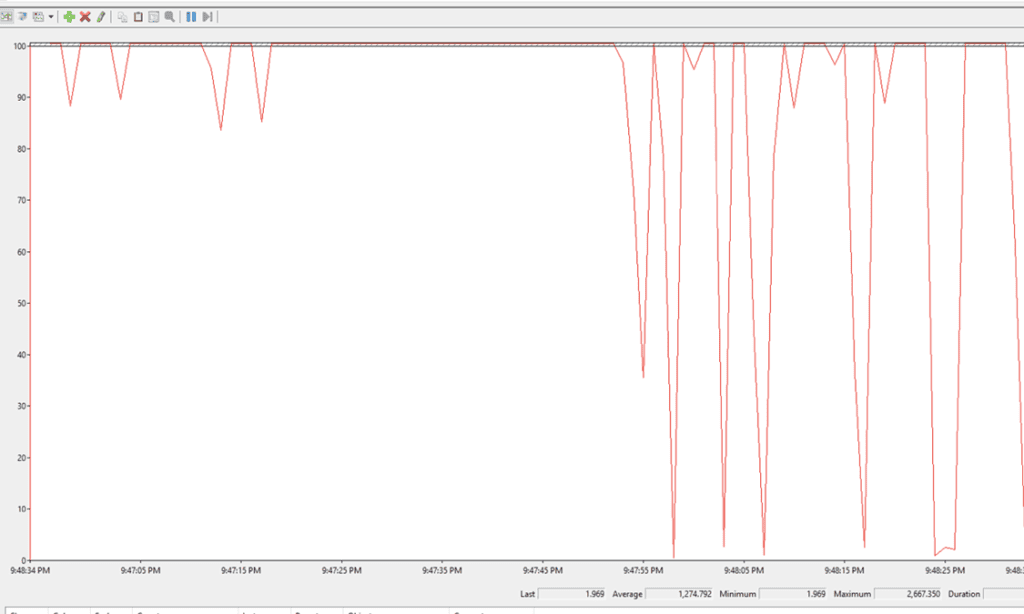
The maximum page split then skyrocketed to 1900-2000 for six sensors backfilling:
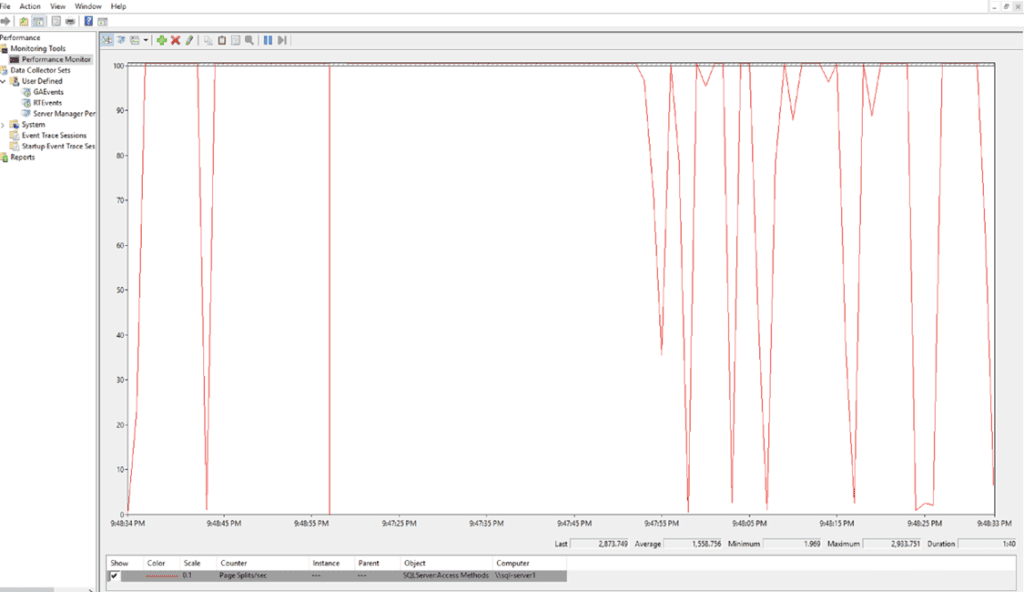
And finally, the maximum page split further increased to 2933 for nine sensors backfilling:
Alternate Way to Simulate the Same Page Split Effect
If you don’t want to pull from the stage table (i.e sensor_n_uuid), but still want to trigger the same pattern of page splits, you can directly insert bloated rows into the Telemetry table using a loop. Here’s a quick way to simulate the same behavior and page-splits:
|
1 2 3 4 5 6 7 8 9 10 11 12 13 14 |
DELETE FROM dbo.Telemetry WHERE SensorId = 32 AND ReadingTime BETWEEN '2020-01-10' AND '2020-01-27'; DECLARE @Current DATETIME = '2020-01-18'; DECLARE @EndDate DATETIME = '2020-01-25'; DECLARE @SensorId INT = 32; DECLARE @Payload NVARCHAR(MAX); WHILE @Current < @EndDate BEGIN -- Generate ~8000 character payload (simulate full page fill pressure) SET @Payload = REPLICATE('X', 8000); INSERT INTO dbo.Telemetry (SensorId, ReadingTime, Value, Payload) VALUES (@SensorId, @Current, RAND() * 100, @Payload); SET @Current = DATEADD(SECOND, 10, @Current); END |
High TempDB Usage
To load sensor data back into the Telemetry table, we followed a dynamic insert pattern like this:
|
1 2 3 4 5 6 |
DECLARE @SQL NVARCHAR(MAX) = ' INSERT INTO dbo.Telemetry (SensorId, ReadingTime, Value, Payload) SELECT SensorId, ReadingTime, Value, Payload FROM ' + QUOTENAME(@SensorTable) + ' WHERE ReadingTime BETWEEN @Start AND @End ORDER BY SensorId, ReadingTime;'; |
This query seems harmless — it’s a simple INSERT … SELECT with an ORDER BY to maintain clustering order. But the catch lies in the source table: sensor_n_UUID.
In most production patterns, staging tables don’t carry indexes. They’re short-lived, used for quick loads, and often dropped or truncated after merge — so adding indexes is skipped for simplicity and performance reasons. While that works for unordered appends, it hurts badly when you’re inserting into a clustered index that depends on order.
Without an index on (SensorId, ReadingTime) in the staging table, SQL Server must sort the entire result set before inserting while doing ORDER BY — and that sort spills into TempDB.
We tracked backfilling TempDB usage via the following queries:
|
1 2 3 4 5 |
-- Shows TempDB usage by backfilling write session(54) SELECT session_id, request_id, user_objects_alloc_page_count, user_objects_dealloc_page_count, internal_objects_alloc_page_count, internal_objects_dealloc_page_count, total_allocated_kb = (user_objects_alloc_page_count + internal_objects_alloc_page_count) * 8, total_deallocated_kb = (user_objects_dealloc_page_count + internal_objects_dealloc_page_count) * 8 FROM sys.dm_db_task_space_usage WHERE session_id = 54 -- replace with actual SPID like 54 ---TOTAL TEMPDB USAGE BY backfilling session(54) SELECT session_id, total_allocated_kb = (user_objects_alloc_page_count + internal_objects_alloc_page_count) * 8, total_deallocated_kb = (user_objects_dealloc_page_count + internal_objects_dealloc_page_count) * 8 FROM sys.dm_db_session_space_usage WHERE session_id = 54 |
As seen below, the query showed that a single session (session_id = 54) consumed over 1.7 GB of TempDB, entirely from sorting unindexed data during a backfill insert:
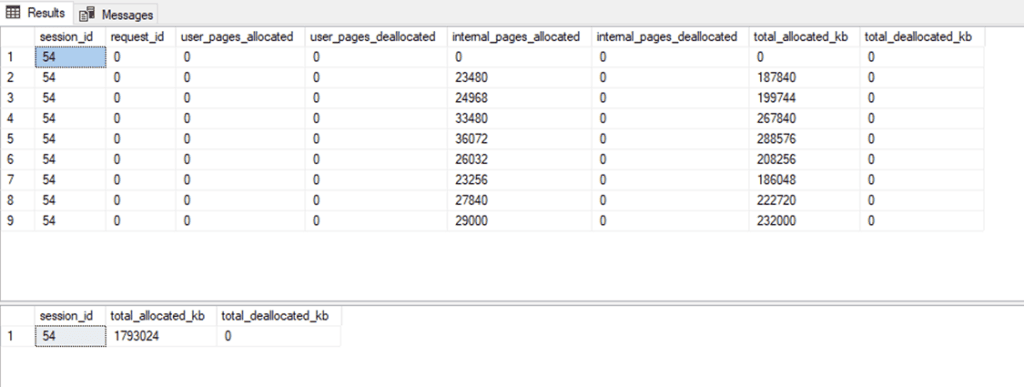
Now imagine if this wasn’t just the one sensor — the system was backfilling data from dozens of sensors in parallel, each running its own session. If each session consumes a similar amount of TempDB, the load multiplies rapidly, overwhelming TempDB with internal sort spills, leading to disk I/O pressure, latch contention, and severe slowdowns. This is how one innocent-looking insert pattern can quietly choke a high-performance SQL Server.
Observing the Impact on CPU
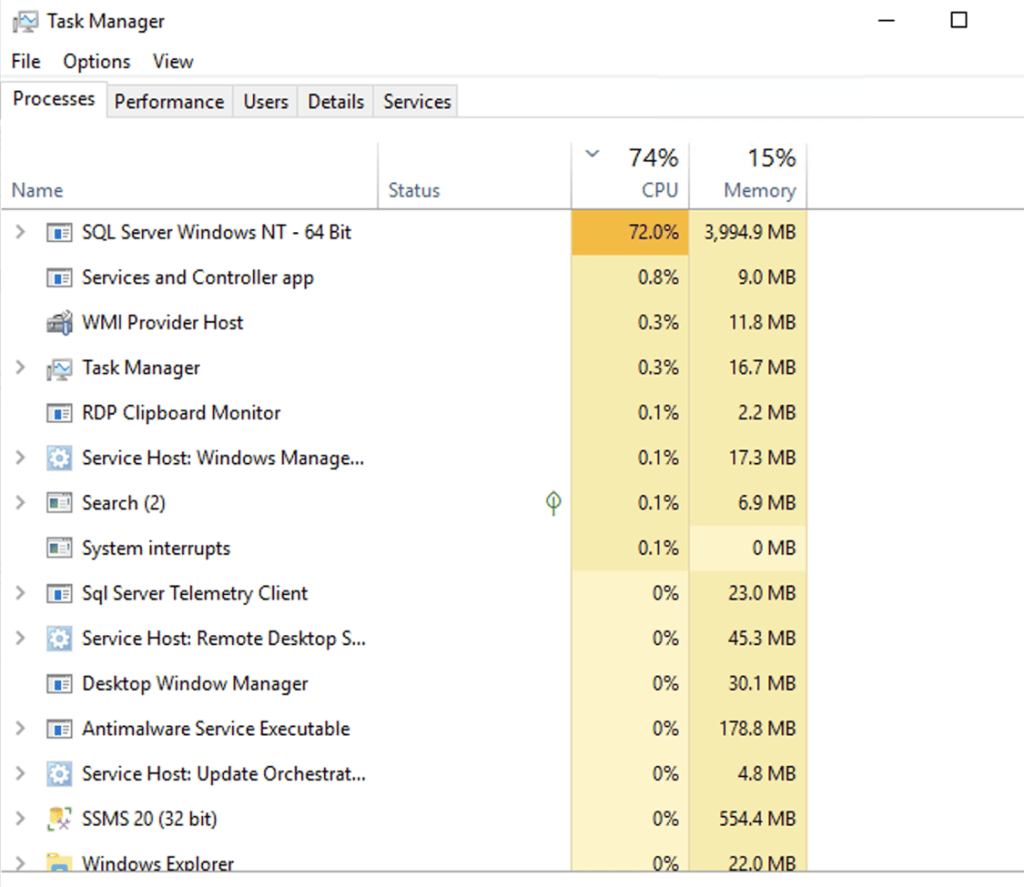
Many analytic queries were running against this table during normal operations — including complex windowed aggregates like moving averages, deltas, and payload parsing. The query below is one such example of an analytic query in IOT-based environments:
|
1 2 3 4 5 6 7 8 9 10 11 12 13 |
SELECT t.SensorId, t.ReadingTime, t.Value, LEN(t.Payload) AS PayloadLength, AVG(t.Value) OVER (PARTITION BY t.SensorId ORDER BY t.ReadingTime ROWS BETWEEN 50 PRECEDING AND CURRENT ROW) AS MovingAvg, LEAD(t.Value, 1) OVER (PARTITION BY t.SensorId ORDER BY t.ReadingTime) - LAG(t.Value, 1) OVER (PARTITION BY t.SensorId ORDER BY t.ReadingTime) AS ValueDelta, CHARINDEX('GPS=', t.Payload) AS GpsStartPos,DENSE_RANK() OVER (PARTITION BY t.SensorId ORDER BY t.ReadingTime DESC) AS RankByTime,COUNT(*) OVER (PARTITION BY t.SensorId) AS TotalPointsForSensor FROM dbo.Telemetry t WHERE t.ReadingTime BETWEEN '2020-01-10' AND '2020-01-27' ORDER BY t.SensorId, t.ReadingTimeOPTION (MAXDOP 8); |
On a healthy table, it runs fine. But due to massive page splits and bloated row sizes from backfills, logical reads ballooned, and each query had to scan more pages than necessary. CPU utilization spiked, and even basic reporting saw latency. This wasn’t because the analytics were expensive — it was because the physical structure of the table collapsed underneath massive page splits.
In our simulated environment, this query gave 72% usage without any other load, though we were using parallelism:
The Fixes That Brought It All Back Under Control
We didn’t rely on a single fix. Instead, we addressed the immediate symptoms and redesigned parts of the system for long-term stability.
Changed Primary Key to a Surrogate Identity Key
The original clustered primary key on (SensorId, ReadingTime) was well-intentioned but unsuitable for a backfilled, out-of-order insert workload. Every late insert had to go back into already full index pages, triggering page splits. We replaced it with a sequential surrogate key using an identity column:
|
1 2 3 4 5 6 7 |
CREATE TABLE dbo.Telemetry ( TelemetryId BIGINT IDENTITY(1,1) PRIMARY KEY CLUSTERED, SensorId INT NOT NULL, ReadingTime DATETIME NOT NULL, Value FLOAT NULL, Payload VARCHAR(MAX) NULL -- retained during initial fixes ); |
This change ensured all inserts remained sequential regardless of the timestamp, immediately improving the write throughput and drastically reducing page splitting to almost zero because of the main Telemetry table.
Created Indexes on Staging Tables
When loading backfilled data from per-sensor staging tables, we were doing ORDER BY SensorId, ReadingTime on tables that had no indexes. That caused massive sort operations and heavy TempDB spills. To fix this, we added clustered indexes on staging tables from the application backend:
|
1 2 |
CREATE CLUSTERED INDEX IX_sensor_1_UUID123 ON sensor_1_UUID123 (SensorId, ReadingTime); |
This reduced TempDB I/O significantly and helped us to avoid 1–2 GB of allocation spikes per session.
Long-Term Architectural Fixes
Removed Payload from Main Table
One of the heaviest design issues was the use of VARCHAR(MAX) payloads embedded directly in the main table. These long strings significantly reduced the number of rows per page and made every insert more expensive. In the long-term fix, we removed this field entirely from the primary OLTP table and moved the data to file-based object storage. We then replaced the column with a pointer:
|
1 2 3 4 5 6 7 |
-- Updated schema CREATE TABLE dbo.Telemetry ( TelemetryId BIGINT IDENTITY(1,1) PRIMARY KEY CLUSTERED, SensorId INT NOT NULL, ReadingTime DATETIME NOT NULL, Value FLOAT NULL, PayloadPath VARCHAR(500) NULL ); |
This required minor changes in the application layer to retrieve payloads only when necessary — usually in reporting or investigation workflows.
Established Index and Statistics Maintenance
We added weekly index rebuilds and stat updates across heavy-write tables to keep performance consistent. As we had SQL Server’s Enterprise version, we were able to perform online rebuilds on regular intervals:
|
1 2 |
ALTER INDEX ALL ON dbo.Telemetry REBUILD WITH (ONLINE=ON, FILLFACTOR = 80); UPDATE STATISTICS dbo.Telemetry WITH FULLSCAN; |
Implemented Purging Policies
To control table size and long-range scan costs, we defined a purging policy that deleted telemetry older than 90 days. After such massive deletes we made sure to rebuild the index and update the statistics:
|
1 2 |
DELETE FROM dbo.Telemetry WHERE ReadingTime < DATEADD(MONTH, -3, GETDATE()); |
Planned for Partitioning
To further isolate hot and cold data zones, we began designing monthly range-based table partitions.
Stress Testing via PowerShell
We simulated parallel inserts using PowerShell jobs:
|
1 2 3 4 5 6 |
1..50 | ForEach-Object { Start-Job -ScriptBlock { Invoke-Sqlcmd -ServerInstance 'MyServer' -Database 'simple_talk' \ -Query "INSERT INTO ... SELECT FROM sensor_x ORDER BY SensorId, ReadingTime" } } |
The Outcome
Page splits/sec dropped from 3000/sec to under 5/sec, CPU stabilized around 30% peak, TempDB contention almost disappeared, and the Insert latency reduced by 80%.
What Have We Learned?
- Payloads don’t belong in clustered indexes
- Avoid mid-key inserts on composite Primary Keys
- Use
FILLFACTORwisely but don’t depend on it alone, as page splits could be due to other reasons as well – like in our simulation - Monitor page splits/sec, runnable_tasks_count, and TempDB read/write latency
In hindsight, the system didn’t fail because of SQL Server, IoT, or page splits. It failed because of a gap between how the data was expected to behave and how it actually behaved. The database followed its instructions perfectly, but those instructions were based on assumptions that didn’t survive contact with reality.
This isn’t just an IoT cautionary tale. Any system that experiences high write volumes, irregular insert patterns or underestimated payloads is vulnerable to the same silent sabotage. What saved the day wasn’t a single clever fix. It was a willingness to revisit core design choices, monitor the right metrics, simulate the system in a test cell, and respond to the story the data was telling.
Databases are remarkably obedient — and that’s both their strength and their danger.
This document contains proprietary information and is protected by copyright law.
Copyright © 2026 Red Gate Software Limited. All rights reserved
Load comments