
Page splits have the ability to slow down our queries and increase the amount of IOs needed to retrieve our data. We need to monitor and identify the source of page splits to avoid them in our databases.
We can monitor page splits with extended events, there is an event called ‘page_split’. The problem is that there are many kinds of page splits and we need to monitor only the bad ones. The ‘page_split’ event doesn’t identify if the page split is a bad one.
When one page becomes full and a new page is needed this is reported as a page split, but this is a regular operation with no bad consequences for our queries. The problem happens with updates and non-sequential inserts, when the row needs to be inserted in the middle of the pages of the object and there is no space for this. SQL Server creates a new page, transfers half of the page data to the new page and writes the row data. This creates page fragmentation and is very bad for performance and is also reported as page split.
We can find the bad page splits using the event sql_server.transaction_log. This event monitors all the activities in the transaction log, because that we need to use with caution. We can filter the ‘operation’ field looking for the value 11, which means LOP_DELETE_SPLIT. This is the deletion of rows that happens when SQL Server is moving rows from one page to another in a page split, a bad page split.
We can’t use the XE interface to create a session with this event, it’s not visible in the interface. We need to create the session by t-sql. The code to create the session will be this:
|
1 2 3 4 5 6 7 8 9 10 11 12 13 14 15 |
CREATE EVENT SESSION [BadSplits] ON SERVER ADD EVENT sqlserver.transaction_log( WHERE operation = 11 -- LOP_DELETE_SPLIT ) ADD TARGET package0.event_file -- You need to customize the path (SET filename=N'C:\xel\badsplits.xel') GO -- Start the session ALTER EVENT SESSION [BadSplits] ON SERVER STATE = start; GO |
After some time, we can query this session to find the source of page split problem. The first challenge is to find the database where the page splits are happening.
To read the information in the files we need to use the DMF sys.fn_xe_file_target_read_file, but the information will be returned in XML format, so we need to use XML methods to retrieve the information from inside the XML document.
The query will be this:
|
1 2 3 4 5 6 7 8 9 10 11 12 13 |
with qry as (select -- Retrieve the database_id from inside the XML document theNodes.event_data.value('(data[@name="database_id"]/value)[1]','int') as database_id from (select convert(xml,event_data) event_data -- convert the text field to XML from -- reads the information in the event files sys.fn_xe_file_target_read_file('c:\xel\badsplits*.xel', NULL, NULL, NULL)) theData cross apply theData.event_data.nodes('//event') theNodes(event_data) ) select db_name(database_id),count(*) as total from qry group by db_name(database_id) -- group the result by database order by total desc |
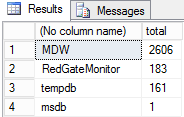
Now that we know the database with most page splits, we need to identify the objects that are causing the problem. The XE event only returns the allocation_unit_id, so we need to convert the allocation_unit_id to the object name that owns these pages.
The query to convert the allocation_unit_id to the object name needs to run on the database that contains the allocation units and we will filter the result from XE for this specific database. We need to join the result with the DMV sys.allocation_units using the allocation_unit_id field. This DMV has three kinds of allocation units but we are interested only in two of them, type 1 and type 3, that means data row pages and row overflow pages.
We need to add sys.partitions to the query, join the container_id field of sys.allocation_units with hobt_id field in sys.partitions. Finally we add sys.objects to the query, joining with object_id field from sys.partitions and get the name from sys.objects.
|
1 2 3 4 5 6 7 8 9 10 11 12 13 14 15 16 17 18 |
with qry as (select theNodes.event_data.value('(data[@name="database_id"]/value)[1]','int') as database_id, theNodes.event_data.value('(data[@name="alloc_unit_id"]/value)[1]','varchar(30)') as alloc_unit_id, theNodes.event_data.value('(data[@name="context"]/text)[1]','varchar(30)') as context from (select convert(xml,event_data) event_data from sys.fn_xe_file_target_read_file('c:\xel\badsplits*.xel', NULL, NULL, NULL)) theData cross apply theData.event_data.nodes('//event') theNodes(event_data) ) select name,context,count(*) as total -- The count of splits by objects from qry,sys.allocation_units au, sys.partitions p, sys.objects ob where qry.alloc_unit_id=au.allocation_unit_id and au.container_id=p.hobt_id and p.object_id=ob.object_id and (au.type=1 or au.type=3) and db_name(database_id)='MDW' -- Filter by the database group by name,context -- group by object name and context order by name |
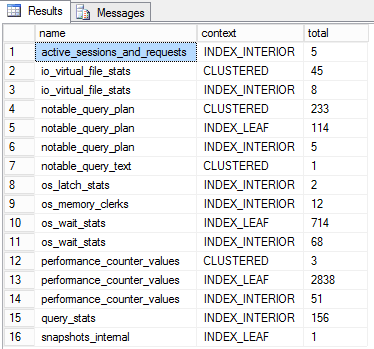
Now that we know the table that’s causing most of page splits, we can analyze the indexes of this table to solve the problem.
Although this solution can identify page split problems, we can’t let this session stay started for a long time because we are capturing transaction log activities, this kind of capture can be too intensive for the server. We can, however, use Redgate SQL Monitor to point to us when there is a page split problem in the server and only then start this session for a short period to identify the source of the problem.
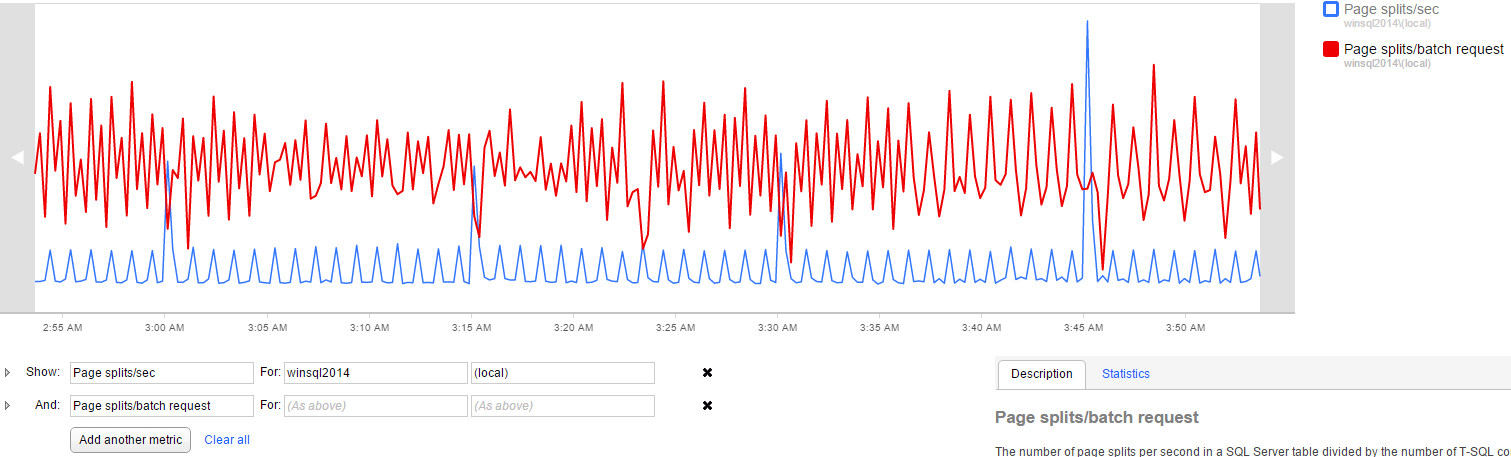
SQL Monitor can create analysis graphs based on several performance counters. In this case we should use ‘page splits/sec’ and ‘page splits/batch requests’.
We should create a baseline to identify the regular values of these counters in our environment, so when we notice these values increasing we can use the XE session to identify the source of the page split problem.
This document contains proprietary information and is protected by copyright law.
Copyright © 2026 Red Gate Software Limited. All rights reserved


Load comments