Parameter sniffing becomes a problem when SQL Server caches a query plan optimized for one set of parameter values that performs terribly for others – common with skewed data distributions. Query Store (available since SQL Server 2016) makes diagnosing this straightforward: it captures all plan variations for parameterized queries, letting you compare execution stats and force the optimal plan. This article demonstrates the problem practically using AdventureWorks, shows how to identify affected queries in Query Store, and walks through three fix strategies: plan forcing, OPTIMIZE FOR hints, and RECOMPILE.
Introduction
Although parameterization problems can have a serious impact on the performance of a SQL Server database, it isn’t easy to determine which queries have the problem so that you can fix the issues that are causing them to run slowly. Although it is relatively easy to determine whether a specific query has a parameterization problem, it is more difficult to then identify all the other queries that have this kind of problem in the server. If we can do this, and resolve the problem for each query, it will improve the overall performance of the database.
As well as being a very important new tool in SQL Server 2016, Query Store can also help us to find all the queries with parameterization problems in a SQL Server, and to fix them. In this article I will show you how that’s done.
What is the Parameterization Problem?
When SQL Server receives a new query, the query is compiled and the resulting query plan is stored in memory, in the query plan cache, so the plan can, if possible, be reused.: The query itself is also stored with it as a string. Every time the same query, with the same text, is executed again, the query plan will be re-used from the cache.
However, if the text was saved unaltered, all queries that have predicates seeking for specific information, such as the client record for customer 135, would have this specific information stored in the cache. In consequence, a query that, for example, was seeking for a particular client record would only be reused if a new query was made seeking for the same client. If a new query asked for a different client, it would be compiled again and stored, with no reuse. This would result in excessive query compilations, thereby affecting server performance.
To get around this problem, SQL Server ‘parameterizes’ the query string. The way it does this is controlled by a database property called Parameterization. The default configuration, ‘Simple’, allows SQL Server to judge whether to parameterize a query or not, so that some but not all queries are parameterized.
When SQL Server decides to parameterize a query, the information in the query are replaced by parameters, and this parameterized query is stored in cache along with its plan. If another query is made that after this parameter substitution resolves to the same query, then the plan can be reused, thereby potentially saving considerable time and CPU.
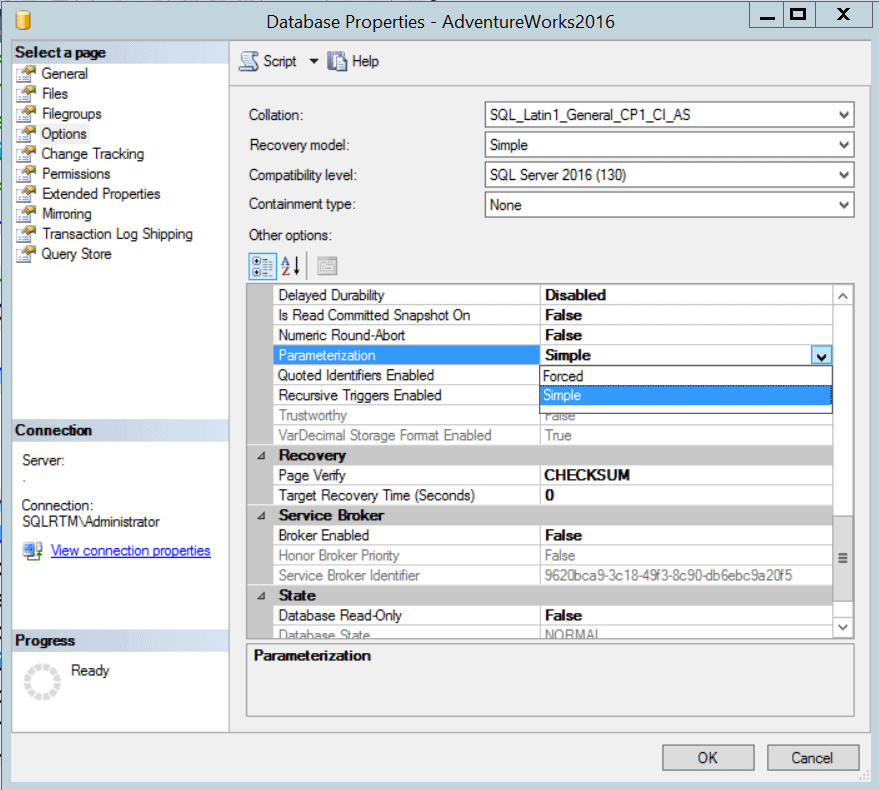
You might think that all such queries should be parameterized, and so be tempted to change the Parameterization option to ‘Forced‘; but there is a catch: Some queries have a terrible behavior when parameterized. When allowed to, with ‘simple’ parameterization, SQL Server parameterizes just a small percentage of queries that it caches, using a complex heuristic, to avoid parameterizing a query that shouldn’t be parameterized.
As well as using the ‘forced’ Parameterization configuration, a query can also be parameterized by the developer. The developer can call sp_execute_sql procedure to send a parameterized query to the database. In fact, several ORM (Object-Relational Mapping) frameworks, such as Entity Framework, uses this procedure automatically.
Batches of queries inside stored procedures are also parameterized by the developer, using the stored procedure parameters, or the batches provided to sp_execute_sql. This means that they can also be subject to parameterization problems.
The problem itself happens when we parameterize a query or batch that shouldn’t be parameterized. If the data distribution for the column used in the predicate is particularly skewed, some queries would have a terrible execution plan for some values of the predicate: Everything goes well if the values are equally distributed, but if they aren’t, then we are likely to have a problem because the strategy in the cached query plan would be poor. Sometimes, the first time that the query is used, it uses an atypical parameter so that the stored plan is inappropriate for the majority of subsequent queries. This can lead to a query running uncharacteristically slowly on occasion. (see Parameter Sniffing)
All this seems a bit nebulous when just described: So, in the first part of this article, we will illustrate the problem practically, and then we’ll show how to investigate it and solve it. First. We must set up a test environment to demonstrate these points.
Read also: SQL Server triggers and performance impact
Demonstration Environment
I will do all the demonstrations of parameterization using the sample database ‘AdventureWorks2016’, which you can download at https://www.microsoft.com/en-us/download/details.aspx?id=49502.
I will also use a function that I’ve developed called ‘plancachefromdatabase’, which allow us to check the content of the plan cache of a specific database. I explained about this function in a previous article I wrote on Simple-Talk called https://www.simple-talk.com/sql/t-sql-programming/checking-the-plan-cache-warnings-for-a-sql-server-database/
Execute the code below in the ‘AdventureWorks2016’ database to create the function, preparing the environment for the demonstrations.
|
1 2 3 4 5 6 7 8 9 10 11 12 13 14 15 16 17 18 19 20 21 22 23 24 25 26 27 28 29 30 31 32 33 34 35 36 37 38 |
-- ============================================= -- Author: Dennes Torres -- Create date: 01/23/2015 -- Description: return the query plans in cache for a specific database -- ============================================= CREATE FUNCTION [dbo].[planCachefromDatabase] ( -- Add the parameters for the function here @DatabaseName varchar(50) ) RETURNS TABLE AS RETURN ( with xmlnamespaces (default 'http://schemas.microsoft.com/sqlserver/2004/07/showplan') select qp.query_plan,qt.text, statement_start_offset, statement_end_offset, creation_time, last_execution_time, execution_count, total_worker_time, last_worker_time, min_worker_time, max_worker_time, total_physical_reads, last_physical_reads, min_physical_reads, max_physical_reads, total_logical_writes, last_logical_writes, min_logical_writes, max_logical_writes, total_logical_reads, last_logical_reads, min_logical_reads, max_logical_reads, total_elapsed_time, last_elapsed_time, min_elapsed_time, max_elapsed_time, total_rows, last_rows, min_rows, max_rows from sys.dm_exec_query_stats CROSS APPLY sys.dm_exec_sql_text(sql_handle) qt CROSS APPLY sys.dm_exec_query_plan(plan_handle) qp where qp.query_plan.exist('//ColumnReference[fn:lower-case(@Database)=fn:lower-case(sql:variable("@DatabaseName"))]')=1 ) GO |
I will also use the tables generated by the script called ‘Make_Big_Adventure’, created by Adam Machanic. You can download the script here (http://sqlblog.com/blogs/adam_machanic/archive/2011/10/17/thinking-big-adventure.aspx) and execute it in ‘AdventureWorks2016’. You need to change the first line of the script, changing the ‘Use’ instruction to ‘Use Adventureworks2016’.
Finally, we also will use a new index over the table ‘BigProduct’. Below you can see the ‘create index’ instruction, execute it in ‘AdventureWorks2016’ database.
|
1 2 3 |
CREATE NONCLUSTERED INDEX indPrice ON [dbo].[BigProduct] ([ListPrice]) GO |
Demonstrating Parameterization
These four queries below will illustrate the simple parameterization: two of them will be parameterized and the other two will not. We can check this by using queries over the system tables to look at what is being stored in the query plan cache.
Let’s execute them step-by-step:
- Select the database and clear the procedure cache
123use AdventureWorks2016goalter database scoped configuration clear procedure_cache
This method of clearing the procedure cache of a single database is new to SQL Server 2016. However, you need to take care with it, and avoid using this procedure in a production database, because it will affect the database performance for a while.
- Select and execute the following query:
1select * from person.Address where city='Bellflower'
It’s important to select the query precisely. If you select a single extra space before or after the query the query optimizer will understand as a different query and the demonstration will fail.
Correct:

Wrong: (extra white space after the string)

Wrong again: (preceding white space in the CR/LF sequence)

- Do the same, select and execute, each one of the following queries, one by one:
123select * from person.Address where city='Sammamish'SELECT * FROM Sales.CreditCard WHERE CreditCardID = 11SELECT * FROM Sales.CreditCard WHERE CreditCardID = 12
- Use the query below to check the plan cache. We are using the custom function we created in the database while preparing the demo:
1select * from dbo.plancachefromdatabase('AdventureWorks2016')
The result will be similar to the image below. You may notice that one of the queries was compiled for each different value in the predicate while the other wasn’t. Using parameterization ‘Simple’ only a small class of queries are parameterized, while using ‘Forced’ all the queries will be parameterized.

Should we use ‘Forced’ parameterization to avoid plan cache bloat? No, we shouldn’t. ‘Forced’ parameterization will parameterize queries that shouldn’t be parameterized and this will become a bigger problem than plan cache bloat. Let’s see an example.
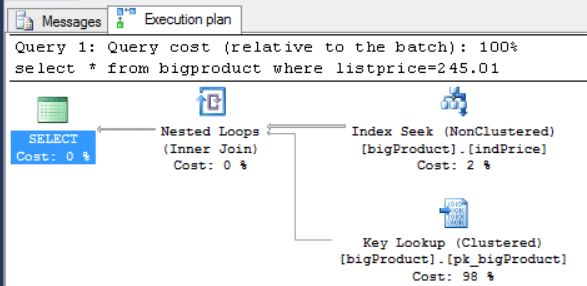
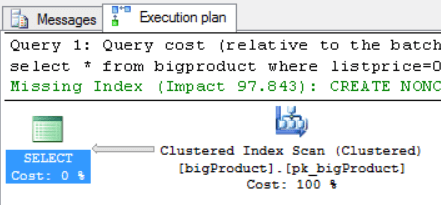
In the next code section, there are two similar queries. These queries are the same, except for the parameter. However, the optimal execution plans of the queries are different. When we use the value 245.01 the plan uses an index seek, but it uses clustered index scan when we use the value 0.
To demonstrate this, select both queries below in SSMS and click the button ‘Display Estimated Execution Plan’. I’m using ‘option (recompile)’ hint, so the queries will be recompiled and we can check the plan of each query:
|
1 2 3 4 5 6 7 8 9 |
/* You don't need to execute the queries below. You just need to select both of them and click the button 'Display Estimated Execution Plan' in SSMS */ select * from bigproduct where listprice=245.01 option (recompile) select * from bigproduct where listprice=0.00 option (recompile) |
The query plans of these queries are below:
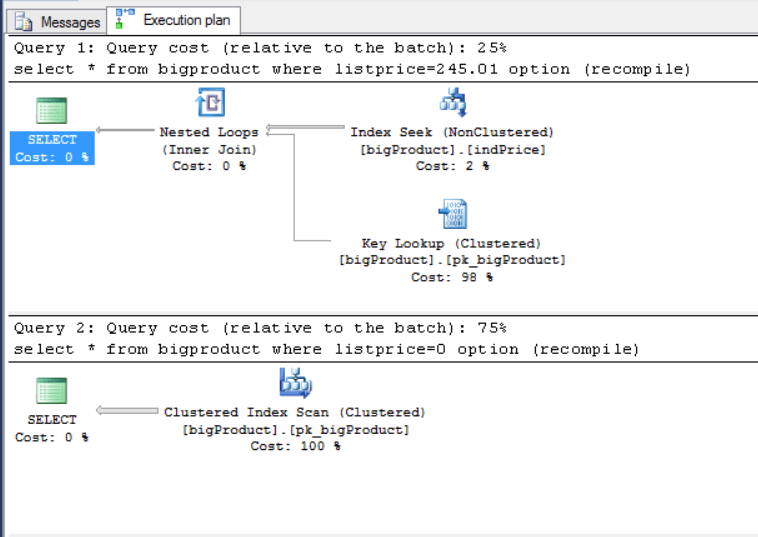
These queries are using a predicate over a field whose data isn’t well distributed in the table. There are ten thousand rows with the value ‘0.00’ while only fifty with the value ‘245.1’. By using the option (recompile) hint, we can see that there is a different query plan for each value. That’s the catch: with badly-distributed values, each value will need its own query plan. In this case, if the query is parameterized, which query plan will SQL Server use?
These troublesome queries could be parameterized for one of several reasons, and the configuration ‘Parameterization:Forced’ is only one of them. There are several developer tools, such as ORMs, that will parameterize the queries and some of them will do this by default.
This is the nature of the problem that we are investigating: Some queries work fine with parameterization, some don’t. We need to identify the queries with parameterization problems and solve the problem.
Identifying the Queries with Parameterization Problems
Let’s first try the same queries that we used to demonstrate parameterization. We’ll use ‘Forced’ parameterization and check what happens when these queries are parameterized. Let’s do it step-by-step.
- First, change the parameterization configuration and clear the database procedure cache:
12345alter database AdventureWorks2016set parameterization forced;goalter database scoped configuration clear procedure_cachego
- Click the ‘Include Actual Execution Plan’ button in SSMS toolbar.
- Select the query below and execute it. You should be careful: If you select any extra whitespace before or after the query, the sample will not work.
1select * from bigproduct where listprice=245.01
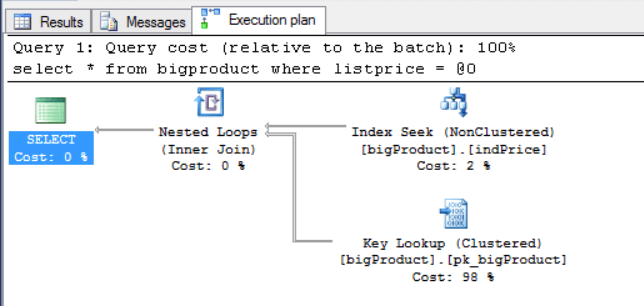
- Repeat the same action for the second query:
1select * from bigproduct where listprice=0.00
The resulting query plan is exactly the same, the second query is re-using the query plan of the firstt one, because they are parameterized.
- Clear the procedure cache again:
12alter database scoped configuration clear procedure_cachego
- Repeat the same procedure, changing the query order. First, execute the following query:
1select * from bigproduct where listprice=0.00
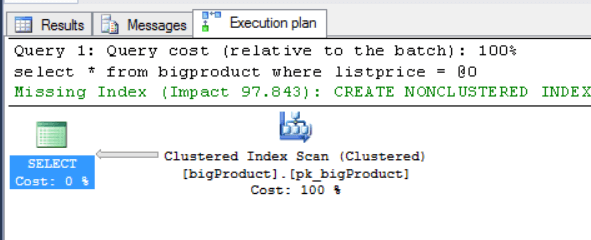
- Repeat the same action for the other query:
1select * from bigproduct where listprice=245.01
Again, the second query plan is the same than the first, the second query is re-using the plan of the first query.
As you have noticed in the demonstration, SQL Server uses the value of the first executed query to build the query plan. The resulting cached plan will be good for some values and terrible for others. We still can use some query hints to force a good enough plan, however the best solution would be to prevent the query being parameterized and for SQL Server to then use the best plan for each value.
We can solve this problem using plan guides, but let’s go a step back. First, we need a way to identify which queries in our server are suffering with parameterization problems. We can do this using query store.
Query Store is a new and very useful tool in SQL Server 2016.
Query Store
The query plan cache only keeps the current plan for each query. Query Store, on the other hand, is able to keep a history of query plans that are used for each query and the execution statistics for each plan. Using this information, we can answer several questions, such as ‘which queries are suffering performance regression?’.
The execution information that Query Store collects can tell us which query is suffering from parameterization problems.
Query Store needs to be enabled in all the databases in which we would like to collect historic query plans and execution statistics. When it is enabled, it stores all the query information in system tables within the database.
Query Store also has some pre-built graphics about the database activity. We can use these graphics whenever we experience regression problems or we can choose to query the information in query store system views (DMVs) to find useful data. However, what I’m proposing here is far from the main objective of query store, but still a very interesting approach to solve an old problem. Due to that, we will use query store system views.
Query Store Schema
Query Store collects information from two different phases of the query processing: The compilation and the execution. From the compilation phase, Query Store collects the query text and query plan, while from the execution phase it collects the execution statistics.
All this information is kept in memory and written asynchronously to the disk, so that the query execution performance isn’t affected by the query store.
The image below illustrates the data capture process used by query store. Since the information is partially in memory until the asynchronous write happens, the query store views join the information in memory and in disk.
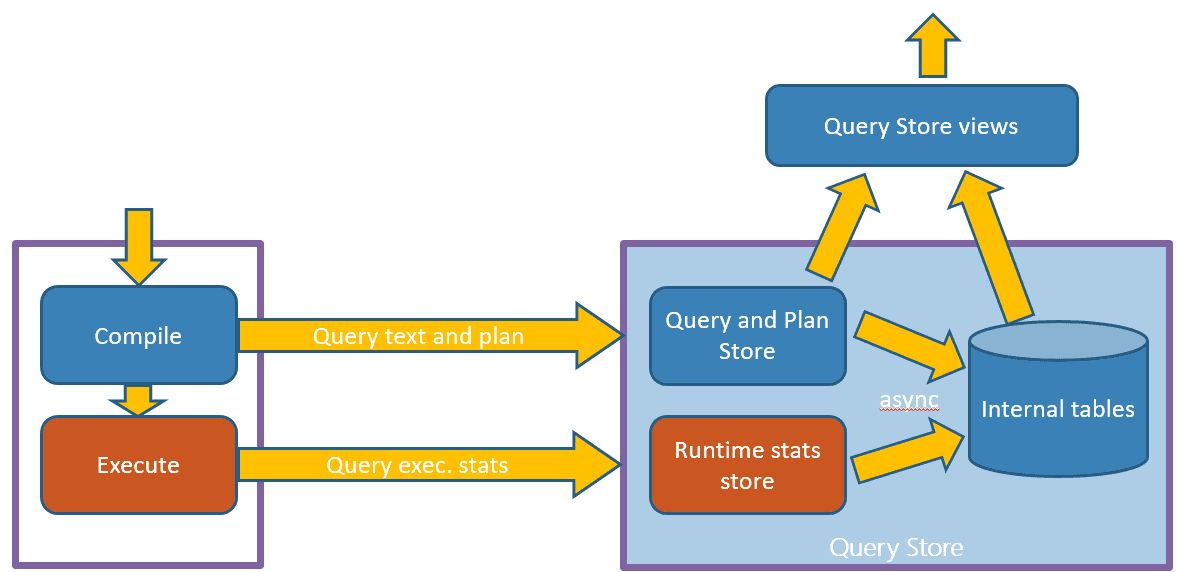
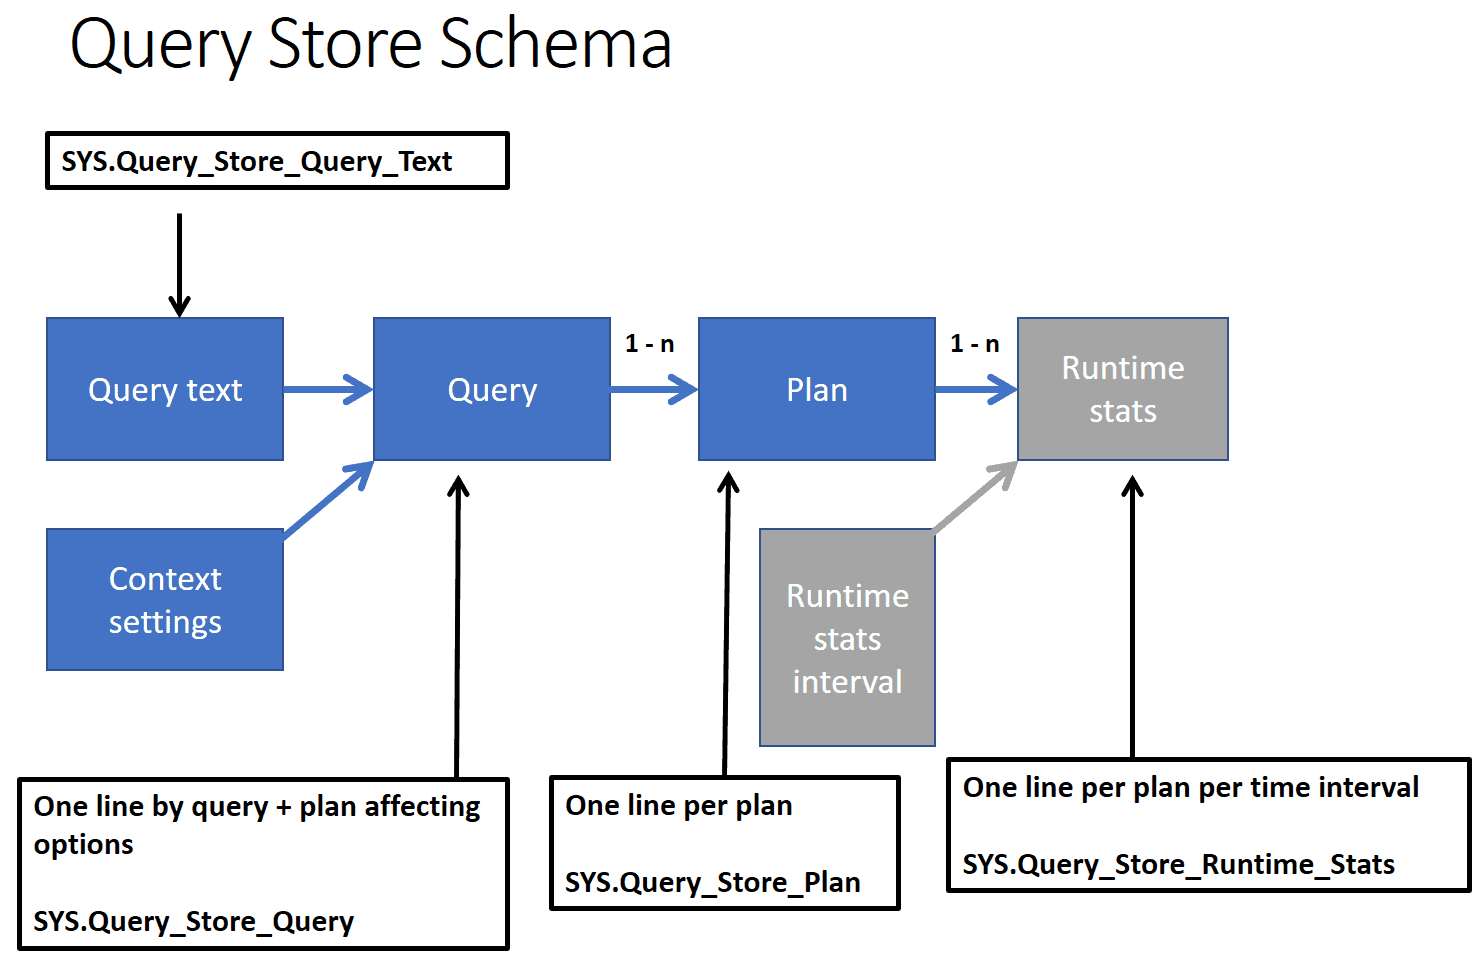
The main DMVs in the QS schema are used to store queries, plans and run-time statistics. For each query, there are several plans and for each plan there are several statistic records. Each statistic record is a summary of all executions during a time interval.
The image below illustrates the query store schema and its DMVs.
Identifying Parameterization Problems
When a query is suffering from parameterization problems, some executions of the query will be far worse than others. By analyzing execution statistics, we can identify average execution numbers and we can also identify the standard deviation from these numbers. Standard Deviation is a difference from the average, to less or more, making a range containing at least 68.26% of the values, in this case, 68.26% of the query executions.
If the standard deviation is low, this means most executions are near the average numbers and the query hasn’t a problem. However, if the query suffers from parameterization problems, some executions are way worse than others, making a high standard deviation.
That’s the way we can use to identify parameterization problems: The queries with the highest standard deviation have this problem. It’s possible, sure, that other problems with the query will also cause a high standard deviation, however, this method allows us to retrieve a promising list of queries that probably have parameterization problems.
Before we go into a step-by-step demonstration, we will need to build the query we will use to find the parameterization problems using the Query Store schema.
Read also:
Extended Events for monitoring query performance
TempDB growth from query spills
Building the main query
- Firstly, we can find, using query store DMVs, all those queries that are parameterized. We can identify this using the ‘query_parameterization_type’ field
1234-- Parameterized Queriesselect *from sys.query_store_querywhere query_parameterization_type<>0
- Now, let’s join the result with the ‘sys.query_store_query_text’ DMV to retrieve the text of the query. We can include an additional filter to retrieve queries which have ‘@’ in the query text. This is needed because queries inside a stored procedure are not identified as parameterized, however if they use the stored procedures parameters they can suffer from the same parameterization problems.
123456-- Parameterized Queries with query textselect query_id,qsqt.query_sql_textfrom sys.query_store_query qsq,sys.query_store_query_text qsqtwhere qsq.query_text_id= qsqt.query_text_idand (query_parameterization_type<>0 or query_sql_text like '%@%')
- By joining the query with the sys.query_store_plan DMV, we can retrieve the most recent query plan used by the query. We also need to include a sub-query in the filter to retrieve only the most recent query plans, rather than all of them.
123456789101112-- Parameterized queries with text and most recent planIdselect qsq.query_id,qsqt.query_sql_text,qsp.plan_idfrom sys.query_store_query qsq,sys.query_store_query_text qsqt,sys.query_store_plan qspwhere qsq.query_text_id= qsqt.query_text_idand qsp.query_id=qsq.query_idand (qsq.query_parameterization_type<>0or qsqt.query_sql_text like '%@%')and qsp.last_execution_time=(select max(last_execution_time)from sys.query_store_plan qsp2where qsp2.query_id= qsp.query_id)
- If we join the query with the ‘sys.query_store_runtime_stats’ DMV, we can retrieve all the execution statistic information from each query plan we retrieved earlier.
12345678910111213141516171819202122-- Parameterized queries with text and most recent planId-- related with runtime statsselect qsq.query_id,qsqt.query_sql_text,qsp.plan_id,qsrs.max_duration,qsrs.max_cpu_time,qsrs.min_cpu_time,qsrs.min_duration,qsrs.stdev_duration,qsrs.stdev_cpu_timefrom sys.query_store_query qsq,sys.query_store_query_text qsqt,sys.query_store_plan qsp,sys.query_store_runtime_stats qsrswhere qsq.query_text_id= qsqt.query_text_idand qsp.query_id=qsq.query_idand qsrs.plan_id=qsp.plan_idand (qsq.query_parameterization_type<>0or qsqt.query_sql_text like '%@%')and qsp.last_execution_time=(select max(last_execution_time)from sys.query_store_plan qsp2where qsp2.query_id= qsp.query_id)order by stdev_cpu_time desc
- The previous query retrieves several execution status rows for each query plan. The Query Store creates a new row for each time interval. We need to group the rows and summarize the values.
12345678910111213141516171819202122232425-- Parameterized queries with text and most recent planId-- related with runtime stats groupedselect qsq.query_id,max(qsqt.query_sql_text) query_sql_text,max(qsp.plan_id) plan_id,max(qsrs.max_duration) max_duration,max(qsrs.max_cpu_time) max_cpu_time,min(qsrs.min_cpu_time) min_cpu_time,min(qsrs.min_duration) min_duration,max(qsrs.stdev_duration) stdev_duration,max(qsrs.stdev_cpu_time) stdev_cpu_timefrom sys.query_store_query qsq,sys.query_store_query_text qsqt,sys.query_store_plan qsp,sys.query_store_runtime_stats qsrswhere qsq.query_text_id= qsqt.query_text_idand qsp.query_id=qsq.query_idand qsrs.plan_id=qsp.plan_idand (qsq.query_parameterization_type<>0or qsqt.query_sql_text like '%@%')and qsp.last_execution_time=(select max(last_execution_time)from sys.query_store_plan qsp2where qsp2.query_id= qsp.query_id)group by qsq.query_idorder by stdev_cpu_time desc
- We need to filter the result to exclude all system queries. I included several filters to achieve this, however if your application uses queries against system tables or system databases, these queries will be excluded too.
123456789101112131415161718192021222324252627282930313233-- Parameterized queries with text and most recent planId-- related with runtime stats grouped-- Filtering system queriesselect qsq.query_id,max(qsqt.query_sql_text) query_sql_text,max(qsp.plan_id) plan_id,max(qsrs.max_duration) max_duration,max(qsrs.max_cpu_time) max_cpu_time,min(qsrs.min_cpu_time) min_cpu_time,min(qsrs.min_duration) min_duration,max(qsrs.stdev_duration) stdev_duration,max(qsrs.stdev_cpu_time) stdev_cpu_timefrom sys.query_store_query qsq,sys.query_store_query_text qsqt,sys.query_store_plan qsp,sys.query_store_runtime_stats qsrswhere qsq.query_text_id= qsqt.query_text_idand qsp.query_id=qsq.query_idand qsrs.plan_id=qsp.plan_idand (qsq.query_parameterization_type<>0or qsqt.query_sql_text like '%@%')and qsq.is_internal_query=0and qsqt.query_sql_text not like '%sys.%'and qsqt.query_sql_text not like '%sys[ ].%'and qsqt.query_sql_text not like '%@[sys@].%' escape '@'and qsqt.query_sql_text not like '%INFORMATION_SCHEMA%'and qsqt.query_sql_text not like '%msdb%'and qsqt.query_sql_text not like '%master%'and qsp.last_execution_time=(select max(last_execution_time)from sys.query_store_plan qsp2where qsp2.query_id= qsp.query_id)group by qsq.query_idorder by stdev_cpu_time desc
- Finally, let’s create a function to turn easier the use of this query. We can’t include the order by inside the function:
|
1 2 3 4 5 6 7 8 9 10 11 12 13 14 15 16 17 18 19 20 21 22 23 24 25 26 27 28 29 30 31 32 33 34 35 36 37 38 39 |
Create FUNCTION dbo.QueriesWithParameterizationProblems() RETURNS TABLE AS RETURN ( -- Parameterized queries with text and most recent planId -- related with runtime stats grouped -- Filtering system queries select qsq.query_id, max(qsqt.query_sql_text) query_sql_text, max(qsp.plan_id) plan_id, max(qsrs.max_duration) max_duration, max(qsrs.max_cpu_time) max_cpu_time, min(qsrs.min_cpu_time) min_cpu_time, min(qsrs.min_duration) min_duration, max(qsrs.stdev_duration) stdev_duration, max(qsrs.stdev_cpu_time) stdev_cpu_time from sys.query_store_query qsq, sys.query_store_query_text qsqt, sys.query_store_plan qsp, sys.query_store_runtime_stats qsrs where qsq.query_text_id= qsqt.query_text_id and qsp.query_id=qsq.query_id and qsrs.plan_id=qsp.plan_id and (qsq.query_parameterization_type<>0 or qsqt.query_sql_text like '%@%') and qsq.is_internal_query=0 and qsqt.query_sql_text not like '%sys.%' and qsqt.query_sql_text not like '%sys[ ].%' and qsqt.query_sql_text not like '%@[sys@].%' escape '@' and qsqt.query_sql_text not like '%INFORMATION_SCHEMA%' and qsqt.query_sql_text not like '%msdb%' and qsqt.query_sql_text not like '%master%' and qsp.last_execution_time=(select max(last_execution_time) from sys.query_store_plan qsp2 where qsp2.query_id= qsp.query_id) group by qsq.query_id ) GO |
Now It’s time to do a step-by-step walk-through that demonstrates how our query can identify parameterization problems.
Read also: Blocked process troubleshooting
Identifying Parameterization Problems Via Query Store
- First, let’s create a stored procedure. Parameterization problems can happen with ad-hoc queries and stored procedures, let’s do an example with both.
123456use AdventureWorks2016gocreate procedure QueryPrice @p moneyasselect * from bigproduct where listprice=@pgo
- Let’s turn query store on for ‘AdventureWorks2016’ database
12ALTER DATABASE [AdventureWorks2016] SET QUERY_STORE = ONGO
- We need to execute two queries with parameterization problems several times
1234select * from bigproduct where listprice=245.01go 50select * from bigproduct where listprice=0.00go 50
- It’s also interesting for the example to execute two more queries that have no parameterization problems.
1234SELECT * FROM Sales.CreditCard WHERE CreditCardID = 11go 50SELECT * FROM Sales.CreditCard WHERE CreditCardID = 12go 50
- For a complete example, let’s end off by also executing a stored procedure that has parameterization problems
1234exec QueryPrice 245.01go 50exec QueryPrice 0go 50
- Finally, let’s use our query against query store
123select * from dbo.QueriesWithParameterizationProblems()where query_sql_text not like '%plancache%'order by stdev_cpu_time desc
The image below shows the query result:

There are some points you may have noticed:
- The query against the Sales.CreditCard table hasn’t parameterization problems, we can deduce this by the low standard deviation values.
- The query using a letter as parameter was executed inside a stored procedure.
- The queries using numbers as parameters were executed as ad-hoc queries and parameterized by SQL Server.
- The standard deviation of the CPU time of the first two queries is too high, showing that they are suffering from parameterization problems.
- We can add one more predicate to the query to filter results with low standard deviation.
123select * from dbo.QueriesWithParameterizationProblems()where stdev_cpu_time > 20000 and query_sql_text not like '%plancache%'order by stdev_cpu_time desc

There is a way to be sure these queries are suffering from parameterization problems. If we check the data distribution in the table we will notice the values aren’t well distributed. This query below does this for the ‘bigproduct’ table:
|
1 2 |
Select listprice,count(*) total from bigproduct group by listprice |
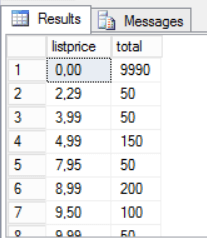
The image above illustrates a totally uneven distribution of data in the field ‘listprice’. Some values appear in a huge amount of records while others appear in only a few. This is completely natural and our queries need to deal with it.
We can’t solve parameterization problems using query store. Although query store allows us to force a specific query plan, this will not solve this kind of problem. The solution we need is the possibility to use different query plans according to the value of the parameter. We can solve this using “Option (Recompile)” in the queries, so that each execution will generate a new query plan. However, query store isn’t able to add one option to an existing plan. How can we achieve this without changing the source code of the system? The solution is the use of plan guides.
The procedure used to create plan guides, ‘sp_create_plan_guide’, needs the query text and the set of parameters as two different varchar input parameters. We can use some string functions to build these parameters. Check the following query:
|
1 2 3 4 5 6 7 8 9 10 |
select left(params,len(params)-1) params, right(query_sql_text,len(query_sql_text)-len(params) -1) query, 'SQLPLAN' + cast(ROW_NUMBER() over (order by params) as varchar) as [name] from ( select substring(query_sql_text,2, (patindex('%select%',query_sql_text) -2)) params, query_sql_text from dbo.QueriesWithParameterizationProblems() where query_id in (1047,932) ) t |

The above query works for this demonstration, but there is no guarantee that it will work for you so you’d need to check, because small changes in the query text would generate a wrong result.
After we have decided which queries deserve a plan guide and identified the correctness of the parameters and the query text, we can execute the script below to create the plan guides:
|
1 2 3 4 5 6 7 8 9 10 11 12 13 14 15 16 17 18 19 20 21 22 23 24 25 26 27 28 29 30 |
declare @params varchar(max) declare @query varchar(max) declare @name varchar(50) declare cr cursor for select left(params,len(params)-1) params, right(query_sql_text,len(query_sql_text)-len(params) -1) query, 'SQLPLAN' + cast(ROW_NUMBER() over (order by params) as varchar) as [name] from ( select substring(query_sql_text,2, (patindex('%select%',query_sql_text) -2)) params, query_sql_text from dbo.QueriesWithParameterizationProblems() where query_id in (1047,932) ) t Open cr fetch next from cr into @params, @query, @type,@name while @@FETCH_STATUS=0 begin EXEC sp_create_plan_guide @name, @query, 'SQL', NULL, @params, N'OPTION (recompile)' fetch next from cr into @params, @query, @type,@name end close cr deallocate cr |
You can check in the ‘Object Explorer’ window, inside SSMS, the plan guides created. They will appear under ‘AdventureWorks2016’ database, ‘Programmability’ -> ‘Plan Guides’
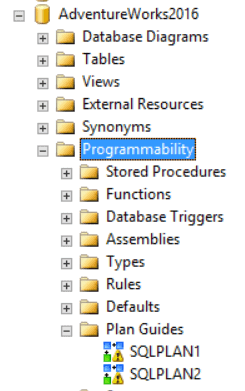
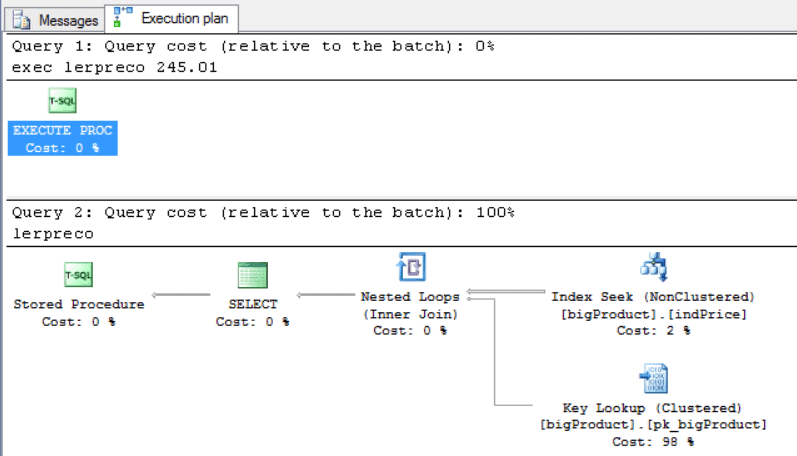
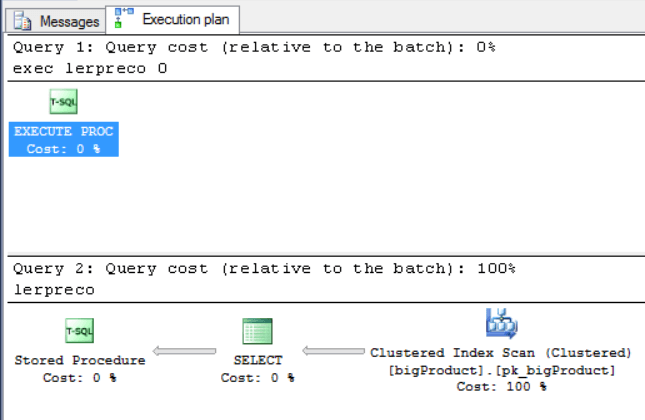
Finally, to be sure that we have achieved the desired result, we need to check the query plans of the queries with problems. We want the result to be a different plan for each value used in the query.
Select each of the following queries, one by one, and click the button ‘Display estimated execution plan’ in SSMS.
|
1 2 3 |
exec QueryPrice 245.01 exec QueryPrice 0 |
|
1 2 3 |
select * from bigproduct where listprice=245.01 select * from bigproduct where listprice=0.00 |
As you may have noticed, each query generated a different query plan, the best query plan for each one, thereby solving the parameterization problem.
Conclusion
As well as all the wonderful features that Query Store brings to our performance troubleshooting tasks, we can now also use it to identify parameterization problems in our server before our users complain that the database is running slowly.
Until now, we were able to identify if a specific query suffers from this problem, but we had no solution to find all of those queries in our server that suffer from parameterization problems. This new solution can become a very useful routine maintenance task.
If this is your first contact with query store, you may also like the following articles, which explain the main features and benefits of Query Store:
- https://www.simple-talk.com/sql/database-administration/the-sql-server-2016-query-store-overview-and-architecture/
- https://www.simple-talk.com/sql/database-administration/the-sql-server-2016-query-store-built-in-reporting/
Fast, reliable and consistent SQL Server development…
FAQs: Query Store Parameterization Problems in SQL Server
1. What is parameter sniffing in SQL Server?
Parameter sniffing occurs when SQL Server creates an execution plan based on the first parameter values used in a query, then reuses that plan for all subsequent executions – even when different parameter values would benefit from a completely different plan. This becomes a problem with skewed data distributions where one set of values returns 10 rows and another returns 10 million.
2. How do you detect parameter sniffing with Query Store?
Enable Query Store on the database, then look for queries with multiple execution plans that have dramatically different performance metrics. In the Query Store UI, the “Regressed Queries” view highlights queries where newer plans perform worse. You can also query sys.query_store_plan and sys.query_store_runtime_stats directly to find plan variation with high variance in duration or logical reads.
3. How do you fix parameter sniffing in SQL Server?
Three main approaches: (1) Use Query Store to force the optimal plan – this is the easiest and doesn’t require code changes. (2) Add OPTION (OPTIMIZE FOR (@param = value)) to hint the optimizer toward a typical value. (3) Add OPTION (RECOMPILE) to force a fresh plan on every execution – trades CPU for plan quality. For stored procedures, WITH RECOMPILE on the procedure definition is the nuclear option.



Load comments