

In my experiences building end-to-end analytics solutions, I often need to connect to a variety of different systems to bring data in. Most of the time, this process is straightforward. However, there are cases where I’ve had to jump through a few hoops—such as using staged databases, secured connections, or other mechanisms—enforced by the organization depending on their policies.
Enterprise Resource Planning (ERP) systems are some of the most common sources I connect to for analytics. They’re at the heart of most business operations, spanning multiple functions, which makes them a critical source of data for any analytics effort. Several of my recent projects involved connecting to Infor’s ERP systems—specifically M3, and more recently, their CloudSuite platform. Connecting to their on-premises applications (such as M3, LN, etc.) to extract data is usually straightforward if access to the database can be obtained, whereas connecting to CloudSuite to extract data is a little bit more challenging, even with the connectivity options provided by Infor; a sentiment shared by many customers themselves, which has led to a notion that Infor data is pretty closed off.
Infor’s Data Fabric, with its data lake and the anticipated lakehouse (at the time of writing), and Birst seems promising on paper, but it still falls short of delivering the right tools for building a true end-to-end analytics solution. On top of that, consistent issues with connecting to their own ERP for analysis, combined with a lack of clear guidance on how to get it all working, only add to the challenges.
This article aims to help make things clearer and easier to work with when dealing with Infor’s CloudSuite when you need to pull data out for your data & AI initiatives.
Infor concepts
Before diving in, let’s familiarize ourselves with Infor’s offerings that are relevant to this article.
- Infor CloudSuite is a collection of business applications offered as a SaaS solution—including products like M3, LN, and others. It’s similar to how Microsoft offers Dynamics 365 as a unified cloud-based offering for its business apps.
- Infor OS (Operating Services) is the core platform that provides a unified pane of glass that includes CloudSuite, integration, automation, security, governance, and a data fabric as a digital transformation platform.
- Infor Data Fabric is the unified approach to data management —bringing together data lake storage with the tools to process, explore and serve data for reporting and analytics.
The problem
As an organization, you capture and store data to support day-to-day operations, gain visibility into what’s happening across the business, and make more informed decisions. But to really unlock its value, you often need to extract that data, process it effectively, and use it beyond what the application offers, especially when it comes to analytics and strategic decision-making.
I’ve worked with many customers who lean heavily on data from their ERP systems, Infor or otherwise, for their daily operational insights and strategic decision making. While that is a natural starting point, the full value often emerges when data from across the business is brought together and mixed and matched effectively with ERP data. No business runs on just one system. Organizations have sales targets floating in Excel, customer data living in Dynamics 365, eCommerce humming away in Shopify, maybe even an old Oracle-based ERP still hanging on in the background. Bringing all that data together creates a more complete, connected view of the business, something no single system can provide on its own.
If I were building a solid, scalable, and user-friendly analytics solution for a customer, I’d need the right mix of tools and tech to make it happen. What stands out about Infor Data Fabric is that it’s really geared toward enabling access to data from Infor’s own ecosystem, not so much for bringing data together from external systems. That feels a little at odds with their broader vision of a data fabric built around a data lake, with a lakehouse on the horizon (at the time of writing).
I’ve also been seeing more and more customers leaning toward Power BI for their reporting and analytics needs, largely because Birst, where the data ultimately needs to go to, doesn’t quite deliver what they’re looking for. But even then, the challenge of getting data out of Infor remains. The reality is, when you’re pulling in data from all kinds of systems—on-prem, cloud, SaaS apps, databases, files, structured or not—you need the right tools to extract, process, store, explore, and present that data. And if I don’t have the flexibility to do all of that, in ways that fit my needs, I’m going to look at a stack that does—like Azure, AWS, or GCP.
If unlocking the full value of your data is the goal, then choosing an open, flexible platform that plays well with all your systems isn’t just a nice-to-have, it’s a strategic must.
The solution
Over the years, Infor has rolled out a few different ways to extract data from its ERP systems, but in practice, they’ve often fallen short when it comes to reliability and performance. Take the Compass API, for instance. While it works for small requests such as when you build a user interface extension and use it to interact with M3, it doesn’t hold up well when you use it to extract large datasets from the ERP.
Then there’s the Pentaho-based “ETL tool”, which has to be first deployment across two virtual machines that pushes data extracted from the M3 to a SQL Server instance on of the VMs, a setup that has regularly encounters data mismatches against the source while often having a high latency. Even the data lake on Infor’s Data Fabric, which is seen as a more modern option, has its challenges with regular latency problems and occasional inconsistencies that make it less dependable – so, more problems than a sound solution.
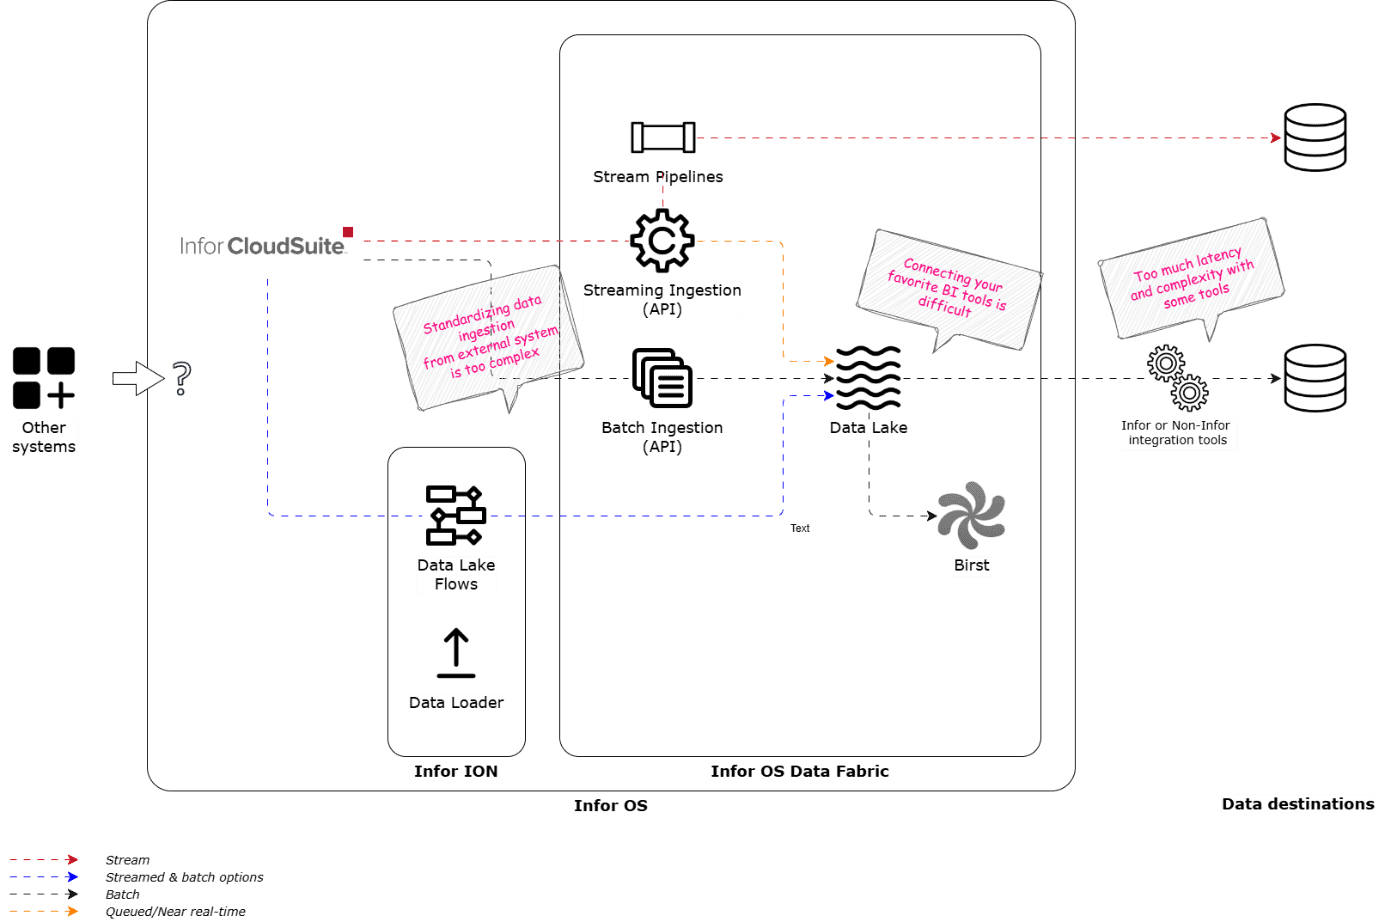
Figure 1: Infor Data Fabric – data storage and processing options
As data professionals, we treat all data with the same level of importance. Each system we connect to is simply another source for the data repository we’re building, whether it’s an expensive ERP or a collection of files in a folder. After all, “The true value of a system lies not in its cost, but in the richness of the data it contains.”
Ultimately, this means we have to treat CloudSuite like any other data source and simply ask, “give us the darn data.” And it looks like Infor has finally cracked the code with Stream Pipelines.
Stream Pipelines provide a way to replicate tables from within CloudSuite to outside of the Infor OS in real time. When data events happen in CloudSuite, they’re immediately captured by a component called Streaming Ingestion to ingest into Data Fabric. Stream Pipelines kicks in at this point, processing each event in real time and pushing it directly to a database destination, bypassing landing the data lake. We can now connect to the database destination for reporting, analytics, and real-time data needs.
Stream Pipelines is an add-on license to Data Fabric. It is an easy configuration once you’ve obtained it leaving you to only configure a data destination using one of the supported systems that include PostgreSQL on Azure, AWS Aurora, Snowflake, and, more recently, Azure SQL Database. This is CloudSuite data replicated in real time outside of Infor’s infrastructure —as just another source.
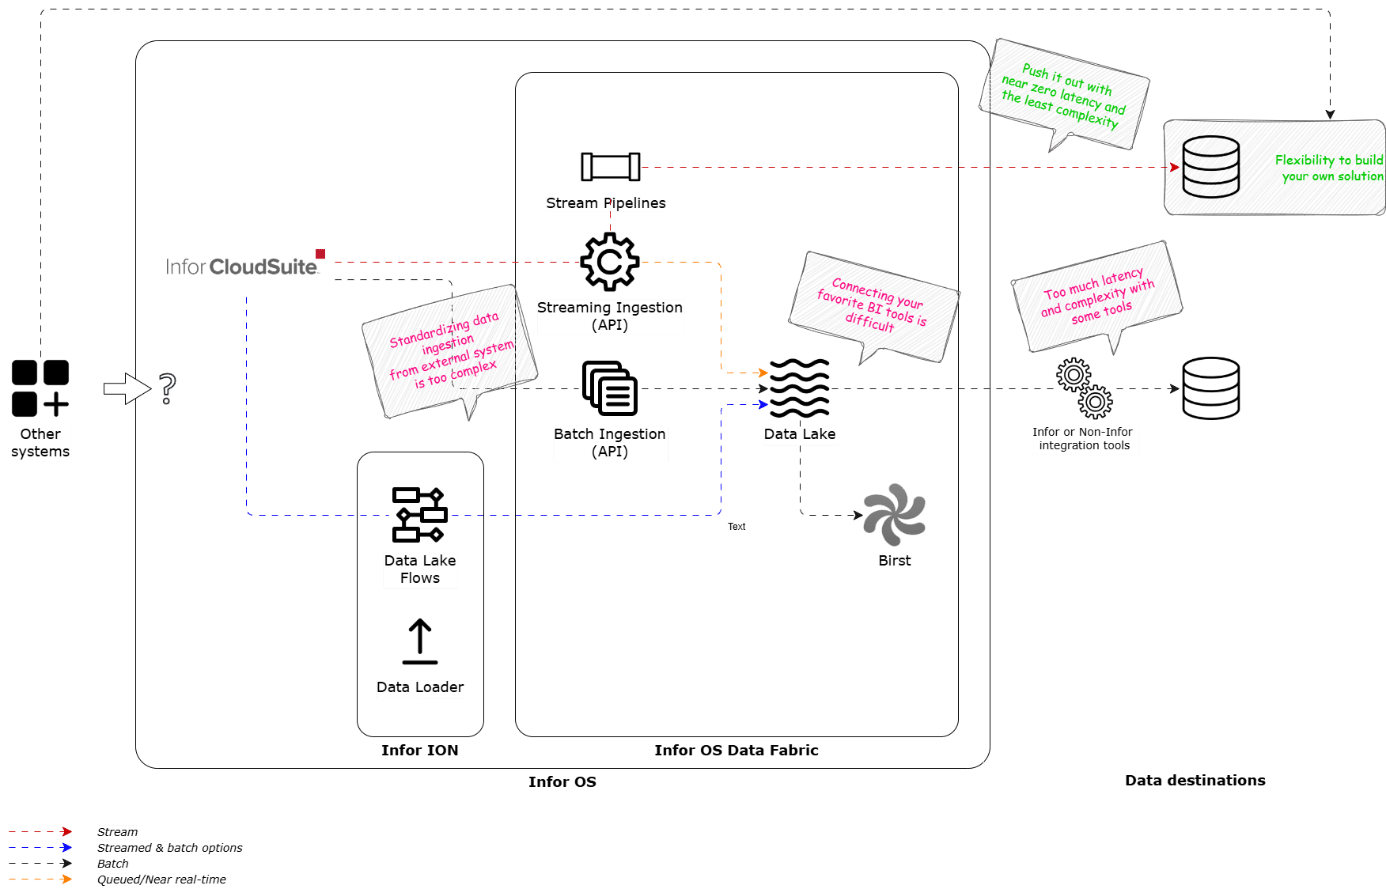
Figure 2: Infor Data Fabric – recommended method to surface CloudSuite data
References
Real-time ingestion also pushes data to the data lake in a queued manner — ready for you to keep building with Infor’s tools, like Birst. However, that’s not what we are looking for.
Once the Stream Pipelines are set up to synchronize to a data destination, I have now the choice to tap into fully functional data and analytics tools at my disposal to build comprehensive analytics solutions, with the flexibility that I need, like the extensive suite of Azure data services and my new favorite, Microsoft Fabric.
But first, let’s look at setting up Stream Pipelines.
Setting up Stream Pipelines
You set up Stream Pipelines in two parts; first you prepare the data destination, and then you model the pipelines. You can then start the pipelines and monitor them.
Preparing the data destination
The first step is to build your destination; the database in which CloudSuite data is going to magically spawn. I chose an Azure SQL Database.
You then sign into Infor OS, access Data Fabric and navigate to the Pipelines section. You start by creating a destination from under Destination, which must connect to the Azure SQL Database you’ve spun up.
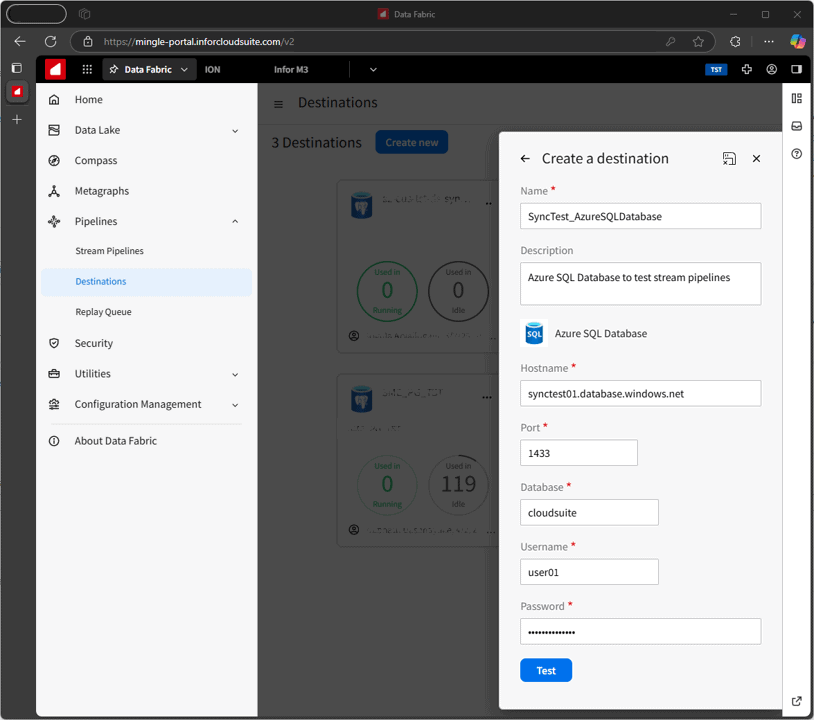
Figure 3: Creating the data destination
Modeling the pipeline
From under Stream Pipelines, you start by creating a new pipeline and setting up a simple source-to-destination mapping.
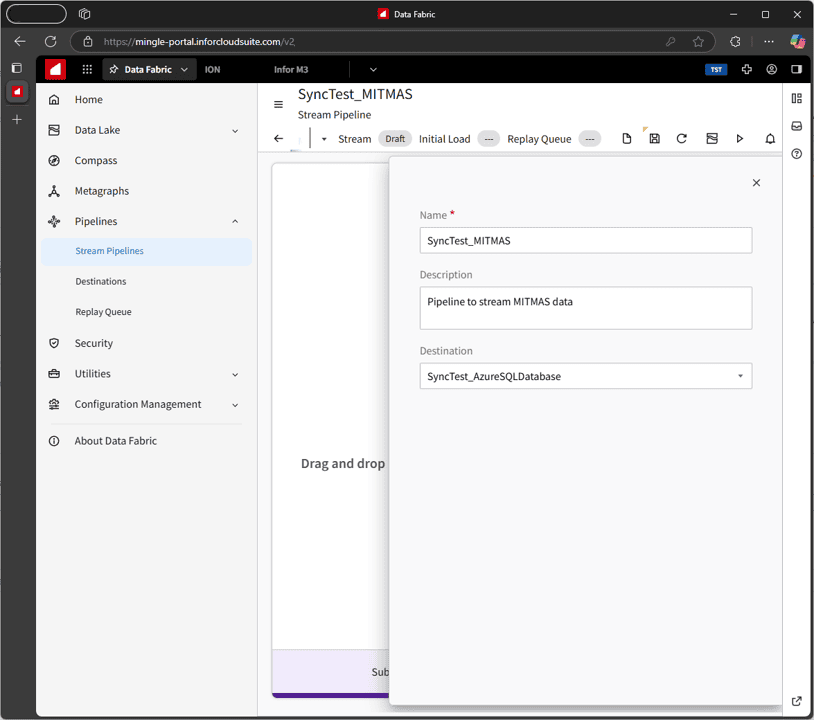
Figure 4: Creating a pipeline for the CloudSuite MITMAS table
The source is called a Subscription—basically, you’re subscribing to a data object (table) that pushes out events. The destination is called a Delivery, where you set up a table on your Azure SQL Database to receive those events.
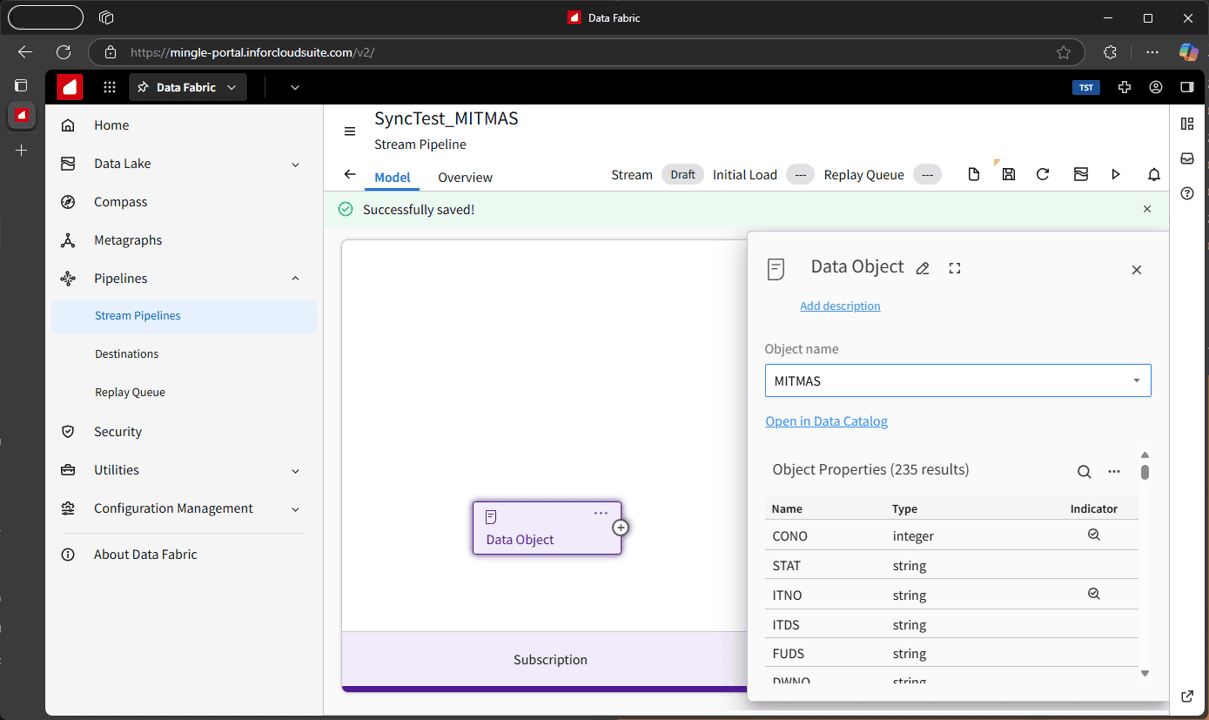
Figure 5: Creating the subscription for the CloudSuite MITMAS table
At this point, things can get a bit tricky, though. You’ll need to have the destination table already created in your SQL database. The catch? CloudSuite gives you a JSON definition of the entity, not a ready-to-go SQL script.
So, you’ll need to figure out the SQL yourself. You could use the Infor ION APIs to build a small app that generates the script, or, as a colleague of mine tried out, get an AI copilot to turn the JSON into SQL. It takes a bit of effort, but you’ll end up with a working table definition.
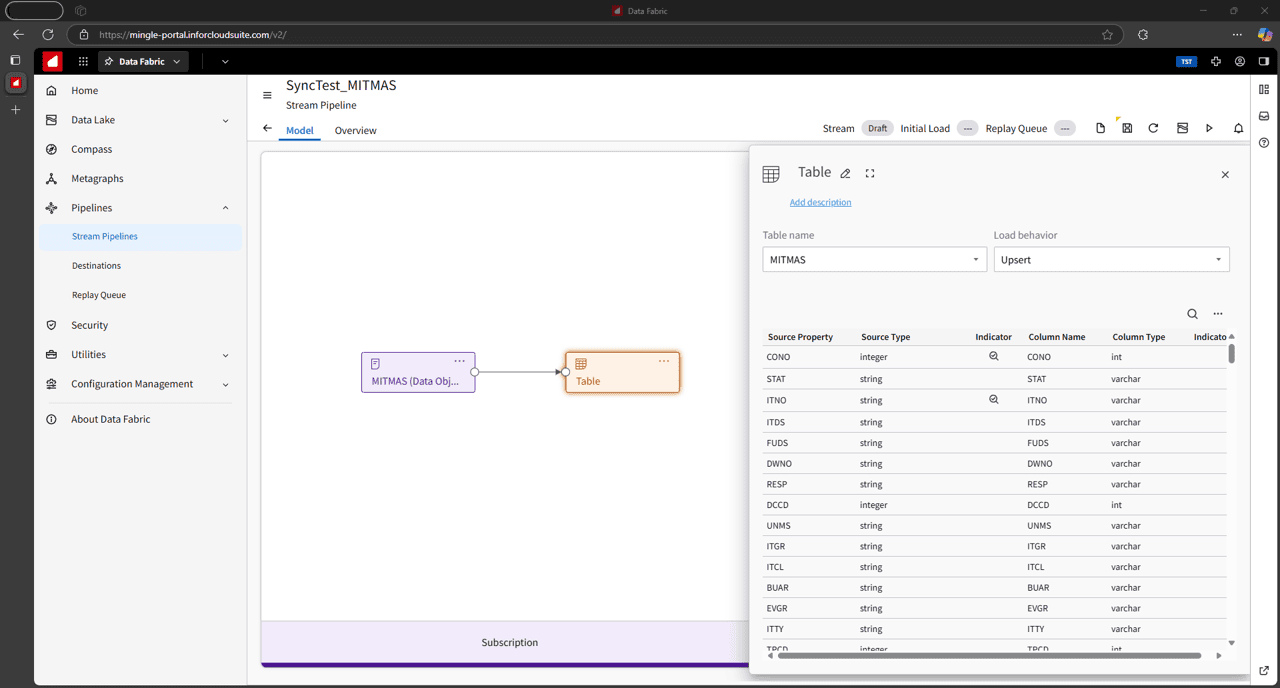
Figure 6: Creating the delivery to capture the CloudSuite MITMAS table
Once you pick the table on the delivery side, the columns will auto-map, as long as the names match exactly. You’ll still want to double-check that every property in the data object is properly mapped to a column in your table. You won’t see any errors if there are mismatches during the mapping exercise or after, until you start the pipeline and find out that captured events are being logged in the replay queue instead of getting delivered to the database.
Mapping also includes choosing if you want to insert the events or upsert them. Inserting will land multiple versions of a record each time it gets updated, giving you a history of changes, while upserting will give you a 1:1 of the source.
Running the pipeline
You run the pipeline by kicking off an initial load. You can choose between all the data on your data object, or data within a specified period as your initial data load. Kicking off includes starting the pipeline and running the initial load. Once the initial load has completed, the pipeline will continue to run picking up new events and sending them to the delivery destination.
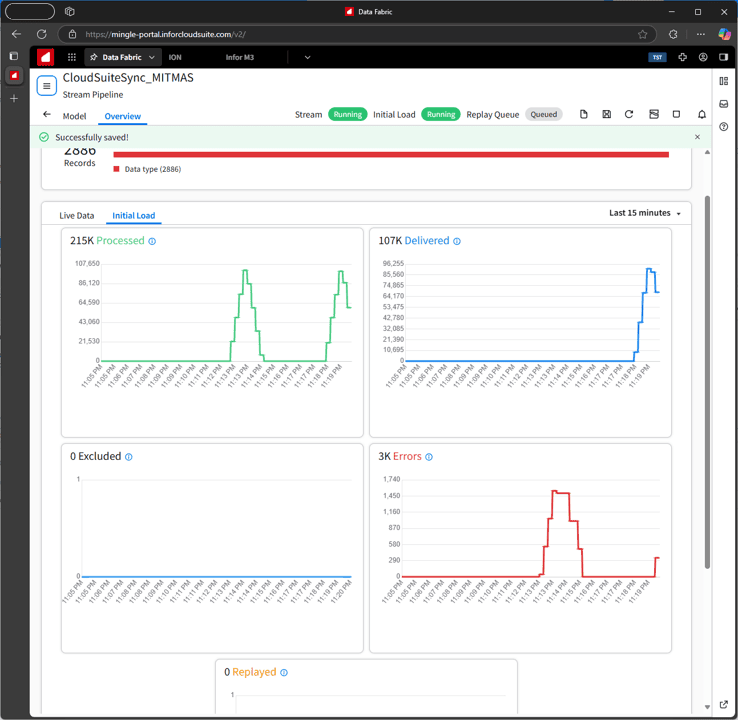
Figure 7: Execution of the Stream Pipeline
Pipeline exceptions
When your stream pipelines run, there are chances of exceptions occurring. There are several reasons why they may occur. For instance, events over 4.5MB are not supported; so, if an event larger than this occurs it will be caught as an exception. If the database destination is offline, that event will be caught as a connectivity exception. If the JSON of the event is malformed it will cause an exception marking the event as ‘discard only’. Similarly, many different types of exceptions can occur.
All exceptions are sent to the replay queue. After examining the exceptions, you can take necessary corrective actions, and execute the replay queue, which will re-attempt the events. However, some events will never go through, such as exceptions marked as ‘discard only’ including the events that are larger than 4.5MB. Others such as those with connectivity issues will go through if connectivity is re-established.
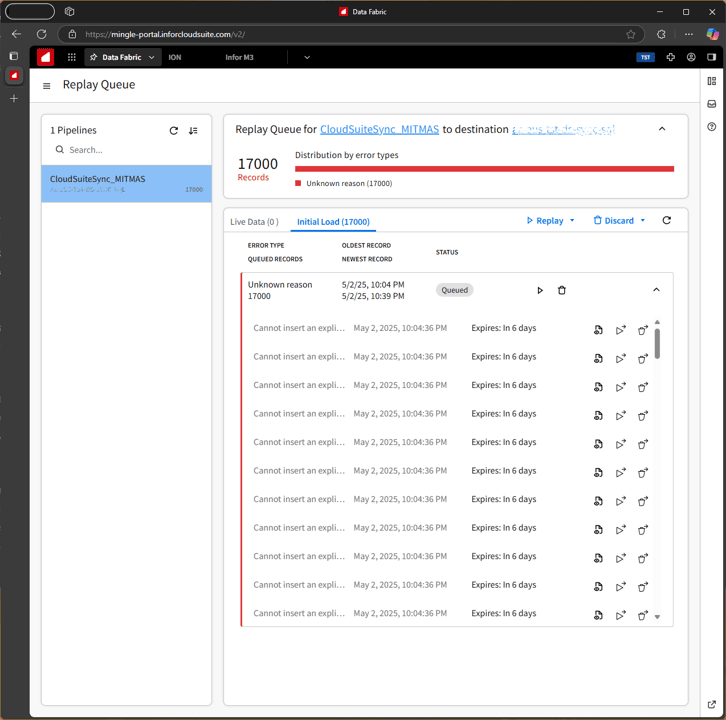
Figure 8: Replay queue of the Stream Pipeline
References
This link provides a list of all exception types:
Monitoring
Once you’re set up with Stream Pipelines, you’ll likely need to monitor things more closely for the first few days (Figure 7). After that, occasional check-ins are usually enough. That said, monitoring tools are pretty limited; there’s not much built in, and even notifications are restricted to a panel within each pipeline (Figure 8).
References
You can also monitor the number of events used up, and the cloud egress of events pushed out of Infor OS through the Infor Concierge.
Pricing
Stream Pipelines are an add-on SKU that needs to be purchased separately to Data Fabric. Pricing tiers are based on 165,000 events per day. Pricing is not published on Infor’s documentation, meaning you need to contact Infor for this.
You also need to be mindful of cloud egress, another piece that will cost you for the amount of data being pushed outside of the Infor OS.
References
Application areas
Now that you’ve got your data synced out from CloudSuite, let’s look at what you can do with it across the business. It’s a whole new world!
Remember, your CloudSuite destination is now your source.
Data landing
A good place to start is by landing the raw data in a centralized store—ideally a data lake. Platforms like Microsoft Fabric make this even smoother by letting you push the data straight into a data lakehouse, where it shows up as tables instead of just files. On platforms like Databricks, you push the data first into a data lake storage as files and then structure them into tables. No matter which method you use, once your CloudSuite data is in one place, especially alongside other business data, you can start bringing things together for a whole range of use cases. And by applying standardization and curation, you can take it a step further, making the data more refined, consistent, and ready for those use cases to deliver real value.
You can use standard extract, load, and transform (ELT) approaches to land and shape the data—typically through data pipelines and Python notebooks in Microsoft Fabric or Databricks, if we stick with that example.
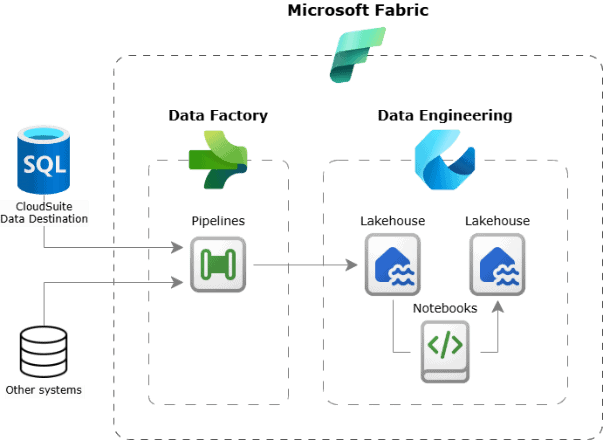
Figure 9: Example of data landing of CloudSuite data on Microsoft Fabric
You can even mirror the source, so the data shows up inside Fabric in near real-time within a mirrored database. This is a great option if this is your sole data source, or if you don’t have an elaborate strategy or path for analytics in your organization just yet.
Analytics & Business intelligence
The next logical step is to bring one of those use cases to life—and what better place to start than with analytics?
When you landed the data, you weren’t just storing it; you were already starting to curate it. A common approach here is the medallion architecture, where data flows through multiple layers of curation and transformation. Some of that work happens right at the landing stage, but the final stretch is all about shaping the data for analytics. This is where you aggregate, structure, and organize it in a way that supports meaningful reporting and strategic decision making.
You can take it a step further by layering in business logic, adding calculations and models that make the data more intuitive and ready for business users to explore through BI tools, such as dashboards and analytical reports.
To build this out in Microsoft Fabric, you can use a data lakehouse for both storage and analytical processing or go with an equally effective option like a data warehouse. On top of that, you can layer a semantic model to handle your business logic, making the data more structured and intuitive for analysis and reporting. And once your semantic model is in place, it’s ready to power your reporting layer, whether it’s in Power BI, Excel or any other tool your teams use.
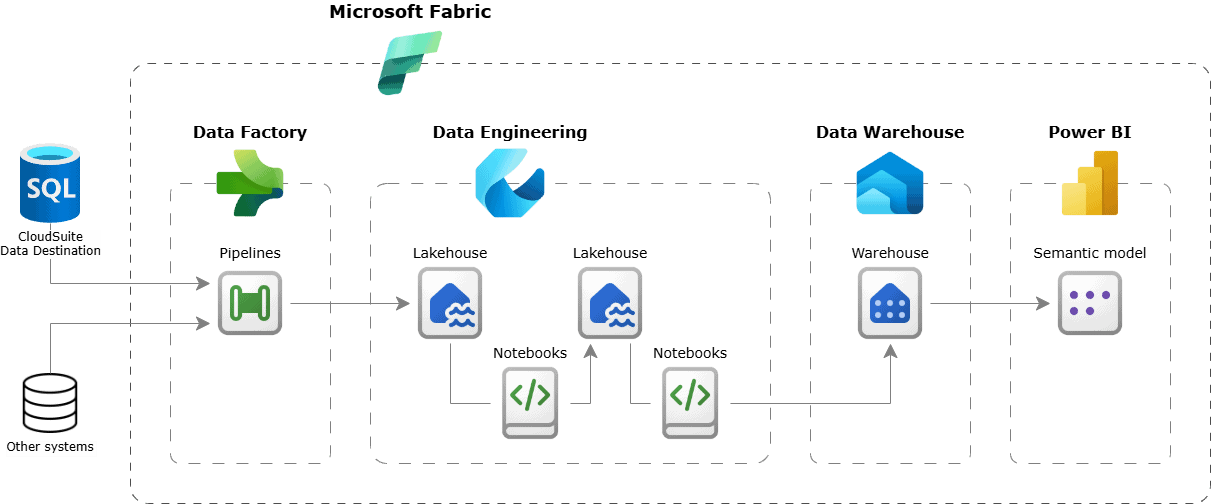
Figure 10: Example of analytics and business intelligence off CloudSuite data on Microsoft Fabric
Transactional reports
Transactional reports, sometimes referred to as operational reports, focus on individual business events and typically cover a fixed, recent period rather than historical trends. They’re often straightforward to build. In Microsoft Fabric, you can use paginated reports to create pixel-perfect layouts, which are especially useful when print-ready formats are needed. You can build these reports directly off the source database or keep everything within Fabric by using the mirrored database. And depending on your workload and organizational requirements, you can easily scale the setup or configure high availability to ensure smooth operations without disruptions.
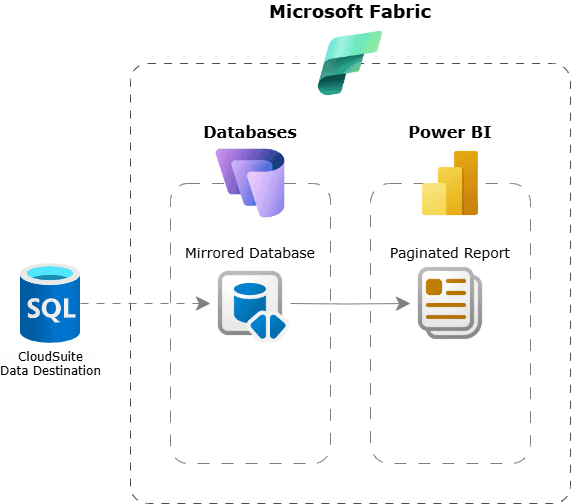
Figure 11: Example of transactional reports off CloudSuite data on Microsoft Fabric
Real-time intelligence
While operational reports give you detailed, structured views of live data, real-time dashboards take it a step further, offering dynamic insights that update continuously as new data flows in. Unlike traditional business intelligence dashboards, which typically work off large historical datasets, these dashboards are all about the “now.”
To make this work, the source database must be configured with change data capture (CDC) so that updates are pushed out as they happen. These changes can then be picked up by Eventstreams in Microsoft Fabric, routed to an Eventhouse (a streaming equivalent to a lakehouse), and finally surfaced through to a real-time dashboard.
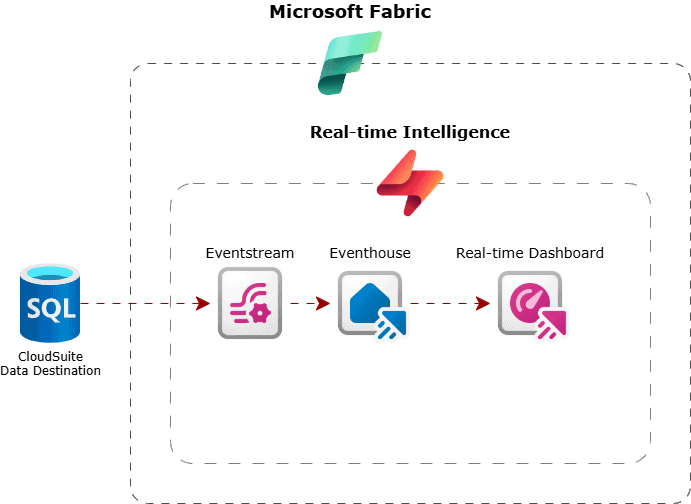
Figure 12: Example of real-time intelligence off CloudSuite data using Microsoft Fabric
Advanced analytics
While the aggregated data in the analytics layer we talked about earlier supports descriptive and, to some extent, diagnostic analytics, you can take things further by tapping into the data stored in your lakehouse to uncover predictive and prescriptive insights. You can then use these insights to enrich your aggregated datasets and business calculations, making your strategic decision-making even sharper.
Using Spark notebooks in Microsoft Fabric, you can build and run machine learning models directly on your lakehouse data to generate those predictive outcomes
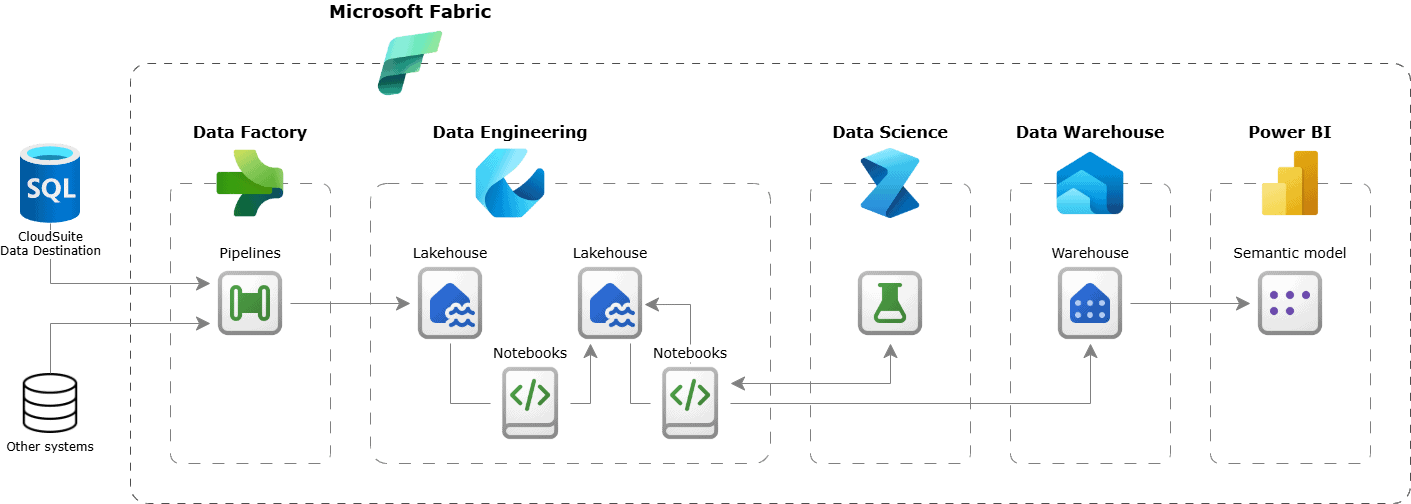
Figure 13: Example of including advanced analytics into a Microsoft Fabric solution using CloudSuite data
Artificial intelligence
And how can we forget AI? It fits right into everything we’ve talked about so far. Whether it’s helping out with data engineering tasks, generating dashboards, or even guiding your analysis; it’s everywhere. In Microsoft Fabric, you’ll find a copilot baked into almost every area: Power BI, data warehouses, Data Factory, real-time intelligence, data engineering, and data science. And this is just the beginning; and you can only imagine it’s going to get better from here.
Closing remarks
From landing your data to transforming it for analytics, operational reporting, and real-time dashboards, we’ve looked at the different ways you can start putting your CloudSuite data (and data from other systems) to real use. By centralizing and curating your data, layering on business models, and even adding predictive capabilities, you’re laying the groundwork for insight-driven decisions across the board.
But remember, it all starts with getting that data out of CloudSuite, and for that, Stream Pipelines is your best option right now, with even Infor recommending it. While Infor’s Data Fabric might seem like a logical pick, especially paired with Birst, I’ve seen more and more customers turning to external tools like Power BI and the Microsoft analytics stack. As we saw throughout this article, it’s a capable setup, with a wide range of options, only really limited by how far you want to take it.
Load comments