Everyone runs into performance issues at some point. Same thing goes for Red Gate software. Some of our internal systems were running into some serious bottlenecks. It just so happens that we have this nice little SQL Server monitoring tool. What if I were to, oh, I don’t know, use the monitoring tool to identify the bottlenecks, figure out the causes and then apply a fix (where possible) and then start the whole thing all over again? Just a crazy thought.
OK, I was asked to. This is my first time looking through these servers, so here’s how I’d go about using SQL Monitor to get a quick health check, sort of like checking the vitals on a patient.
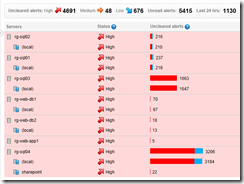
First time opening up our internal SQL Monitor instance and I was greeted with this:
Oh my. Maybe I need to get our internal guys to read my blog.
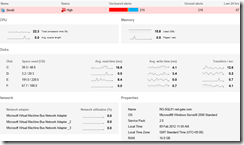
Anyway, I know that there are two servers where most of the load is. I’ll drill down on the first. I’m selecting the server, not the instance, by clicking on the server name. That opens up the Global Overview page for the server. The information here much more applicable to the “oh my gosh, I have a problem now” type of monitoring.
But, looking at this, I am seeing something immediately. There are four(4) drives on the system. The C: has an average read time of 16.9ms, more than double the others. Is that a problem? Not sure, but it’s something I’ll look at. It’s write time is higher too.
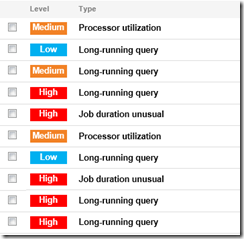
I’ll keep drilling down, first, to the unclosed alerts on the server. Now things get interesting. SQL Monitor has a number of different types of alerts, some related to error states, others to service status, and then some related to performance. Guess what I’m seeing a bunch of right here:
Long running queries and long job durations. If you check the dates, they’re all recent, within the last 24 hours. If they had just been old, uncleared alerts, I wouldn’t be that concerned. But with all these, all performance related, and all in the last 24 hours, yeah, I’m concerned.
At this point, I could just start responding to the Alerts. If I click on one of the the Long-running query alerts, I’ll get all kinds of cool data that can help me determine why the query ran long. But, I’m not in a reactive mode here yet. I’m still gathering data, trying to understand how the server works. I have the information that we’re generating a lot of performance alerts, let’s sock that away for the moment.
Instead, I’m going to back up and look at the Global Overview for the SQL Instance. It shows all the databases on the server and their status. Then it shows a number of basic metrics about the SQL Server instance, again for that “what’s happening now” view or things. Then, down at the bottom, there is the Top 10 expensive queries list:
This is great stuff. And no, not because I can see the top queries for the last 5 minutes, but because I can adjust that out 3 days. Now I can see where some serious pain is occurring over the last few days. Databases have been blocked out to protect the guilty.
That’s it for the moment. I have enough knowledge of what’s going on in the system that I can start to try to figure out why the system is running slowly. But, I want to look a little more at some historical data, to understand better how this server is behaving. More next time.


Load comments