
Azure Monitor and Log Analytics are a very important part of Azure infrastructure. In my opinion, the adoption of these tools should start before a company starts its migration to azure. Using these tools over on premises servers can generate a performance baseline to be used when migrating the servers, ensuring the environment will be improving.
However, it needs to be a careful implementation, if you choose to take the easier way, you may cost some buckets to your company pocket.
The biggest example I noticed was the alert system. This system is an essential part not only of these tools but of the azure infrastructure as a hole, but you need to take care with the expenses. When you use the alert system you have some options to choose and, among them, Log or Metrics.
The log option means you need to build a Kusto query to retrieve an information from the Log Analytics storage, while the Metrics means you will define one metric you are interested on and Log Analytics will do the rest.
Let’s analyse an example. Imagine you would like to build an alert to notify you everytime a processor core is over 80% for more than 15 minutes. It seems an easy example to use a metric, right?
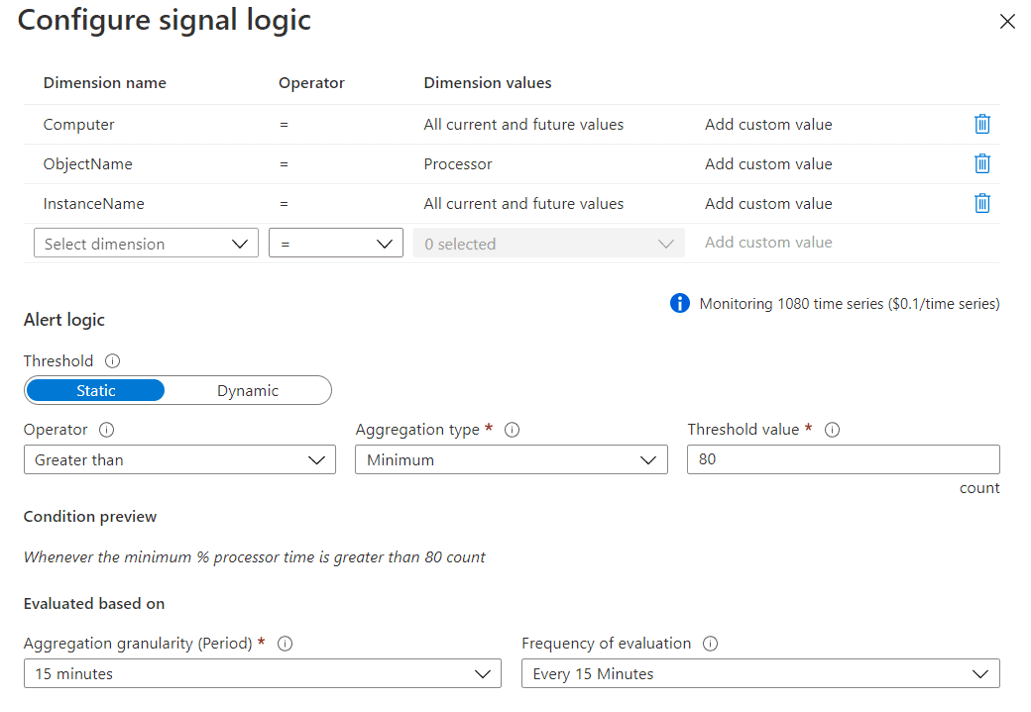
That’s what happens when you choose to use metrics:
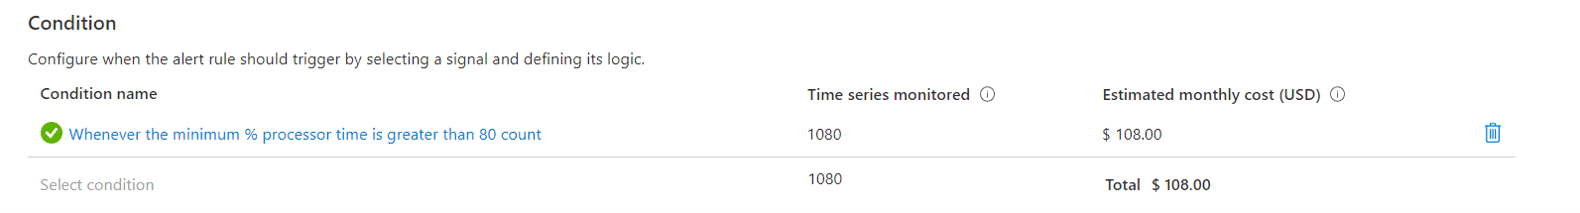
Since the check will be by core, the alert needs 3 dimensions: Computer, the metric (processor) and the instance (core). However, we also can’t overreact. Any core can easily be over 80% at any moment, that’s why we need to configure the 15 minutes of check. The processor will only be in trouble if over 80% during 15 minutes.
The configuration is like this:
Another Option for the Alerts
Log Analytics uses Kusto Query Language, or KQL, to query the information on its storage. Using it we can build a query capable of achive the same result as the monitoring metric. Learn a new query language to build this is not the easier task when starting a migration, but the difference may worth it.
The KQL query we need will be this one:
Perf
| where CounterName==”% Processor Time” and InstanceName != “_Total” and ObjectName==”Processor”
| where TimeGenerated>=ago(15m)
| summarize MinProcesor=min(CounterValue) by Computer,InstanceName
| where MinProcesor >=80
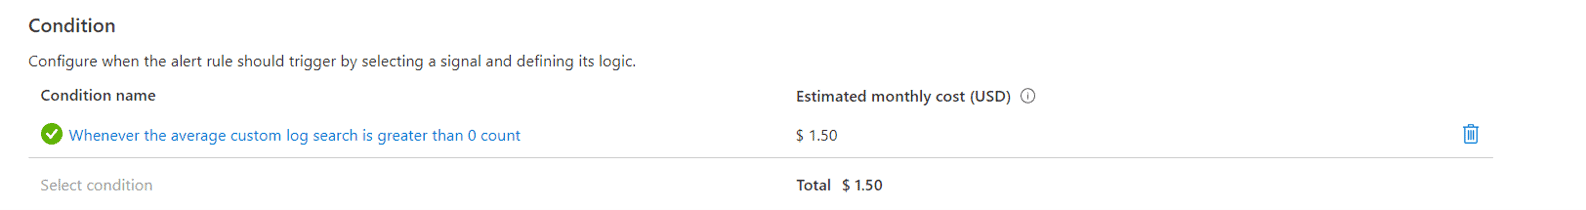
The price difference is amazing:
When we use metric alerts
Such a high price difference would turn metrics useless. Why would anyone use metrics for alerts if KQL is so cheaper?
- Alerts are not exclusive for Log Analytics. Almost every Azure object has the Alerts tab, allowing you to create alerts over them. In these situations, you will not have the option to use KQL.
- using KQL we have two levels of delay: the Log Analytics log collect schedule and the alert check schedule. There may be situations where this delay would not be acceptable
Configuration and Exception
On the objects where we don’t have the Log option to build conditions, we still can use KQL queries instead of metrics. We can configure the objects to send all their log to a log analytics on our azure environment. By doing that, we will be able to configure the alerts for all of them on the log analytics environment.
The objects’ configuration is not in the same place or exactly the same everywhere. Let’s analyse the existing variations.
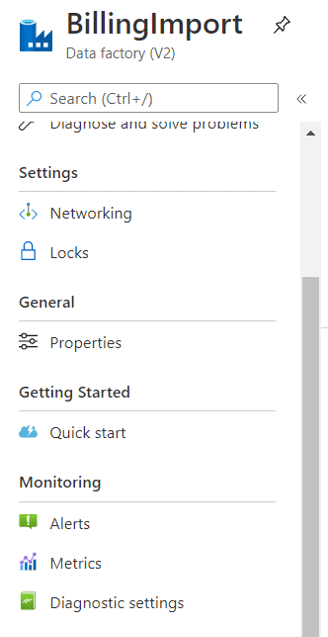
Data Factory and most of the objects
On most of the objects, the configuration is made using the Diagnostics option under Monitoring, like the image below:
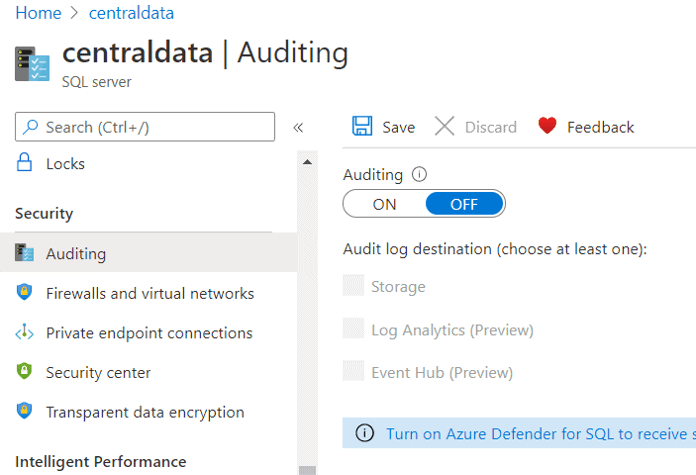
Azure SQL
On Azure SQL objects, the same configuration is made using the Auditing option under Monitoring, like the image below:
Resource Groups
On Resource Groups, using the Diagnostics option, we can manage the diagnostic settings for all the objects inside the resource group. It doesn’t mind if the objects’ configuration are made in different ways, such as Data Factory and Azure SQL objects, they can all be controlled from the resource group.
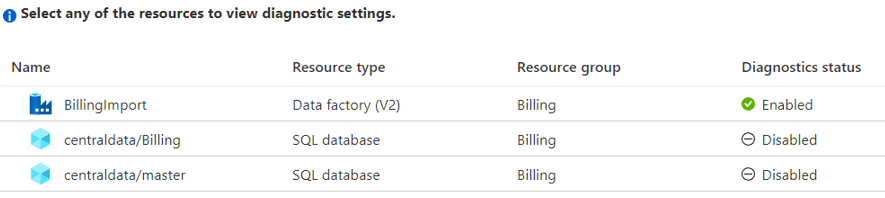
Clicking on the Enabled or Disabled icon you will see the configuration screen for the object you clicked, so the resource group becomes a central point to manage the diagnostic settings for all the objects in the resource group.
Storage Accounts
On storage accounts, there are two monitoring solutions. The monitoring solutions we are talking about is called “classic” on storage accounts, there is a new one for them.

The new monitoring configuration stores all the storage account’s log together the activity log of the object. This allows us the following benefits:
- Use KQL queries over the object
- Create KQL alerts over the object, without using Log Analytics
- Build Workspaces to visualize what’s happening with the storage account
Conclusion
Azure Monitor and Log Analytics are a so basic service that should be one of base services for a move to the cloud and can be used even before we start the move itself. Log Analytics can be used to monitor on premise servers and create one more reason to move to the cloud.
This is just a starting introduction to show some tricks and save some money, there is much more about this subject to be studied.
This document contains proprietary information and is protected by copyright law.
Copyright © 2026 Red Gate Software Limited. All rights reserved


Load comments