
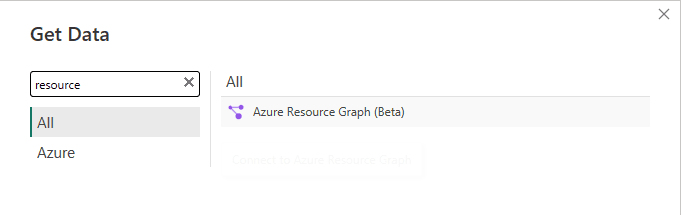
Recently Azure Resource Graph was announced as a new connector in Power BI.
Azure Resource Graph provides access to almost all resources inside the azure environment of a company.
Why is this important?
Resource Graph by itself is a very important tool to analyze the provisioned resources on Azure environment without lose the control of them. It’s very easy to start provisioning resources and end up lost in a complete mess.
Using the Power BI connector, Power BI becomes a great friend for Azure Solution Architects to make an inventory of everything deployed on the environment.
The connection uses a KQL query, one more reason for you to learn KQL.
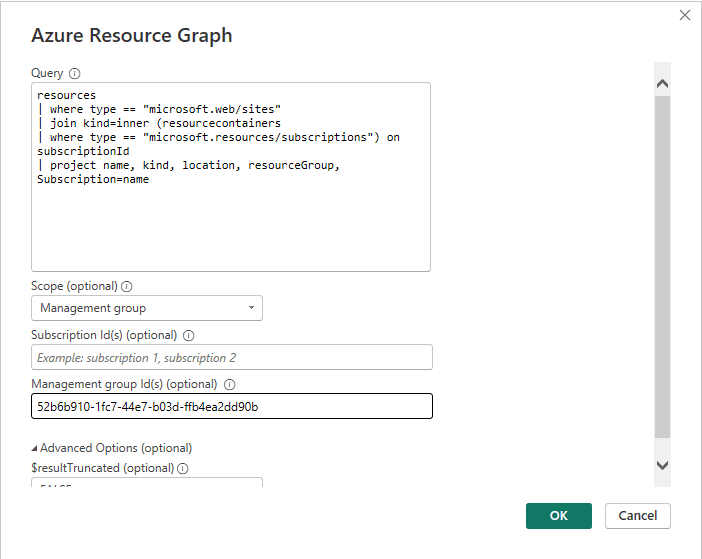
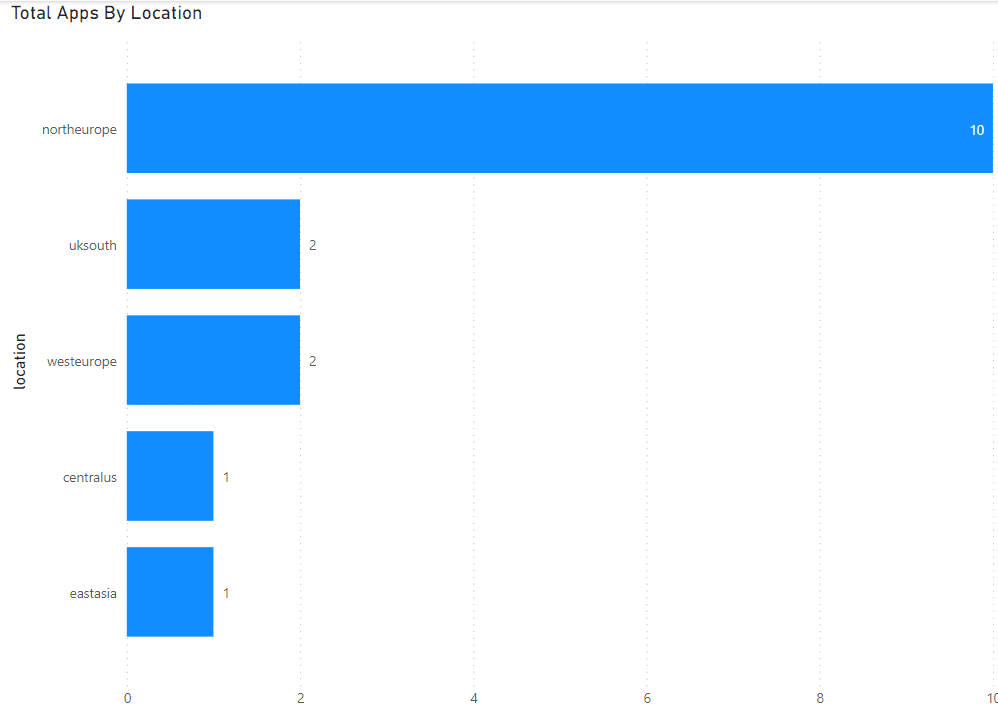
Using the query above, we can build a visual showing the distribution of App Services by region, for example:
Virtual Machines, Disks, App Services, and many more details, your imagination, Azure and KQL knowledge is your limit
Some time ago I wrote the blog List Azure Functions based on Configuration Values exemplifying how we could use Resource Graph with Powershell to get information from Azure.
It’s a great evolution to be able to use Power BI for the same purpose.


Load comments