

.In this blog I will illustrate how we can ingest data from a blob storage to a Microsoft Fabric Data Warehouse using T-SQL.
Create a new workspace
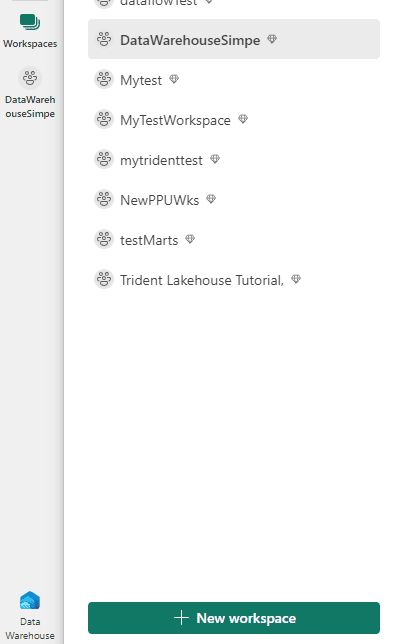
- On the left ribbon, click Workspaces.
- Click the New Workspace button.
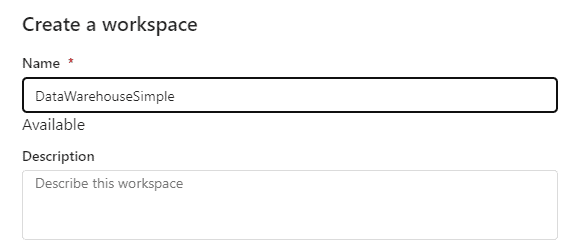
- Provide a name for the workspace.
- On advanced configuration, ensure you choose Premium by Capacity, and you need to select a capacity.
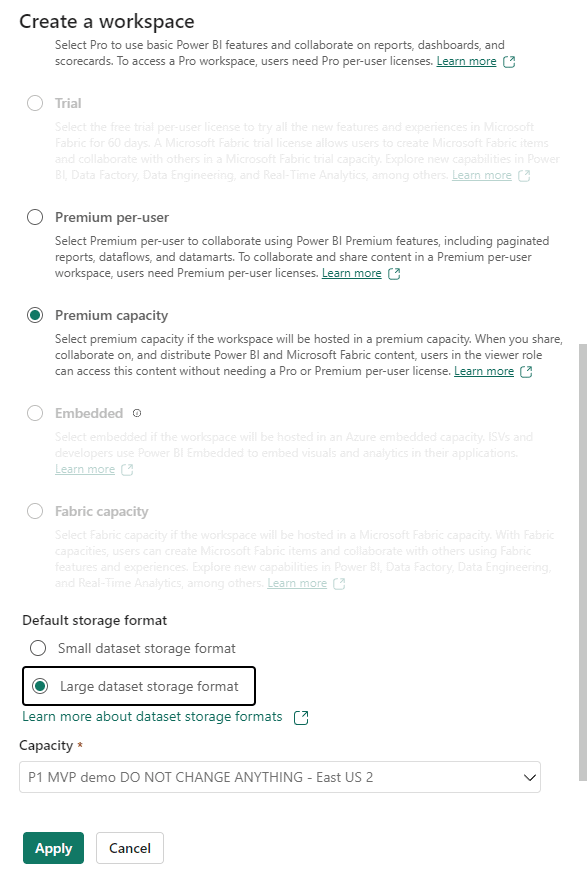
- Click the Apply button.
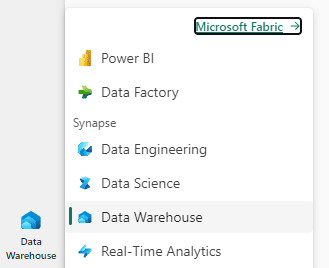
Creating the Microsoft Fabric Data Warehouse
- On the left ribbon, Experiences button, click the Data Warehouse experience.
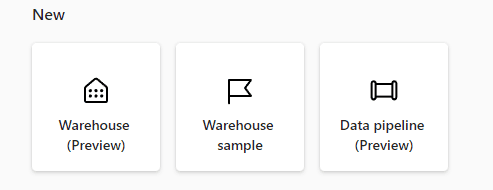
- Click the Warehouse button to create a new Warehouse
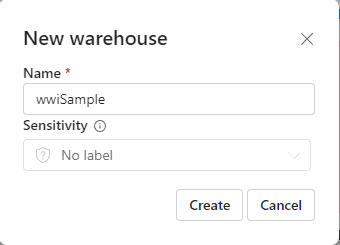
- Define the name wwiSample for the Data Warehouse and click Create.
Creating the schema to import the data
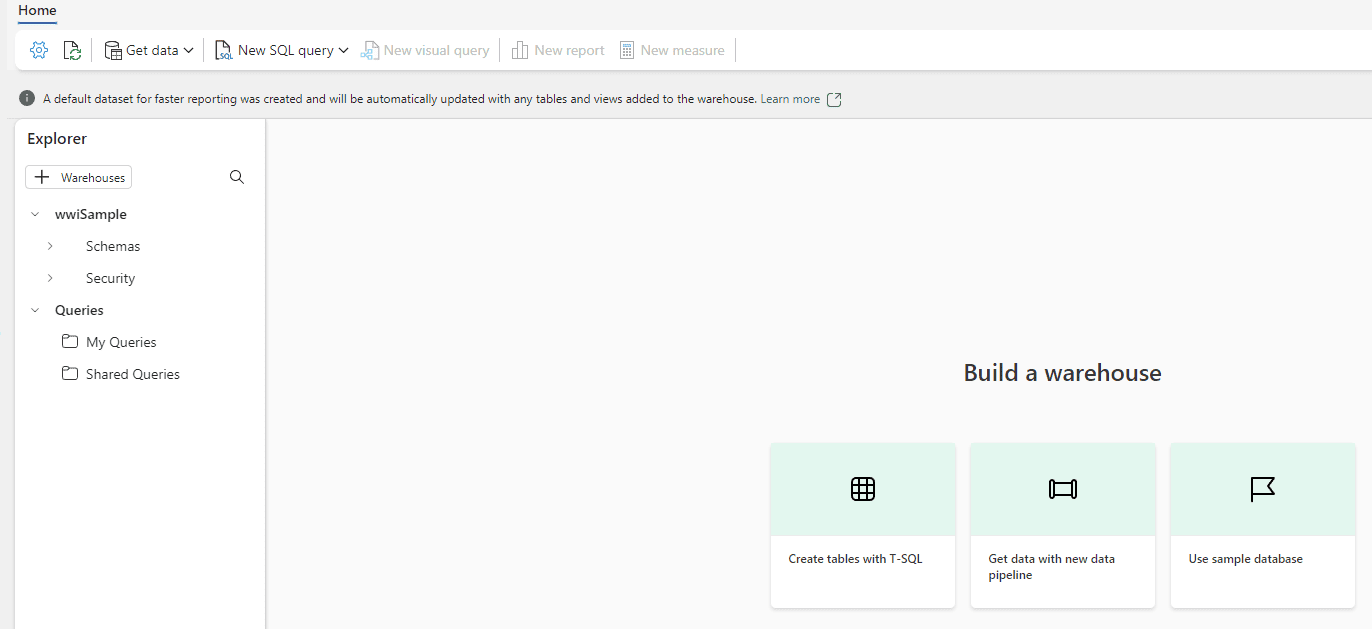
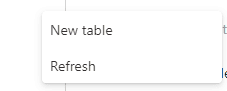
- Click the New SQL query button.
–dimension_city
DROP TABLEIF EXISTS [dbo].[dimension_city];
CREATE TABLE [dbo].[dimension_city]
(
[citykey] [INT] NULL,
[wwicityid] [INT] NULL,
[city] [VARCHAR](8000) NULL,
[stateprovince] [VARCHAR](8000) NULL,
[country] [VARCHAR](8000) NULL,
[continent] [VARCHAR](8000) NULL,
[salesterritory] [VARCHAR](8000) NULL,
[region] [VARCHAR](8000) NULL,
[subregion] [VARCHAR](8000) NULL,
[location] [VARCHAR](8000) NULL,
[latestrecordedpopulation] [BIGINT] NULL,
[validfrom] [DATETIME2](6) NULL,
[validto] [DATETIME2](6) NULL,
[lineagekey] [INT] NULL
);
–fact_sale
DROP TABLEIF EXISTS [dbo].[fact_sale];
CREATE TABLE [dbo].[fact_sale]
(
[salekey] [BIGINT] NULL,
[citykey] [INT] NULL,
[customerkey] [INT] NULL,
[billtocustomerkey] [INT] NULL,
[stockitemkey] [INT] NULL,
[invoicedatekey] [DATETIME2](6) NULL,
[deliverydatekey] [DATETIME2](6) NULL,
[salespersonkey] [INT] NULL,
[wwiinvoiceid] [INT] NULL,
[description] [VARCHAR](8000) NULL,
[package] [VARCHAR](8000) NULL,
[quantity] [INT] NULL,
[unitprice] [DECIMAL](18, 2) NULL,
[taxrate] [DECIMAL](18, 3) NULL,
[totalexcludingtax] [DECIMAL](29, 2) NULL,
[taxamount] [DECIMAL](38, 6) NULL,
[profit] [DECIMAL](18, 2) NULL,
[totalincludingtax] [DECIMAL](38, 6) NULL,
[totaldryitems] [INT] NULL,
[totalchilleritems] [INT] NULL,
[lineagekey] [INT] NULL,
[month] [INT] NULL,
[year] [INT] NULL,
[quarter] [INT] NULL
);
- Click the Run button.
The Data Warehouse has full DDL support to prepare tables for data ingestion or create table aggregations.
- On the Explorer, open Schemas->dbo->Tables
- Click the three dots on the right and select Refresh.
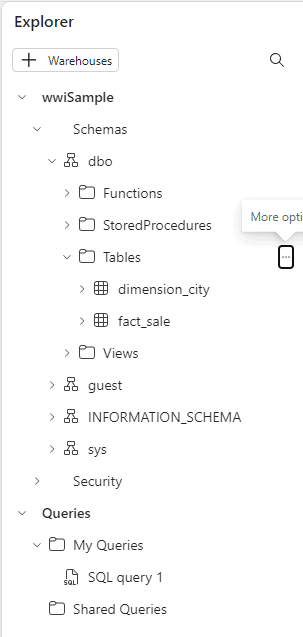
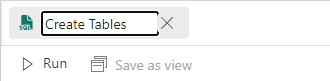
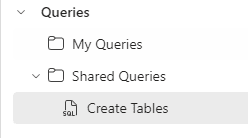
- Double click the query in the top of the window and give it a new name, Create Tables
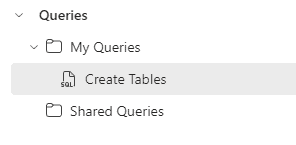
- You will be able to see your query on the left side, in the Explorer.
The Queries area in the explorer is like the queries in datamarts, but in the Data Warehouse we have the Shared Queries, allowing us to create a distinction between our personal queries and queries shared with other users.
You can move a query to Shared Queries by clicking the 3 dots and selecting the option Move to Shared Queries
Ingesting the data
We can use the COPY statement to ingest the data from an Azure Blog Storage to the data warehouse.
This is the COPY statement syntax:
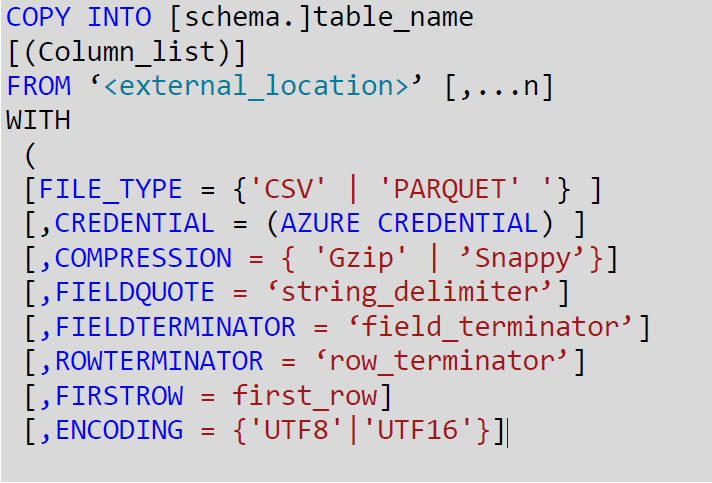
The copy statement is capable of:
- Load data from Blob Storage or ADLS Gen 2
- Load Parquet or CSV data
- Connect to secure resources using Credential
Many features documented for the COPY INTO statement for Synapse also work with Synapse Data Warehouse inside Microsoft Fabric. You can discover more about COPY INTO here
- Click the button New SQL Query
- Paste the following code in the new query window:
This storage is a public storage provided by Microsoft
- Click the Run button.
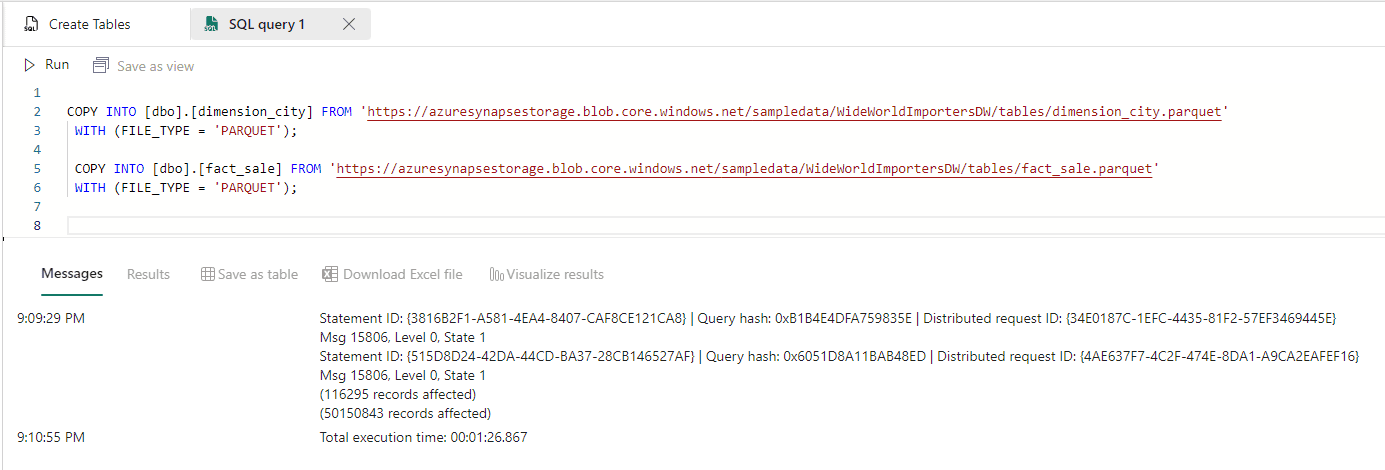
The result is 50 million of records loaded in 1min and 26 seconds. Not bad.
- Rename the query to Loading Data
Building the Model
The Data Warehouse allows us to create a model which will be shared by all datasets created from the data warehouse. This is similar with the creation of a model in a Power BI Datamart.
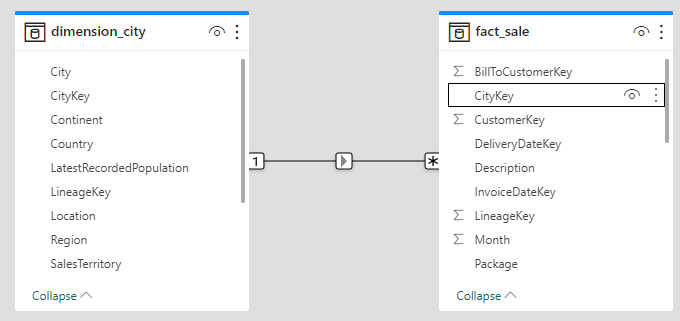
- On the tabs under the explorer, click the Model tab.
![]()
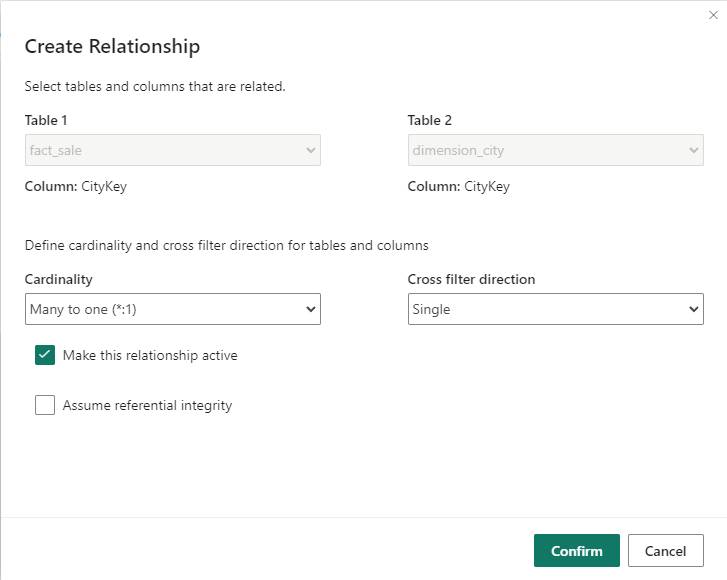
- Link the fact_table with the dimension_city by CitKey field, dragging and dropping the field from the fact_table to the dimension city.
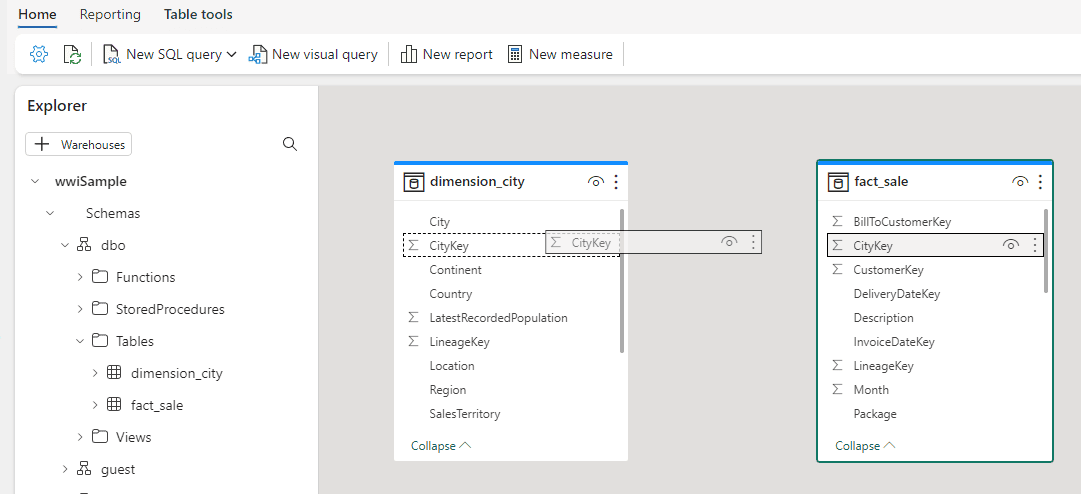
- The Create Relationship window will be, in general, correct, you only need to click the Confirm button.
Creating a Report
The data warehouse is completely integrated with Power BI. All the data is stored in OneLake, as explained in the article https://www.red-gate.com/simple-talk/cloud/azure/data-intelligence-on-light-speed-microsoft-fabric/
Power BI reports access the data in the OneLake using a technology called Direct Lake, which is faster than usual technologies to connect to SQL or Datalakes, either using Import or Direct Query.
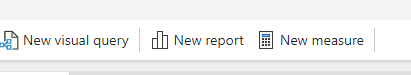
- Click the button New Report on the top of the window.
The data window on the right side of the screen brings the tables with the relationship already stablished according to the model.
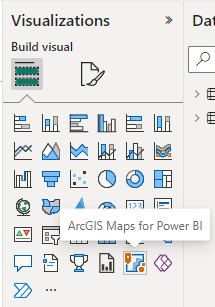
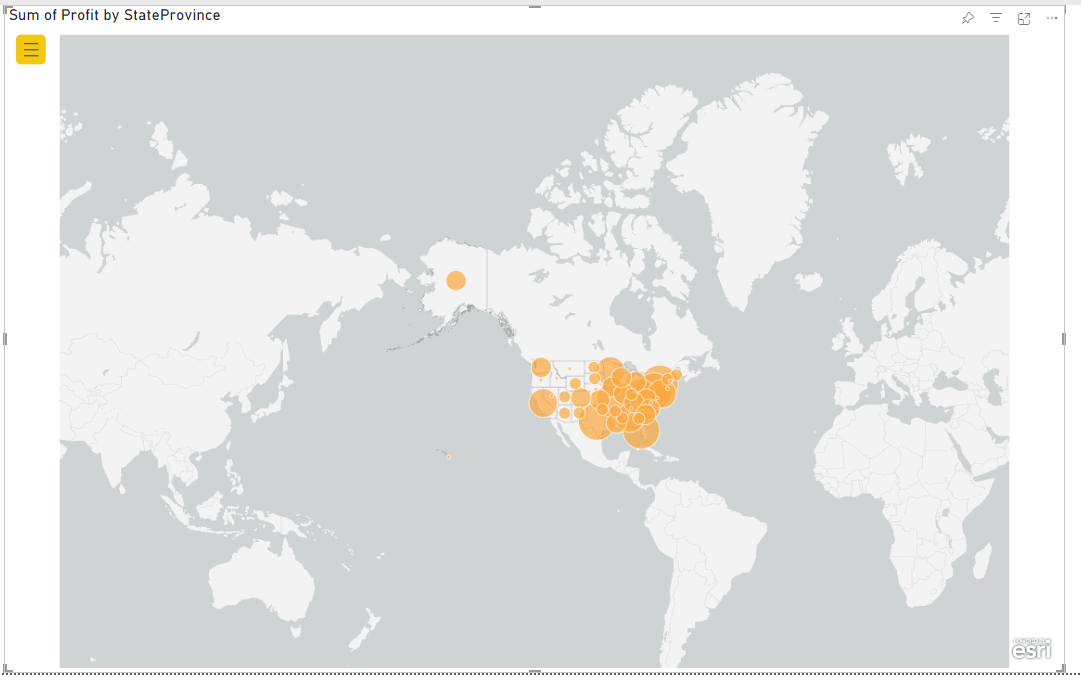
- On the visualization pane, select Arcgis Maps for Power BI
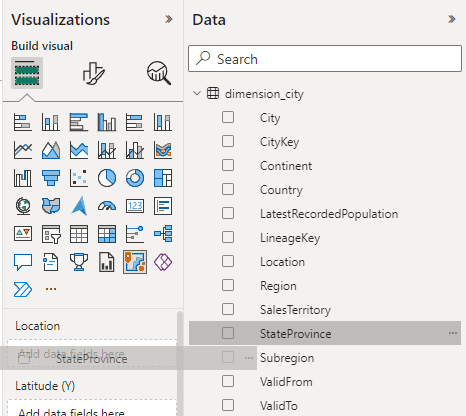
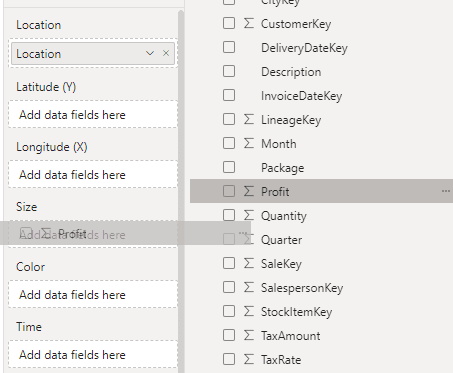
- Drag the StateProvince field from the dimension_city to the Location box in the Visualizations bar.
- Move the Profit field from the fact_sale to the Size box in the visualization bar.
- Resize the Arcgis visual to fill the report area.
- Click the File -> Save menu.
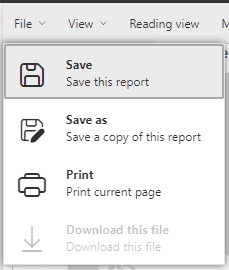
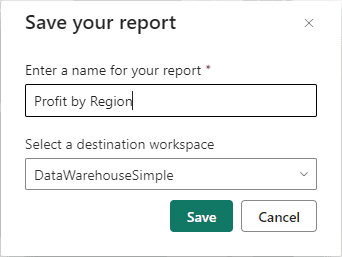
- Type the name Profit by Region and click the Save button.
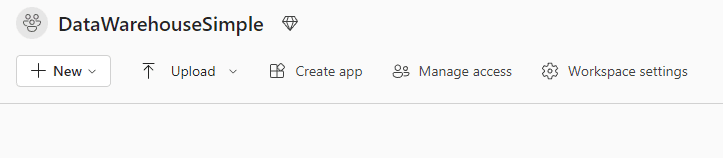
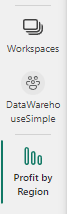
- On the left bar, click DataWarehouseSimple to return to a Workspace view.
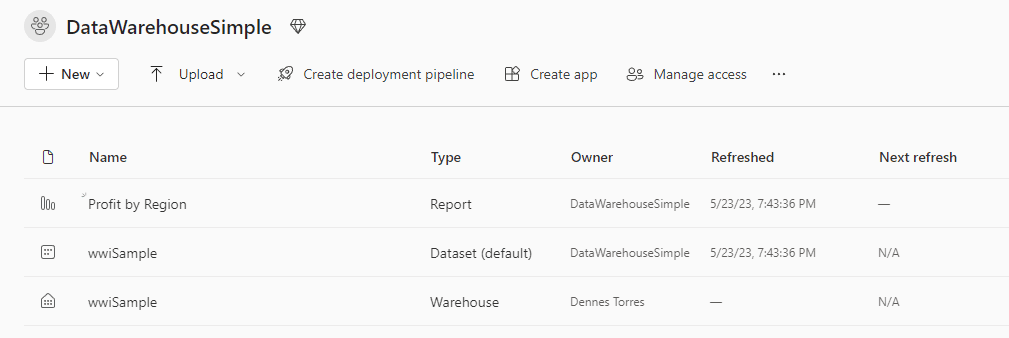
Besides the data warehouse and the report, you created, the model created in the data warehouse was saved as a dataset.
Conclusion
On this blog, you found a walkthrough to create a data warehouse, load from a blob storage using T-SQL, create the modelling and build a report.
This document contains proprietary information and is protected by copyright law.
Copyright © 2026 Red Gate Software Limited. All rights reserved


Load comments