
Here is the scenario: you have inherited a project and you need to debug some issues with JavaScript on a page when a user clicks a button. You have no idea where that JavaScript resides and you don’t want to pour through a bunch of files to figure it out. You know the error occurs when someone clicks a certain button and it would be nice if you could just use the IE Developer Tools to step into the JavaScript code that executes right after clicking said button. Well, you can.
There is a small button in the developer tools that has a pause symbol. When you click this button, the debugger will break on the next line of JavaScript to execute.
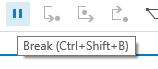
One of the issues, however, is JavaScript is so prevalent on pages now that you are likely to break on some undesired JavaScript as you move your cursor over the button to click it. So how do you avoid this? First, make sure that the developer tools window is docked in the page and not floating as a separate window. Make sure it has the focus (click in it and do not click anywhere else). Once it has the focus, move your mouse over the button you want to click. Then use the shortcut key (Ctrl+Shift+B) to break on the next line of JavaScript. Then try really hard not to move the moue and just click the button and you should break on the correct JavaScript code.
Another tactic you can use If you happen to know where the code you want to debug exists, but you are having trouble attaching at the right time, is to use JavaScript alerts to help you break in the right spot. Just throw up an alert and while the alert is up, click the Break button in the debugging tools. When you click “Ok” on the alert, the debugger will break on the next line after the alert statement.
Load comments