
A month ago Nick published a blog post about the path to adopting common business intelligence practices. At the same time, we published a survey asking for feedback on current BI trends and processes.
We asked these questions:
- Which reporting tools do you use?
- How do you share reports in your organization?
- Do you import data from other systems?
- Have you created a separate database or warehouse for analysis?
- Does your organization use (or plan to use) either SQL Server Analysis Services (SSAS) or PowerPivot?
- How do users get access to corporate data for analysis and reporting?
We had several hundred responses to the survey. Let’s take a look at the answers.
Which reporting tools do you use?
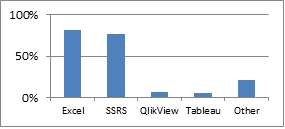
We were interested in all the reporting tools that people use, so the responses aren’t mutually exclusive. Clearly Excel and SQL Server Reporting Services (SSRS) are the most popular choices, with many organizations using both tools. The “Other” category included a diverse set of tools such as Cognos, Crystal Reports, and some proprietary solutions.
How do you share reports in your organization?
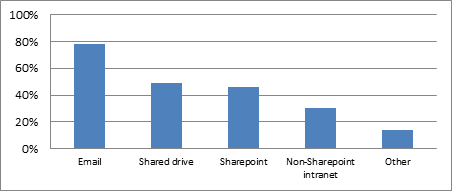
The popularity of email to share reports suggests many organizations are running ad hoc reports, or that they don’t have access to shared repositories. However, there are a significant number of organizations using shared drives or other central stores. With the response to the first question showing the popularity of SSRS, the relative popularity of Sharepoint is not surprising given that SSRS and Sharepoint are heavily integrated.
Do you import data from other systems?
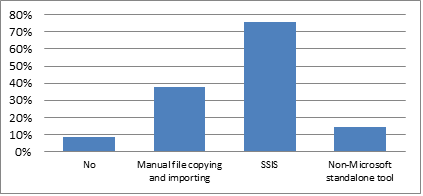
In complex systems with many disparate data sources, the data is commonly imported to a central repository for more efficient analysis. By far the most common approach is to use SQL Server Integration Services (SSIS), although many organisations are reliant on using manual techniques.
Have you created a separate database or warehouse for analysis?
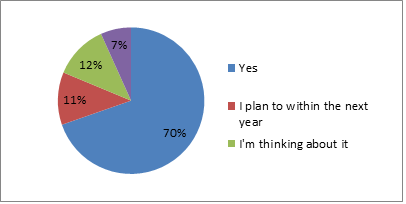
To ensure data integrity, and reduce possible performance impact on transactional databases, data is often copied to a separate database or data warehouse for analysis. Significantly, those respondents who are not doing this already are considering doing it in the future.
Does your organization use (or plan to use) either SSAS or PowerPivot?
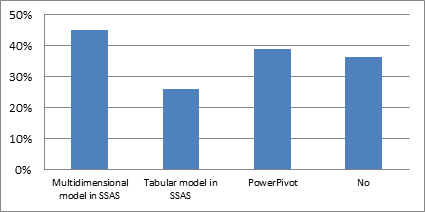
A significant number of organizations are using SSAS or PowerPivot to support their analysis function. Although more organizations are currently using the multidimensional model, there appears to be a general trend towards the tabular model. The current version of SSAS Compare only supports the multidimensional model, but we are considering adding tabular support.
How do users get access to corporate data for analysis and reporting?
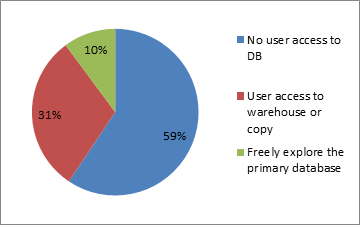
The majority of organizations currently restrict corporate data access to just the database owners, who then provide sample data or reports themselves.
Conclusions
Nearly all the organizations which responded have created (or plan to create) a separate warehouse, or at least an offline copy of the main database, to support analysis. These warehouses are most commonly populated using SSIS or manual file copying. Reports derived from these databases are mostly created using Excel or SSRS, and shared with email, shared drives and corporate intranets.
Around a third of those who responded don’t yet use Microsoft Analysis Services, or the newer self-service approach offered by PowerPivot. Our other research suggests these organisations create SSRS or Excel reports using stored procedures, or direct SQL queries on the warehouse or even the main transactional database. Of those who do use Analysis services, it’s no surprise to see that the established multidimensional model is still the most widely adopted, but more than 25% are already using or planning to use SSAS Tabular. The increasing popularity of self-service BI is reflected in the 40% of our sample who use or plan to use PowerPivot, with a similar figure giving business users limited or free access to the database for analysis.
Deployment of operational changes to SSAS models can be complex and time-consuming. SSAS Compare can reduce the work required under the multidimensional model, and we are considering adding tabular support soon. If you would like SSAS Compare to support tabular models or PowerPivot documents, let us know on our UserVoice page.
Load comments