
There is a theory which states that even one broken window in the neighborhood can increase the crime rate in the area. Even such a small unattended issue can grow and lead to much bigger crimes in the future. Those issues should not go unattended, as fixing them can have much greater benefit.
I firmly believe that the same holds true for code. If you allow even small bad things to slip into your codebase, it will constitute more serious ‘crimes’ over time. And from there it is one small step to low quality software, bugs, and annoyed users.
Software development has one constant, and it is change. Codebases evolve and grow daily. More and more code must be looked after, and new rules must be created to maintain all this ‘mess’. It doesn’t matter how small the project is, sooner or later it’ll probably become a pile of spaghetti code.
We humans are unable to keep track of everything that should be fixed, not to mention the code that’s being added. As John Carmack once said “Everything that is syntactically legal, that the compiler will accept, will eventually wind up in your codebase.” Even for statically typed languages, that’s not a good thing. It is good that there are numerous tools that let you spot and manage the issues that can or will lead to a disaster if left unattended.
This article reviews a few of those tools that aid with the difficult task of keeping code clean.
NDepend
NDepend performs a static analysis of the code-base and gathers the information about all violations. Rules can be of different magnitudes. You can skip, for now, problems with having two classes defined in one file, but you probably should fix the method with a cyclometric complexity of 30.
This tool is also good at bringing many issues to developers’ attention. It can check multiple things quickly and report any issues discovered. Thanks to that, developers may begin to be more aware of those issues, or even learn about them to begin with, as not all are common knowledge. Some developers might not understand the concept of code complexity, and they will write code that’s constructed of multiple if statements, loops, etc., producing hard to understand and hard to maintain code. Although such code would do its job and deliver requested features, it might not be the best approach in the long run. Code is read much more often than written, so it’s a good investment to write it so it’s understandable and easy to maintain with a clean split of responsibilities.
If you feel that you may be lacking some knowledge about high quality code – it’s nice to check NDepend’s rules – you might learn one or two good practices. They are divided into categories, so you can focus only on specific ones, i.e. first you check Code Smell rules and leave Object-Oriented Design violations for later.
NDepend, in fact, goes even further. It calculates the technical debt value for your project. If you’re not familiar with the term, technical debt means that, if corners are cut while developing a feature or an optimal solution is not used, additional work is created which must be addressed eventually. As in real life, you can have debts if they are manageable, but there’s a threshold after which it’s no longer possible to maintain the debt and you need to pay it back.
Here the technical debt is a value that represents the current state of your projects in terms of violations of technical issues that should be fixed. Based on the problems found, and judging by the time spent (on average) that’s needed to fix a specific problem, NDepend can estimate how much time is necessary to make your project issue free. It can, of course, track your progress so you know whether you are on the right track or not.
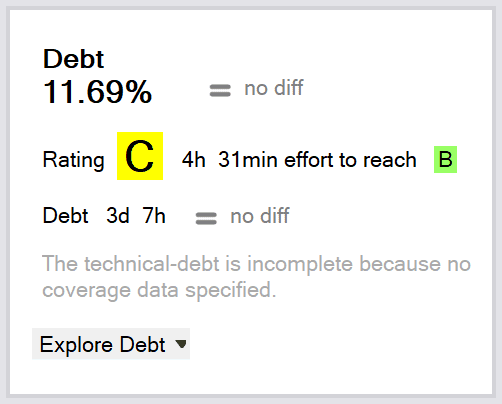
It also grades your project. It tells you how much time to reach the next grade level, and, while it would be better to have an A, maybe going up a grade would require a tremendous amount of time and a B is good enough. Such situations must be analyzed on a project-by-project basis.
NDepend works right within Visual Studio and you can analyze existing projects or begin with a new project. Each rule is displayed in a window where you can see the outcome.
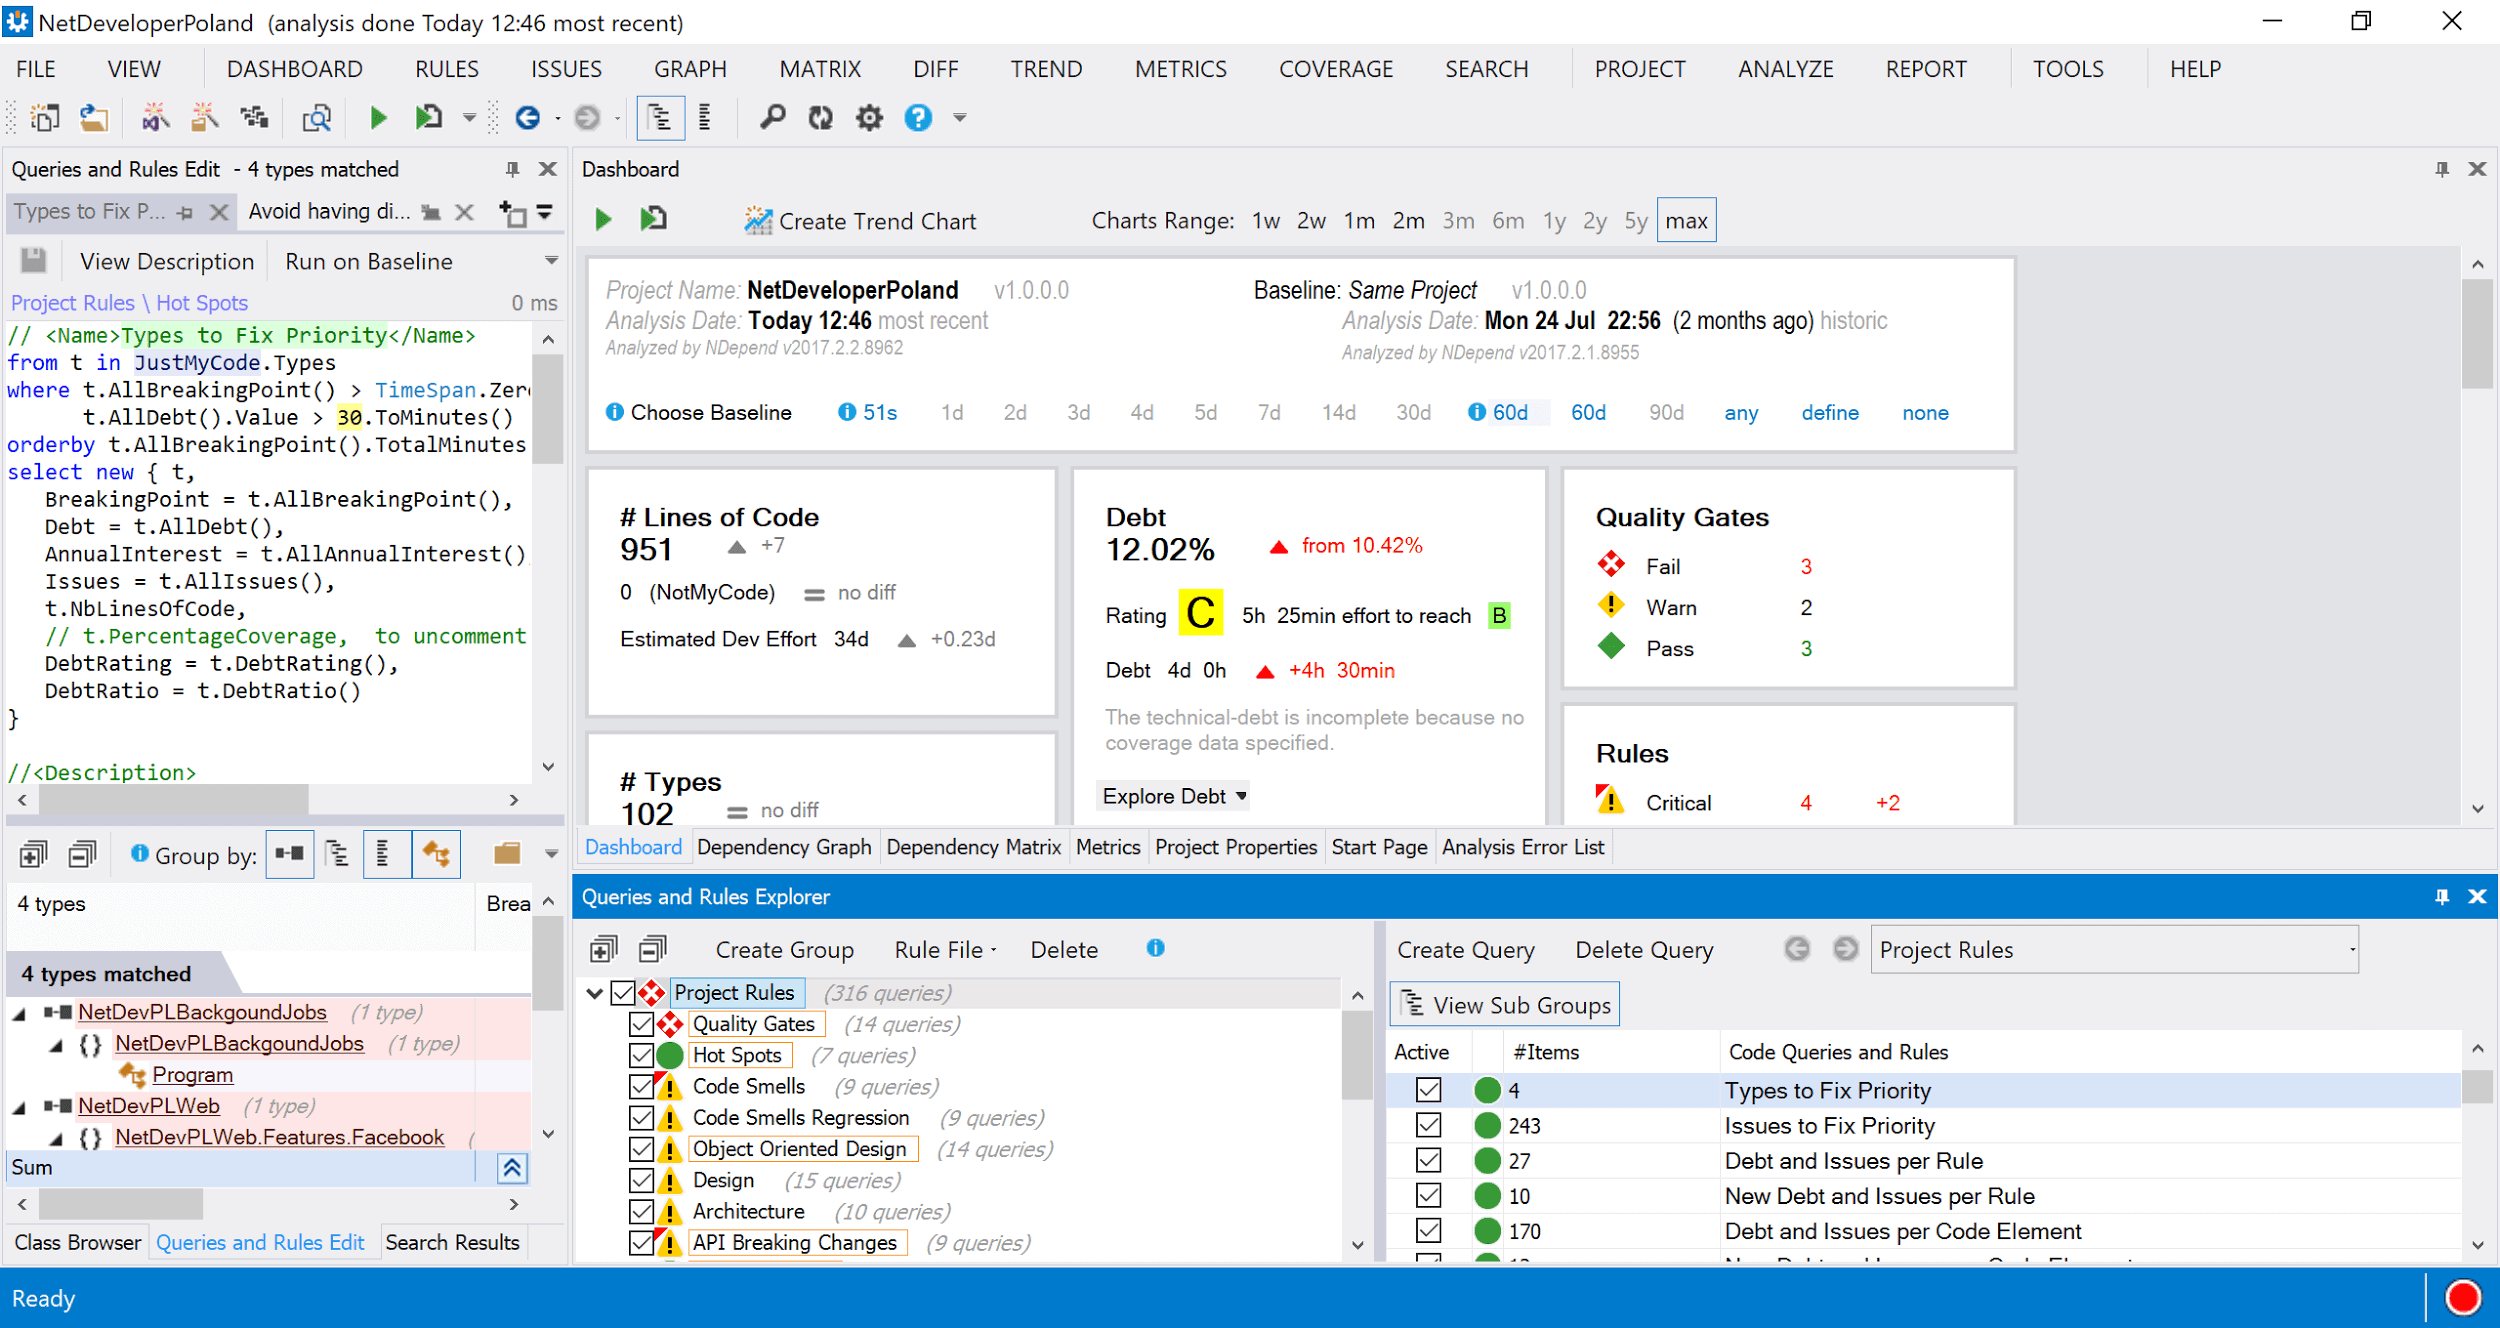
What is even better is that each rule is a query that’s written in CQLinq (Code Query Language). This language is based on LINQ, so it’s both easy to understand and easy to modify. Thanks to that, you can quickly change rules if you find them too restrictive or, on the contrary, too weak.
NDepend has more than rules to assist you in the fight for a better codebase; it also has a Dependency Graph, a Dependency Matrix, and a Metrics view. All can help you create good, maintainable code. Where NDepend really shines is that it can be integrated with a continuous integration system, for example TeamCity or Visual Studio Team Services, and those rules can be checked at every build. With such an approach, you can make sure that low quality code will not slip through. This is a must have for every team that wants to create high quality code.
RevDeBug
Not all flaws are clearly visible within your code whenever you use a static analysis or just read that wall of text in front of you. Sometimes, you must rely on runtime information to notice bad design decisions or performance bottlenecks. Those too can be issues that, in the future, will lead to a declining quality of produced code. To find and fix these flaws, you must use a different type of tool, like RevDeBug.
RevDeBug is a reverse debugger that allows you to step back through your code. If you are not familiar with the concept of reverse debugging, I encourage you to check it out – it is very useful, but this article doesn’t focus on those features. Instead, it will focus on code analysis using RevDebug’s Search functionality. As mentioned before, and contrary to NDepend, this time the analysis will be done during runtime. This way it will not only do the checks on the code that was executed, but also will verify things that are not possible to do in a static analysis like control flow via exceptions. The main benefit is that you can perform the analysis only on the parts of code that you have an interest in.
How to do it in RevDeBug? After installing the tool, you are given a new Record button in Visual Studio that, when executed, will instrument the assembly with additional code that will be later gathered and analyzed by the RevDeBug engine. After recording a session, one needs a query that will extract rule violations. As with NDepend, there’s a query that can be modified and executed.
For example, with a short query such as the one presented below, you can find all the places where there is a catch section without any code inside.
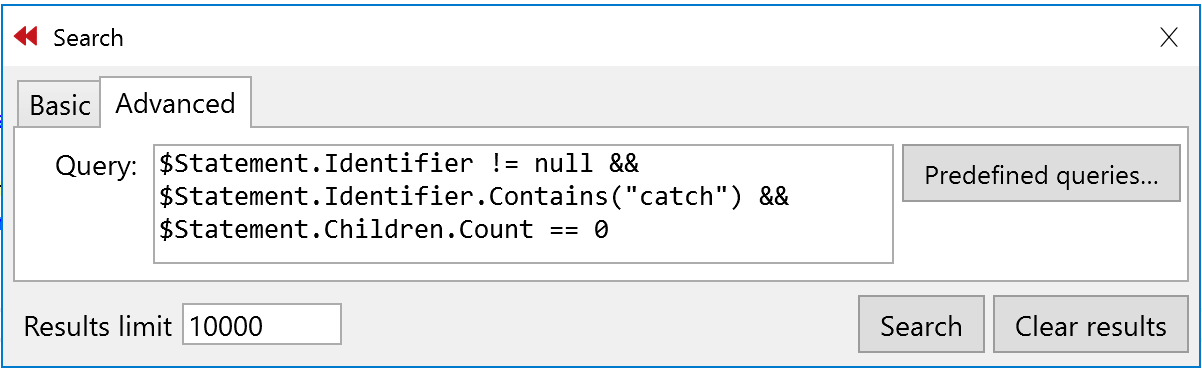
Also, you could check that no-one is writing try-catch without specifying the exception that is being handled. Write a bit more complex rule and you’re good to go:
|
1 |
$BaseState.Kind == StateKind.Catch && $Statement.Identifier != null && new Regex ("catch(((\\s*)(\n))*(\\s*)*)\\{").Match($Statement.Identifier).Success |
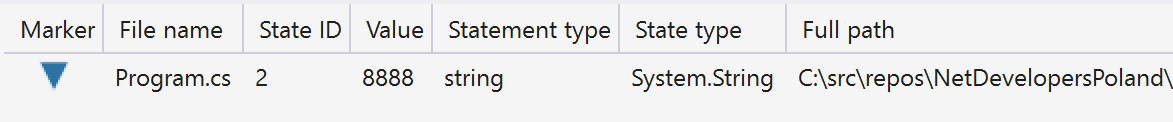
It’s quite a powerful feature I must admit. One can also query for different violations in code. Here’s query that will search for all the numbers being stored as strings.
|
1 |
$VariableState.TypeName == "System.String" && !String.IsNullOrEmpty($VariableState.Value) && $VariableState.Value.All(Char.IsDigit) |
With such a query, you can easily find that someone is storing a port number as a string and fix it.
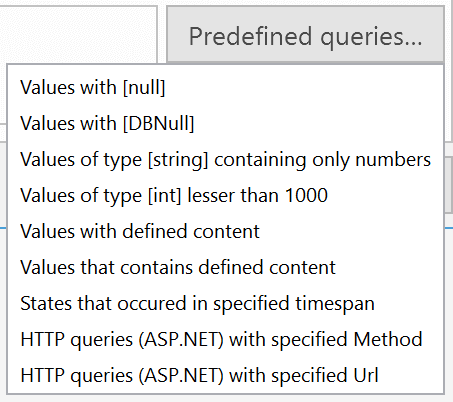
RevDeBug also comes with predefined rules that can be used to either search for specific code constructs or to learn how to build your own rules.
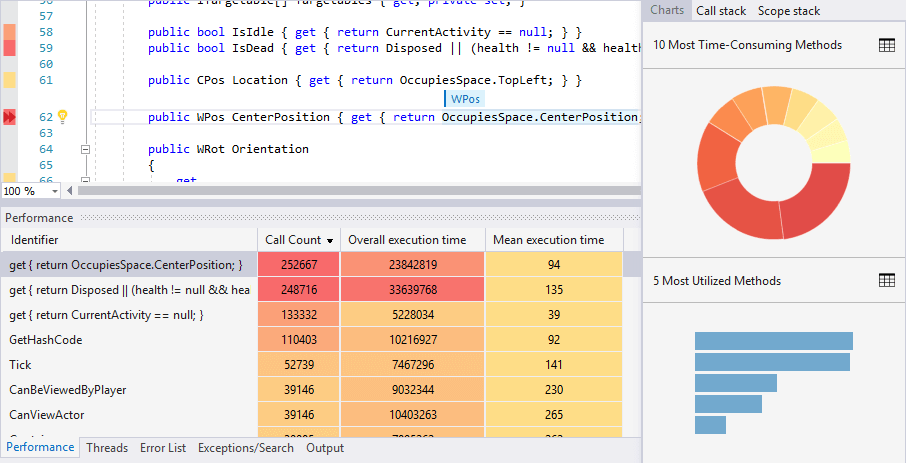
In terms of performance tweaking, it’s worth noting that RevDeBug also provides profiling information extracted from the gathered runtime data. This feature allows you to pinpoint all the time consuming or heavily utilized methods which can be used to track down all those sluggish parts of the code. Additionally, one can easily jump into the recorded execution of the slow method to analyze what might be the cause of the decreased performance.
Although those are not the main features of RevDeBug, it’s nice that you can use this tool for inspecting the code. Finding out potentially risky places in the codebase allows you to quickly mitigate the risks of bugs that might arise in the future. Such violations should be put under closer investigation and addressed as quickly as they appear in the code. Go check it out.
OpenCover
There are also tools that can be found in the open-source world like OpenCover. OpenCover is a console application that allows you to specify the target that will be monitored, and, after an execution, return data about what was executed. It can help establish information how much of the application is unit tested and how good the tests are. Knowing this can help you decide whether part of the code can be rewritten or not. If you know that you have a good test coverage, and those tests are of good quality, you can make the change with more confidence than if tests were lacking or were of poor quality.
OpenCover, as in case of RevDeBug, does the analysis in runtime. It can give you a numerical indication of how much code and how many potential executions paths are covered by your unit tests. This is the first indicator of how much code is tested. It’s not the ultimate metric of how good your tests are but, if you fail on that one, you didn’t even get to the point where the quality of your tests starts to count.
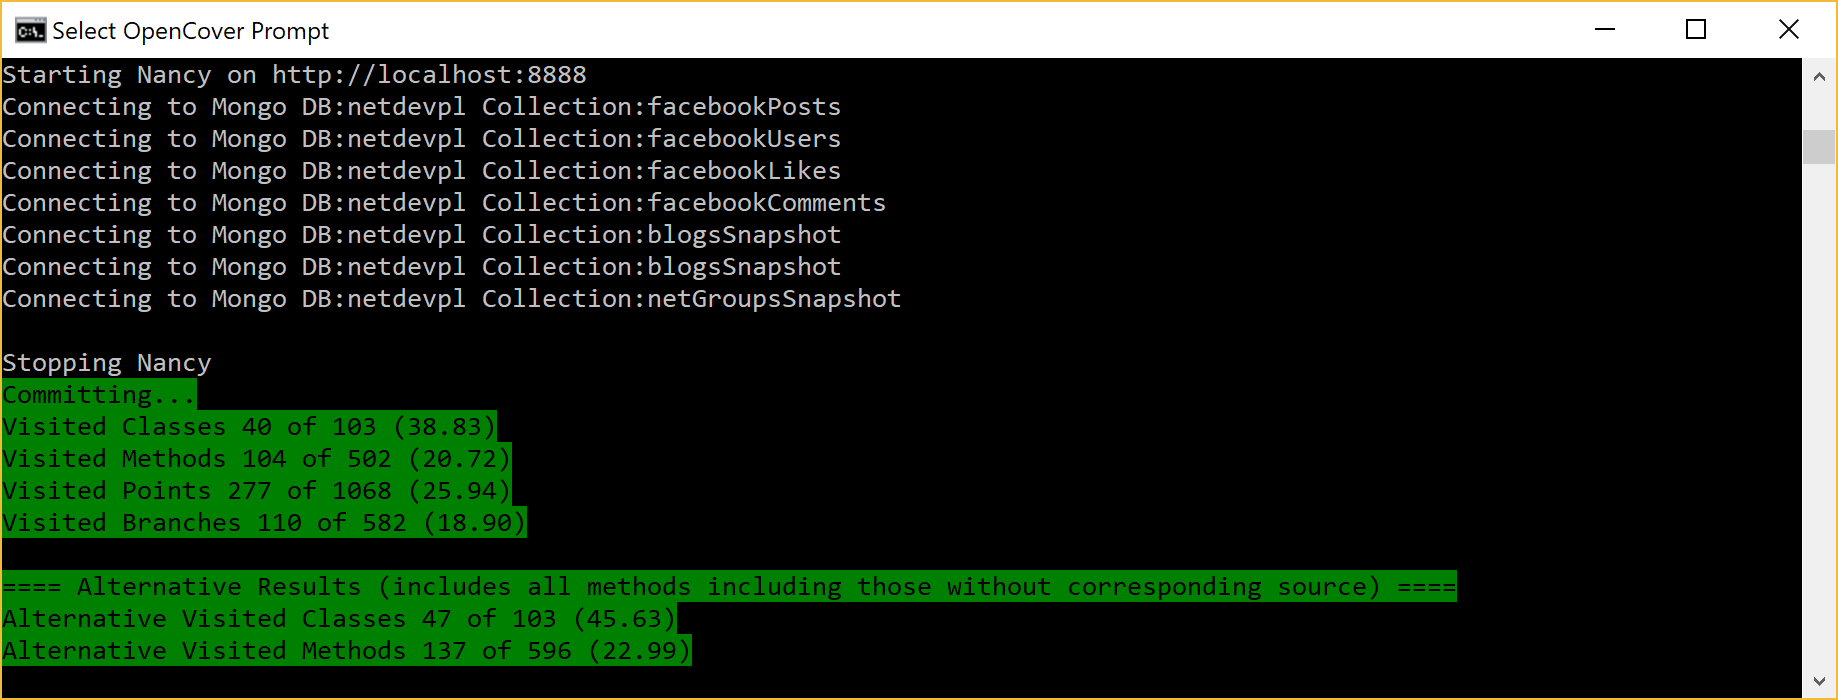
After running the part of the application that you want to check, the application must be stopped and OpenCover kicks in. The result is a report file that contains the coverage data of tests that had been run.
I will not go into the details of the numerous options the tool has. For a full list, just visit the project’s page at https://github.com/opencover/opencover/wiki/Usage.
It’s an open source project that is great at generating coverage data, but it doesn’t present them in a human consumable form out of the box.
For generating nice reports from its xml file, you can use another open-source tool, ReportGenerator. It can read multiple formats (including the one from OpenCover), generate charts, and present the same information that is in the xml document in a more straightforward way. Passing an OpenCover report file to ReportGenerator might generate an HTML file looking like this one:
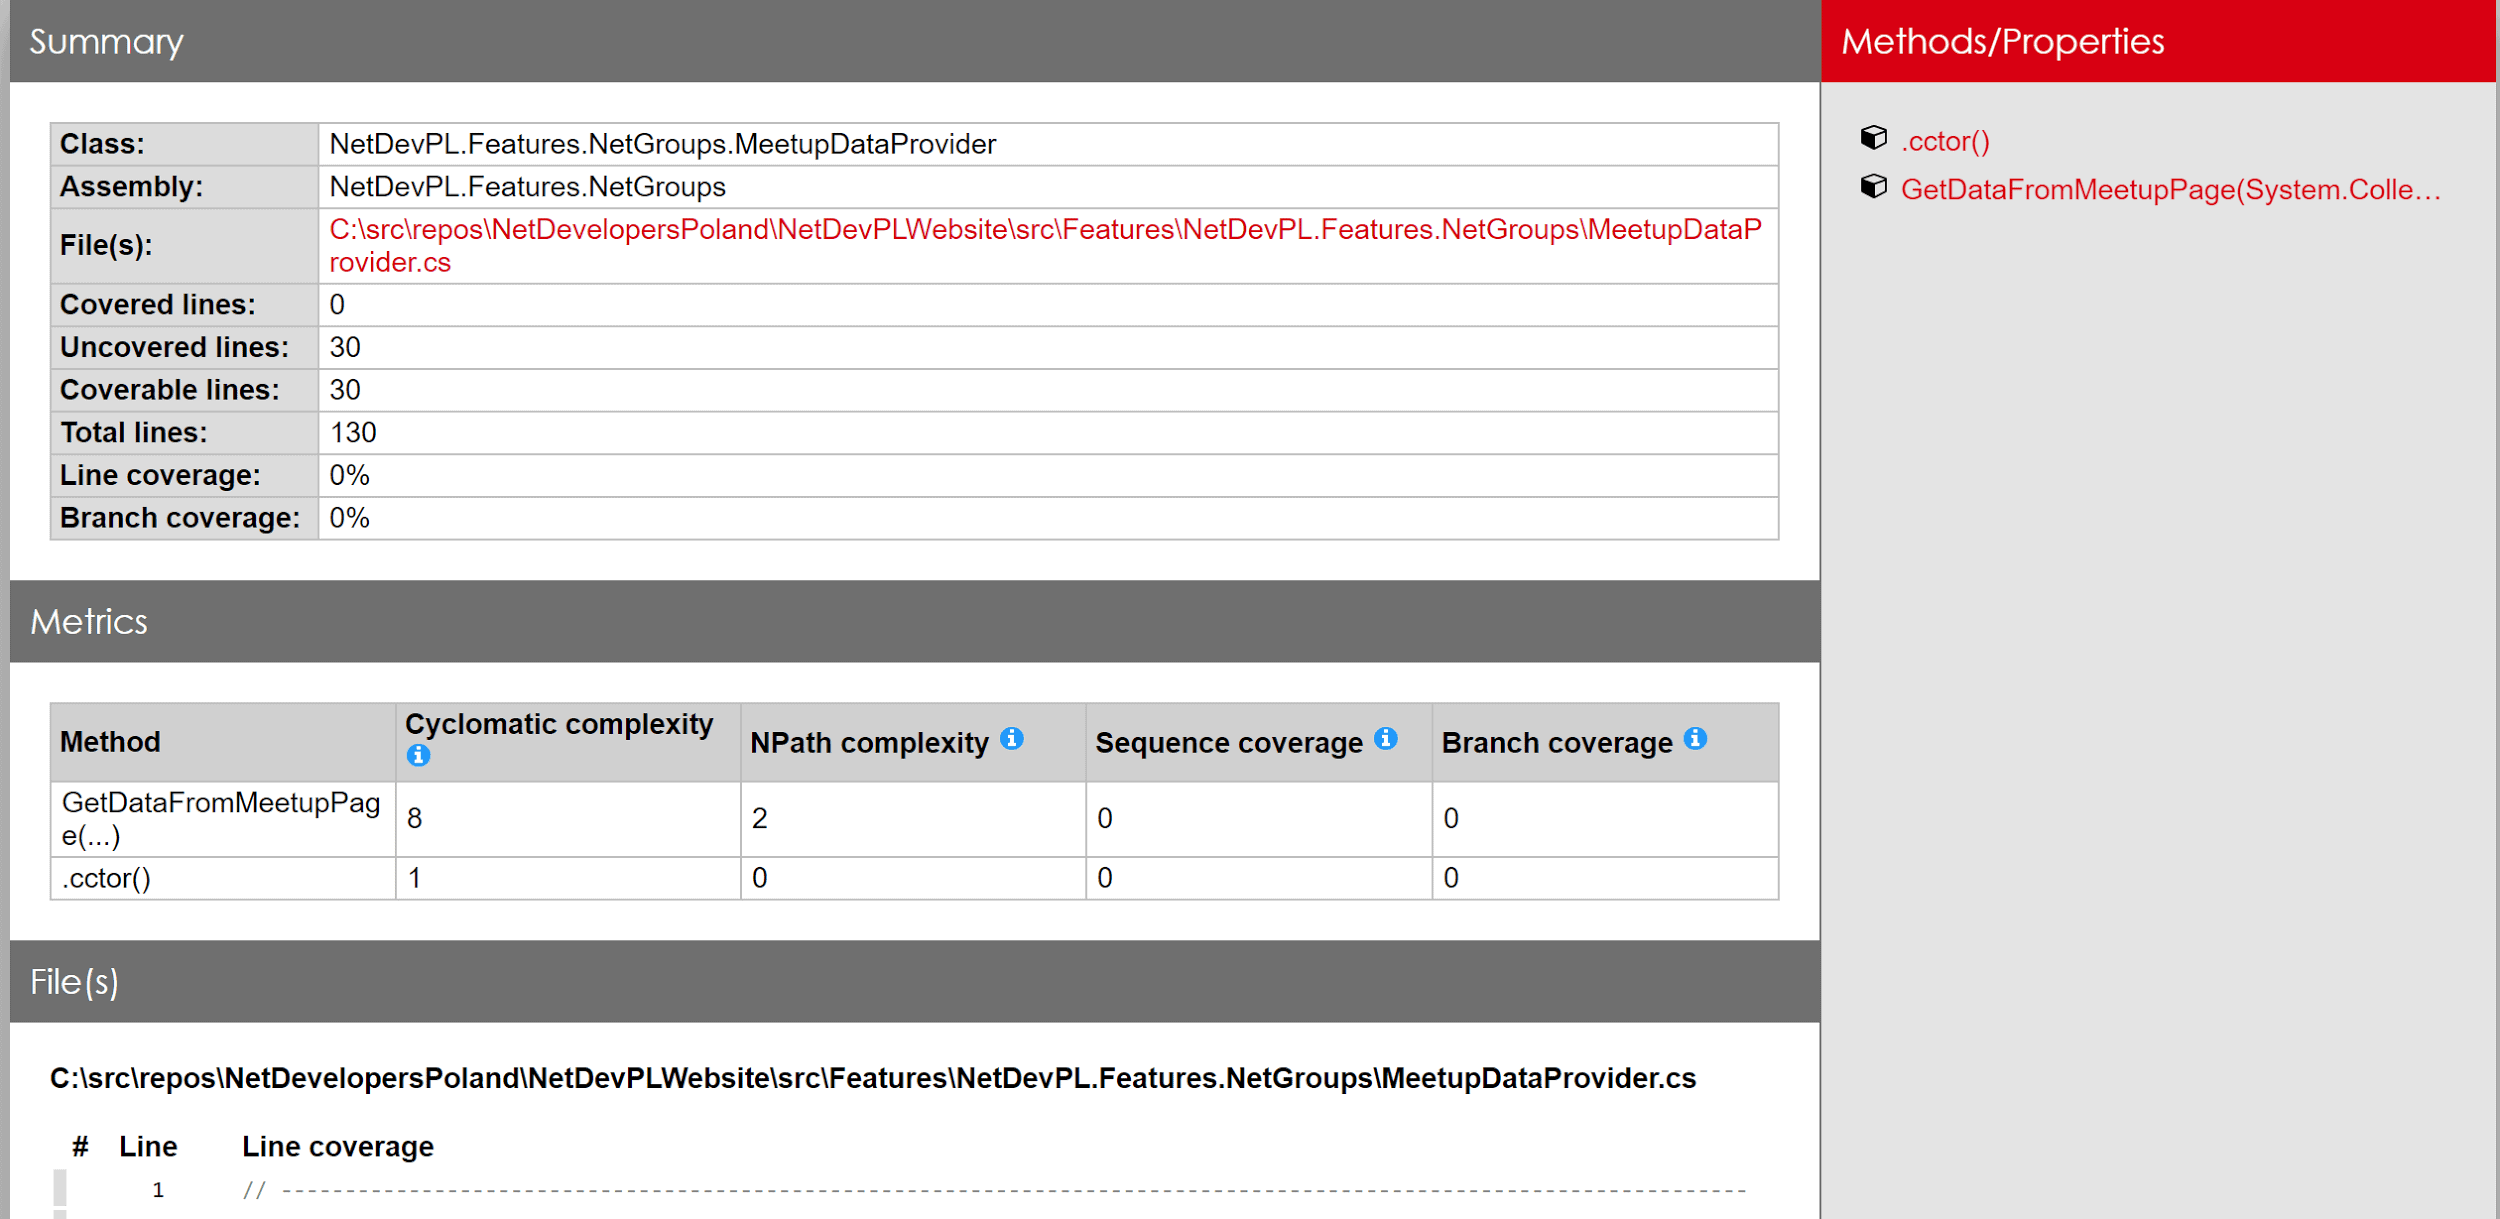
That’s a bit easier to grasp than analyzing xml by hand. By seeing data presented in such form you might be more willing to fix GetDataFromMeetupPage with a cyclomatic complexity of 8. Test coverage is also presented in a visual form on a source code line basis:
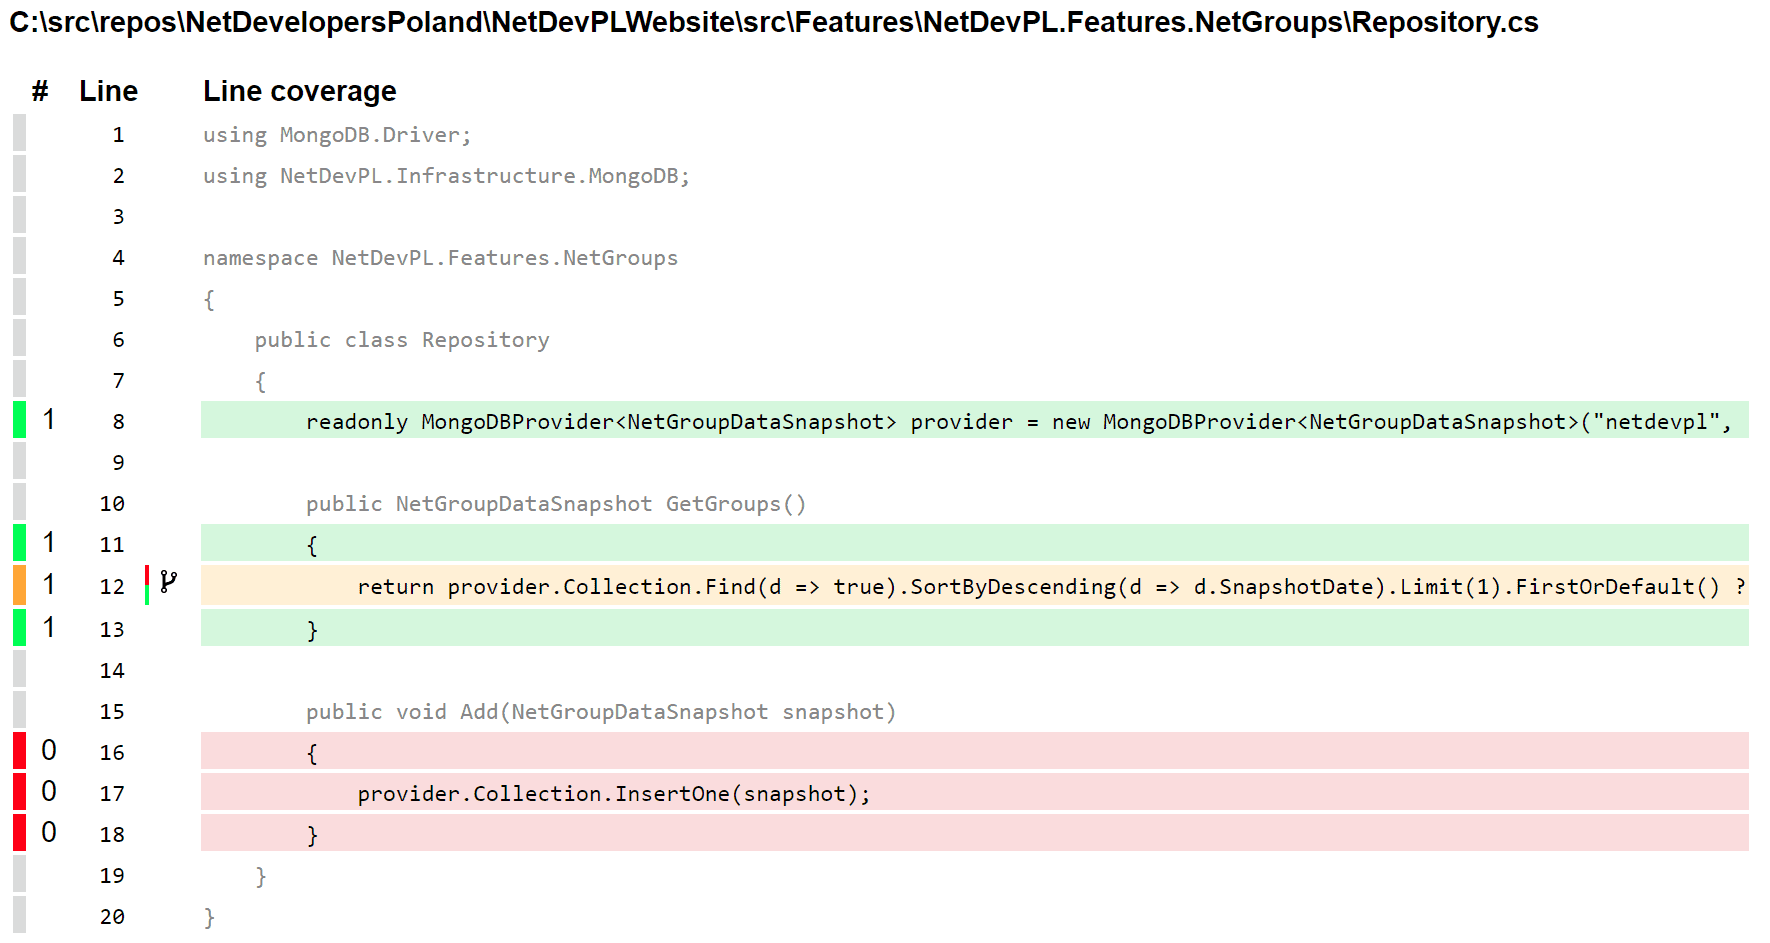
It not only gives information about lines being covered or not, but also whether it’s covered only partially. On the screenshot above you can see that line 12 is marked as yellow and there’s a little icon near the line number. This is an indicator that this line is being covered only partially by tests and you might want to extend your tests to have the alternative code path tested as well. By doing this you can be sure that, in case of a major change in code, all of the executions path will be tested and nothing will slip through.
Summary
Technical debt is not a new concept, although it might not get enough attention from developers and managers. It’s good that tools such as NDepend, RevDeBug, OpenCover, and many others not covered here, exist as they bring more awareness of the problem. Knowing that the issues exist, and measuring them, are the first steps for developers to be able to fix them before they become too big to maintain. Leaving those issues unattended leads to thwarting development speed, degrading the software’s quality, and ultimately making the company’s profits suffer. Management of technical debt allows shipping better quality code faster and providing more value for users of your software.
This document contains proprietary information and is protected by copyright law.
Copyright © 2026 Red Gate Software Limited. All rights reserved
Load comments