
Introduction
It is always important to get an objective idea of the quality of the code that is being checked into source control within a development team, especially as a reminder to yourself when you check in something that isn’t completely right. Unless you are aware of the extent of technical debt that is being introduced in order to meet the production timelines, it is all too easy to end up being surprised by very expensive extended cycles of refactoring in consequence. An Agile project that is committed to Continuous Delivery on a fortnightly cycle can therefore ill afford to allow technical debt to build up. So how can we provide an automated process which can keep a check on your code base to alert the team of any serious quality issues that are being introduced?
DevOps and Agile Software Development
DevOps introduces a number of practices that bridge the gap between software development, test and operations while automating the processes of software delivery. It’s a culture shift within the organization, where different teams work collaboratively together to do tasks that require cross-functional expertise to perform rapidly and effectively. Devops teams tend to create tool-chains to allow best-in-class tools that do one task well to work together in pipelines.
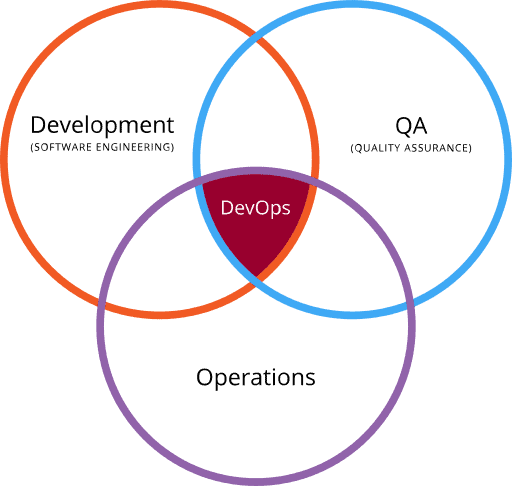
Figure 1: DevOps – an intersection of Dev, QA and Operations [1]
Agile and DevOps are similar in many aspects, but while Agile Software Development represents a change in thinking and practice that should lead to organizational change, DevOps places more emphasis on implementing change to achieve its goals by establishing an environment where, for example, it becomes easier to release more reliable applications faster and more frequently.
This image below from Wikimedia illustrates various stages in a DevOps environment where there are various tools which come together in assisting delivery across each of these functional phases. Tools such as Docker (containerization), Jenkins (continuous Integration), Puppet (Infrastructure as Code) and Vagrant (virtualization platform) among many others, are often used.
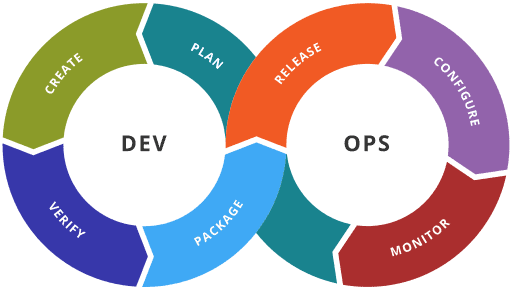
Figure 2: Various DevOps Stages [1]
Our focus today would be on VERIFY phase of DEV section as depicted in figure 2. In this phase we focus on code quality inspection to ensure there are no serious quality issues being introduced. These are commonly referred to as static code analysis tools because they check the code rather than whatever is built from the code. Although there are numerous open source and commercial tools out there in the market (here), I would like focus on SonarQube which has been out there for some time, with widespread usage.
SonarQube
SonarQube is an Open Source DevOps tool which can assist Dev teams to provide centralized automated checks on the incoming code. It provides more than 20 analyzers that can, between them, support all the major languages such as C/C++, JavaScript, C#, Java, COBOL, PL/SQL, PHP, ABAP, VB.NET, Python, RPG, Flex, Objective-C, Swift etc. to provide numerous rules to spot general and language-specific quality issues.
In addition to highlighting code issues, SonarQube provides a wide range of plugins to suit to an agile Software Development team. It can be easily integrated with any of the CI engines such as Jenkins, VSTS, TFS, Travis-CI to schedule periodic jobs. It supports SQL Server, MySQL, Oracle and PostgreSQL to suit to your individual project technology stack. Its Portal is designed to aggregate results across multiple projects into an intelligent dashboard to provide centralized reporting, an executive view for risk analysis, governance and as well can integrate with JIRA to assign developer tasks on remediation. Furthermore, if you do have your own BI layer, one could utilize SonarQube rest API interface to feed the scan reports into your BI data layer. Looking for other integrations? Please refer this link for full list of available plugins.
Taking it for a spin
In this exercise, we will take a couple of simple illustrations to show the different tools required to have a successful SonarQube scan on a sample program on the Windows platform. The first will use Java, and the second one C#. We will then go over the scan, analyze the issues, and fix them in order to get a clean bill of health for the application code.
Step 1: Download the SonarQube Server (here) and extract the package on local hard drive C:\sonarqube
Start the SonarQube Server by executing C:\sonarqube\bin\windows-x86-xx\StartSonar.bat
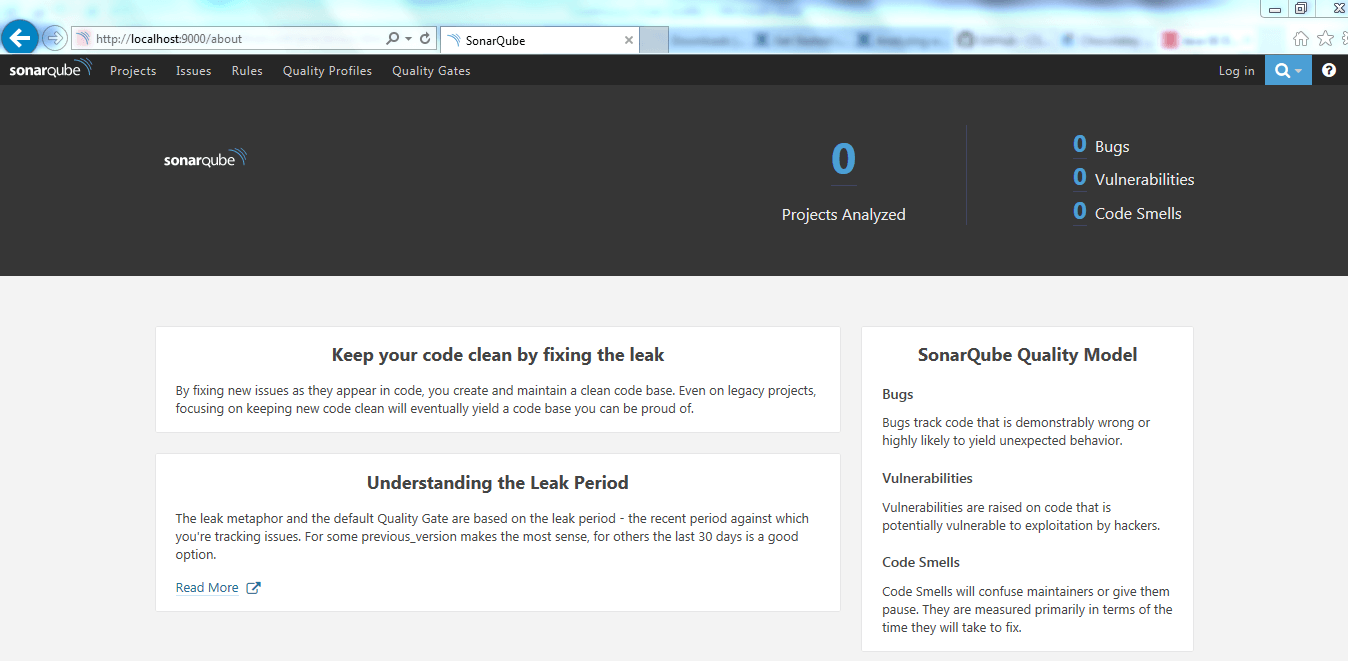
Figure 3: SonarQube Portal
Verify that the server is up at http://localhost:9000/. This is a portal that, in a single location, allows you to inspect the results of all the various scans executed on various projects. Note the number of Projects shown on the top right is 0. Don’t worry about it for now, as this will change once we execute a scan on our sample projects.
Step 2: Assuming that we have a clean system and are installing everything from scratch, we would need various essential software components such as JDK 8 and Eclipse. We’ll download and install them via Chocolatey which assists in packaged installations along with any dependencies. It has the advantage of managing updates and uninstalls as well as installs.
If you haven’t already installed Chocolatey, execute the line of script shown below in the command prompt as Administrator. This would install Chocolatey on your machine.
|
1 |
@powershell -NoProfile -ExecutionPolicy Bypass -Command "[System.Net.WebRequest]::DefaultWebProxy.Credentials = [System.Net.CredentialCache]::DefaultCredentials; iex ((New-Object System.Net.WebClient).DownloadString('https://chocolatey.org/install.ps1'))" && SET PATH="%PATH%;%ALLUSERSPROFILE%\chocolatey\bin" |
Note: Close your command prompt after installation.
Step 3: Execute the below line of script on command prompt as an Administrator to install JDK 8 and Eclipse on your machine.
|
1 2 |
choco install –y jdk8 choco install –y eclipse |
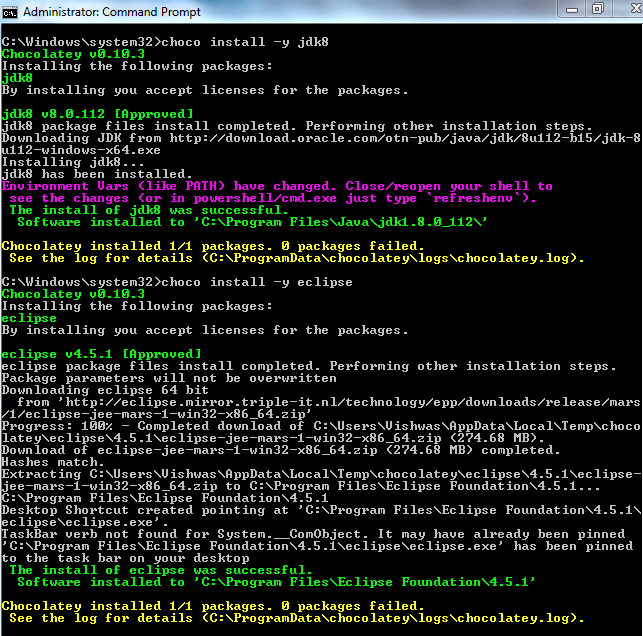
Figure 4: Installation of JDK 8 and Eclipse
Step 4: We would need a scanner to perform scanning on our code base. To accomplish this, we would have to install SonarQube scanner. Execute the line of script below in the command prompt as an Administrator to install SonarQube scanner on your machine.
choco install –y sonarcube-scanner
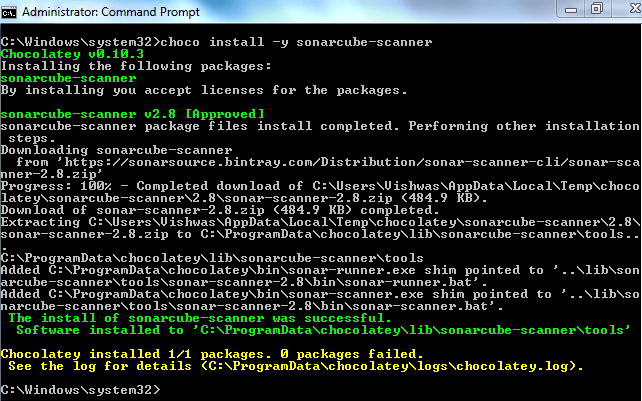
Figure 5: Installation of Sonarcube-Scanner
Step 5: Let’s write a sample java program to be scanned. We’ll fire up Eclipse and create our java project SonarTestApp with a simple java ‘Hello World’ program.
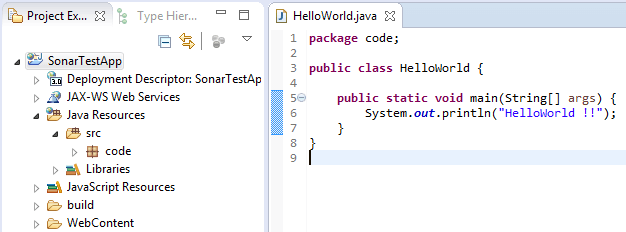
Figure 6: Sample Java Program
Step 6: To execute a sonar scan on this program, we would need to create a properties file to instruct sonar scanner on some the details of the project. Create the following file in the root directory of your SonarTestApp project.
|
1 2 3 4 5 6 7 8 9 10 11 12 |
sonar-project.properties # must be unique in a given SonarQube instance sonar.projectKey=my:Sonar # this is the name and version displayed in the SonarQube UI. Was mandatory prior to SonarQube 6.1. sonar.projectName=SonarTestApp sonar.projectVersion=1.0 # Path is relative to the sonar-project.properties file. Replace "\" by "/" on Windows. # Since SonarQube 4.2, this property is optional if sonar.modules is set. # If not set, SonarQube starts looking for source code from the directory containing # the sonar-project.properties file. sonar.sources=./src |
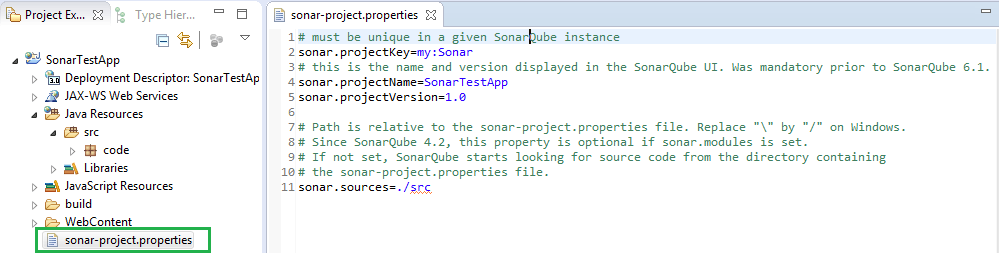
Figure 7: Sonar Project Properties File
Step 7: Open command prompt, navigate to the project root folder and initiate the scan by using the command sonar-scanner. You can see the analysis being performed and should get a success notification in about 30 seconds.
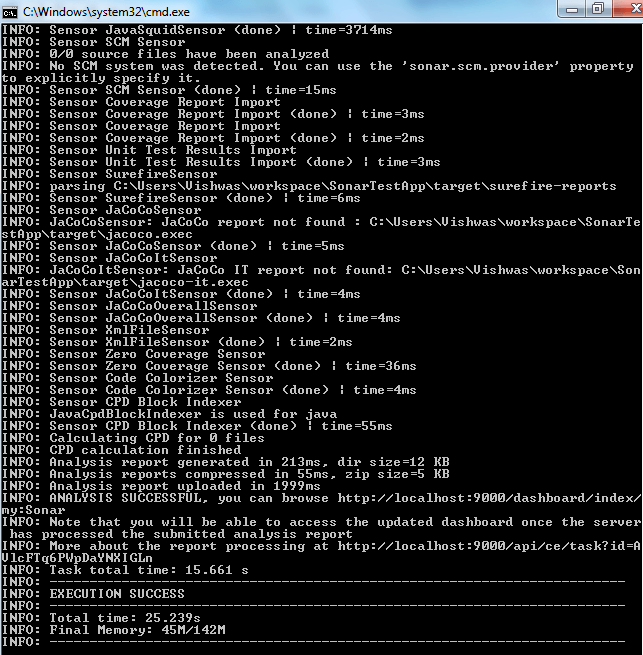
Figure 8: Sonar Scan Snapshot
Step 8: Now that scanner has completed, view the results in our SonarQube Server instance hosted at http://localhost:9000/
Voila we have our first sonar scan report!
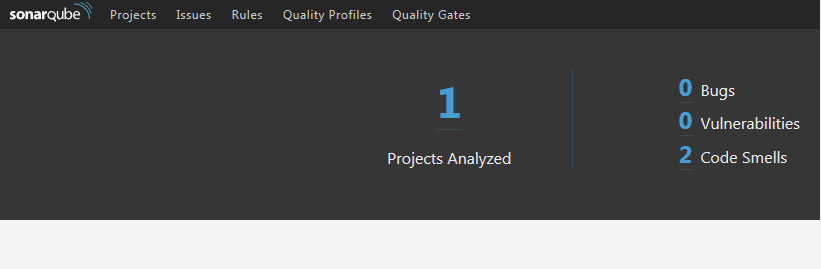
Figure 9: SonarQube Portal with High Level Scan Report
The landing page provides high level information. This tells us that we have two code smells, let’s now did deeper to see what the issues with our code are.
After navigating to the ‘Projects’ tab, it looks as if our project has passed the ‘Quality Gate’, but has a D rating in maintainability.
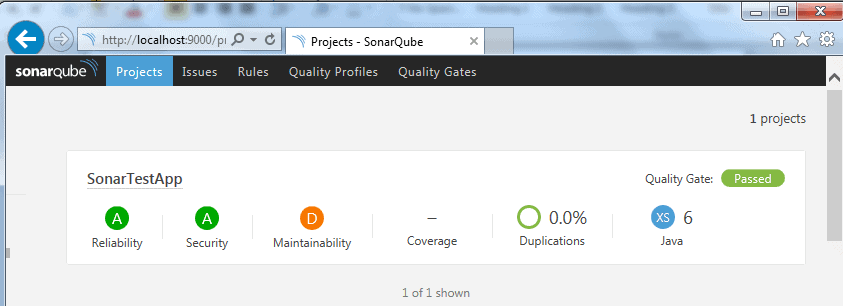
Figure 10: SonarQube Portal highlighting Key Scan Factors
Let’s drill down to the ‘Issues’ section to see further details.
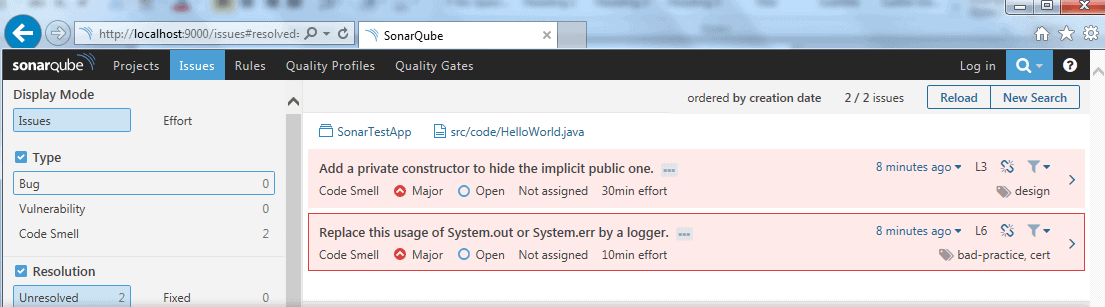
Figure 11: SonarQube Portal highlighting all issues
Ok. There are two problems with maintainability that are highlighted in HelloWorld.java class file. We can visually pinpoint the line of code by clicking on the class file.
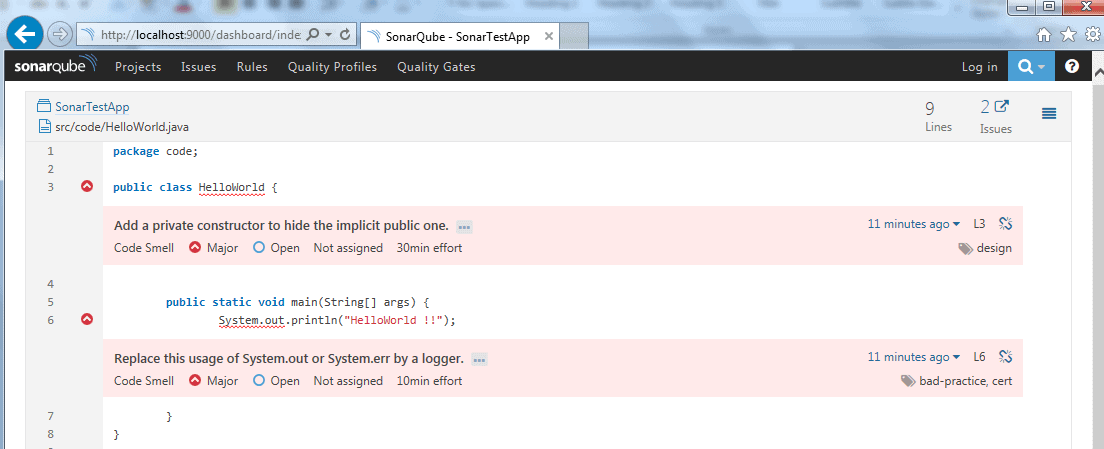
Figure 12: SonarQube Portal highlighting issues within a java file
The two issues here are classified into the categories of ‘Bad Design’ and ‘Bad Practice’.
- Private Constructor is missing: Given the static nature of the main class, sonar scan has identified this class to be private and is indeed correct in doing so. Typically, these are classified as utility classes and one should not be able to instantiate them as a logger.
- Using System. Out: This prints the log on a console, which is not a good practice should this code be used in production. Logs have to be classified under a standard format that is tuned to your production environment so that it could be further read easily and parsed. There also has to be a sensitivity level established to ensure we don’t spam our log file with too many log entries. So, again, Sonar scan is on the right track to warn us on this bad practice.
Step 9: Let’s go ahead and take care of these issues in our source file.
-
Let’s add a private constructor to ensure this class cannot be instantiated.
123private HelloWorld() {throw new IllegalAccessError("Should not be instantiated");} -
We’ll now implement a logger to capture logs.
1private static final Logger LOGGER = Logger.getLogger(HelloWorld.class.getName());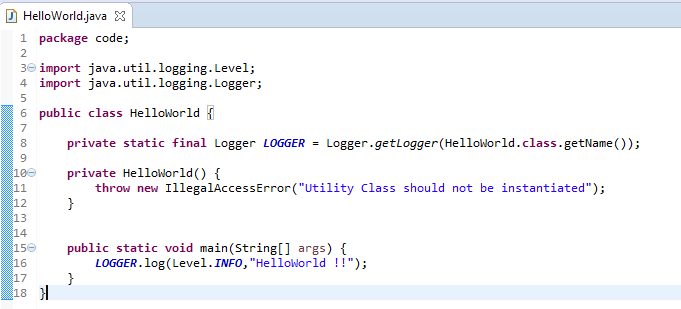
Figure 13: Fixed Java Program File
Step 10: Rerun the scanner by navigating to the project root folder and type in the command sonar-scanner. You can see the analysis being performed and should get a success notification in about 30 seconds.
View the results in our SonarQube Server instance hosted at http://localhost:9000/
As you can see from this screenshot, we got clean bill of health for the code!
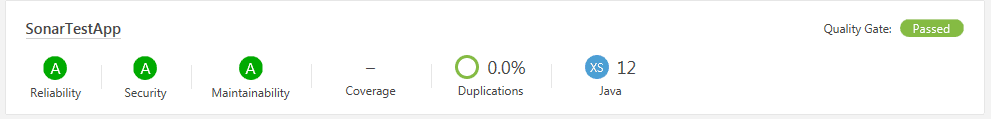
Figure 14: SonarQube Portal re-scan report
A C# project
We will now rerun this activity on a sample C# program.
Step 11: Create our C# project SonarTestApp with a simple C# ‘Hello World’ program.
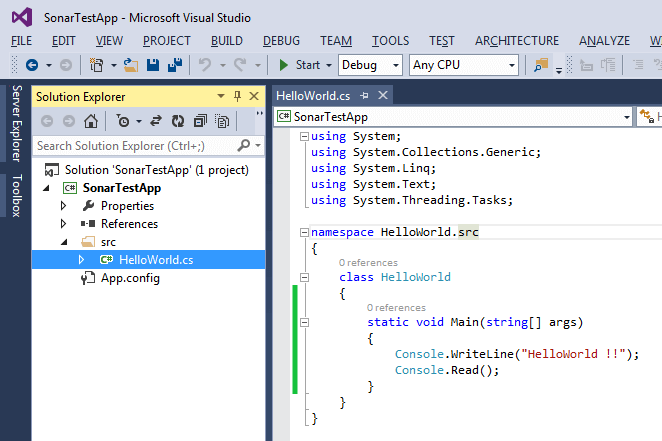
Figure 15: Sample C# Program
Step 12: Create a properties file to instruct Sonar Scanner on the details of the project. Create the following file in the root directory of your project.
|
1 2 3 4 5 6 7 8 9 10 11 12 |
sonar-project.properties # must be unique in a given SonarQube instance sonar.projectKey=my:Sonar_C_Sharp # this is the name and version displayed in the SonarQube UI. sonar.projectName=SonarTestApp_C# sonar.projectVersion=1.0 # Path is relative to the sonar-project.properties file. Replace "\" by "/" on Windows. # Since SonarQube 4.2, this property is optional if sonar.modules is set. # If not set, SonarQube starts looking for source code from the directory containing # the sonar-project.properties file. sonar.sources=./src |
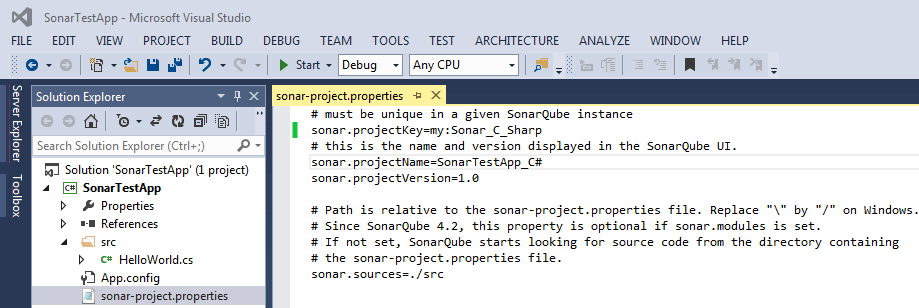
Figure 16: Sonar Project Properties File
Step 13: Open command prompt, navigate to the project root folder and initiate the scan by using the command sonar-scanner. You can see the analysis being performed and should get a success notification in about 30 to 40 seconds.
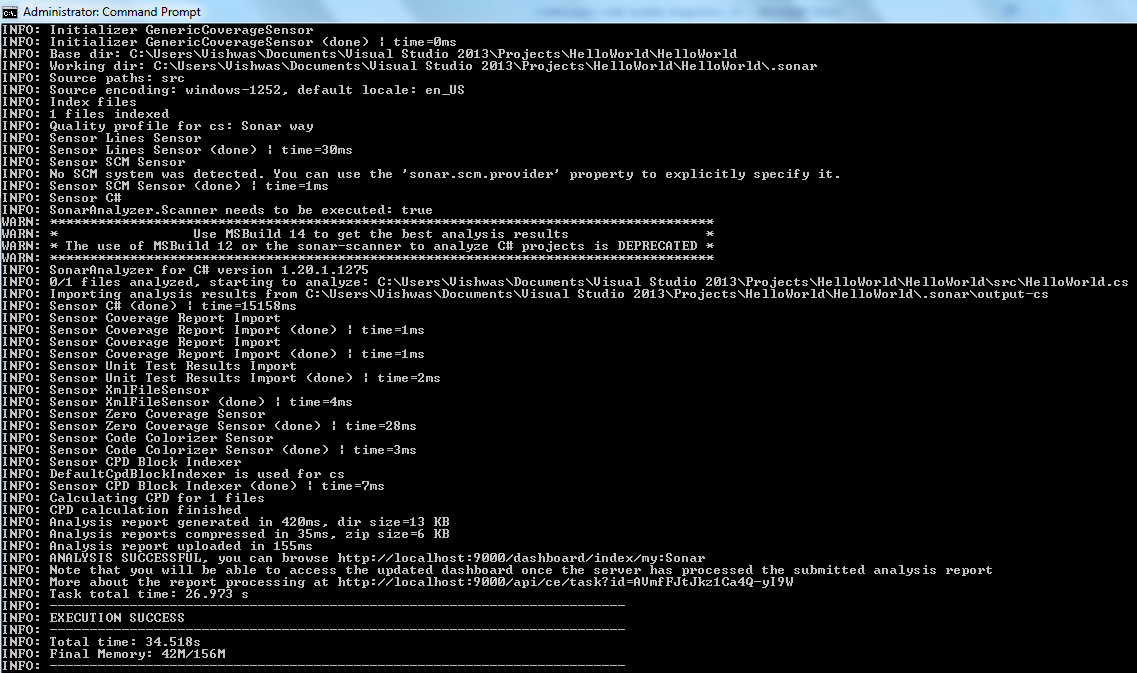
Figure 17: Sonar scan on HelloWorld.cs
Step 14: Let’s view the results in our SonarQube Server instance hosted at http://localhost:9000/. We should have details on this project added in the portal in addition to our previous example in Java
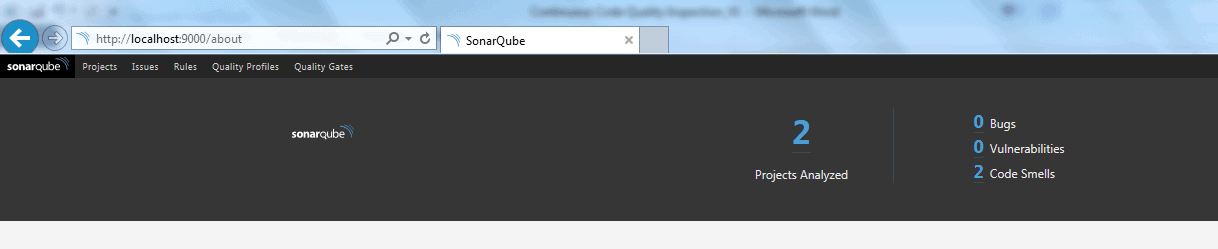
Figure 18: Sonar Portal showing two Projects including one from our previous example in Java
There are two code smells detected which can be further verified in detail by clicking on ‘Issues’ Tab and navigating to the HelloWorld.cs file.
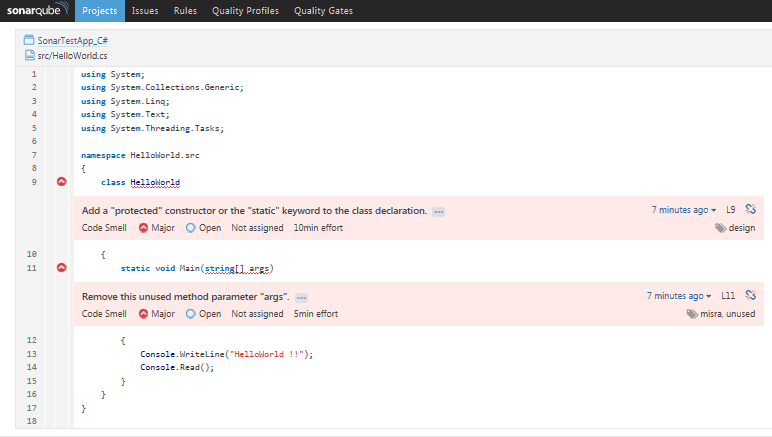
Figure 19: SonarQube Portal highlighting issues within a C# file
Let’s fix our code by implementing the suggested changes on design to protect the class and remove unused variables as shown below
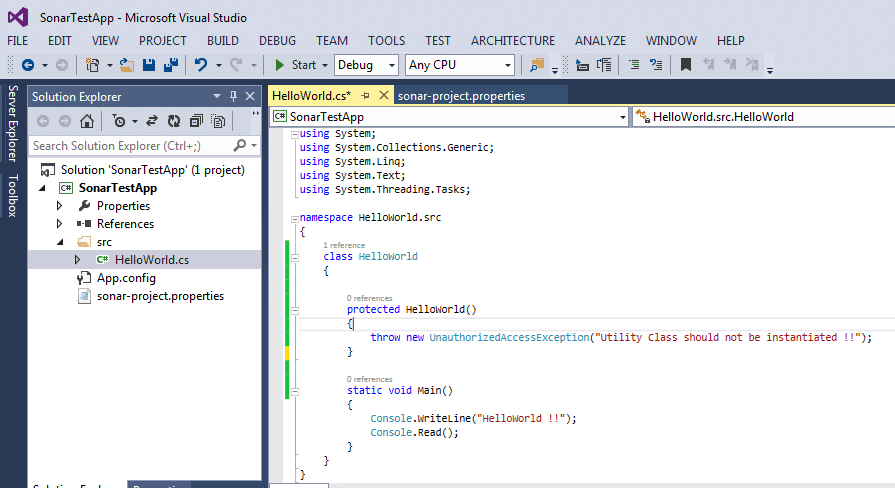
Figure 20: Fixed file with protected Constructor and removed the unused ‘args’ parameter from Main method
Step 15: Rerun the scan. You can see the analysis being performed and should get a success notification in about 30 to 40 seconds.
View the results in our SonarQube Server instance hosted at http://localhost:9000/
As you can see from this screenshot below, we have a clean bill of health for both of our projects!
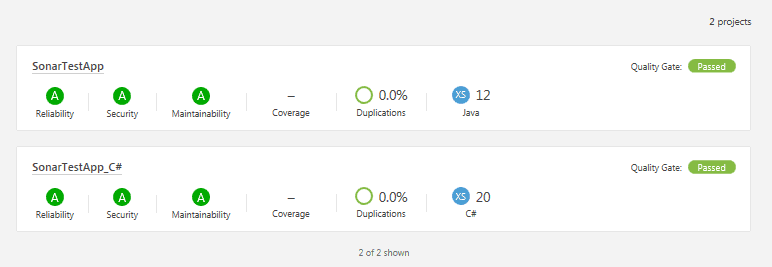
Figure 21: SonarQube Portal re-scan report for our Java and C# Projects
Incorporating Plugins
SonarQube provides wide array of plugin support to cover various aspects such as Governance, Reporting, Source control Engines, Localization, Authentication, Authorization etc. A full list of plugins are listed here.
There are two ways to install the Plugins
- Automatic
-
Login to the SonarQube Portal
http://localhost:9000as an Administrator. Default Credentials as admin/admin - Navigate to Administration > System > Update Center
- Click on the ‘Available’ Tab to see the list of plugins.
- Choose your plugin and click on install
-
Login to the SonarQube Portal
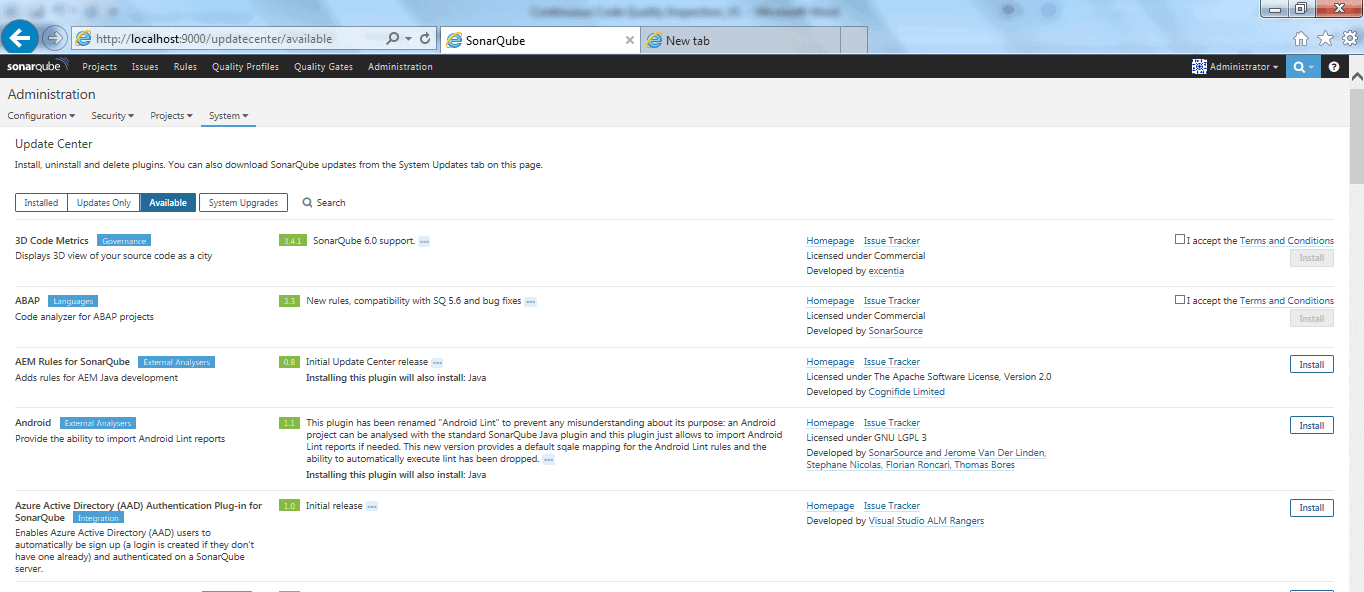
Figure 22: SonarQube Plugin Installation Module
- Manual – For any reason you cannot go through Step 1, Follow instructions below to manually install the plugin
- Lookup your plugins from the library https://docs.sonarqube.org/display/PLUG/Plugin+Library
- Navigate to the plugin project page and click on the “Download” link of the version compatible with your SonarQube version.
- Upload the downloaded jar file in your SonarQube Server and put it in the directory $SONARQUBE_HOME/extensions/plugins. In our case it would be C:\sonarqube\sonarqube-6.2\extensions\plugins
- Restart your SonarQube Server
- If you have downloaded a Commercial Plugin, you need a License Key before using it. Go to Administration > Configuration > Licenses and click on the Update button to set the license Key and Save
Conclusion
SonarQube allows us to have a constant quality inspection of code quality across various quality factors such as Architecture and Design, semantics, bugs, security, duplications, unit tests, cyclomatic complexity etc. Because it has support for over 20+ programming languages, it is versatile for any development team that utilizes various common technology stacks to build their software. Its extended plugin center can be used to incorporate plugins for missing languages such as TechCognia’s TSQL Plugin or enables you to write your own language-specific rules via regular expressions using the sonar-text-plugin. Its integration with IDEs such as Eclipse and Visual Studio that can use SolarLint provides on-the-fly feedback to developers on new bugs and quality issues that have been introduced in the code. Furthermore, its seamless integration with JIRA, LDAP, SSO and continuous delivery environments such as Jenkins unlocks a whole new potential for agile teams and ensures that every build goes through the Sonar quality gate inspection much like in manufacturing where products go through an inspection routine!
References
- https://en.wikipedia.org/wiki/DevOps
- https://en.wikipedia.org/wiki/List_of_tools_for_static_code_analysis
- https://en.wikipedia.org/wiki/SonarQube
- https://www.sonarqube.org/
- https://blog.sonarsource.com/
- http://www.sonarlint.org
- http://docs.sonarqube.org/display/PLUG/Plugin+Library
-
https://github.com/gjd6640/sonar-text-plugin
- http://www.techcognia.com/TSQL.aspx
Load comments