
Table of Contents:
– Types of Profiling
– When to Start Profiling
– Tools Used for Profiling
– What to Look For
– Production / Load Test Clues
– Managing Profiling Results
– Summary
If you talk to teams of developers about performance profiling, someone will usually say something like “we don’t have time to profile our code, that’s why we have load testers” or “if it runs slowly we just throw another server into the farm”. Many developers see performance profiling as an extra piece of work to add to their existing workload, and yet another steep learning curve to climb.
Many developers enter the world of performance and memory profiling only when something has gone badly wrong. This usually means during system testing, load testing and often (sadly) in production. Developers will download an evaluation copy of a profiler and try to isolate why the application is running slowly or keeps crashing. The pressure is on, and it’s now the worst possible time to learn the skills required to be an effective application profiler.
Using profiling tools to look for potential bottlenecks during development can significantly reduce the number of problems that show up later. With the right tools and training, it can become a regular part of the development process without adding too much overhead.
Development profiling will never uncover all of the issues that a comprehensive load test would, but it can highlight parts of the code that have the potential to become a bottleneck when the application is stressed. Finding and fixing them early can make a big difference overall, especially if all the developers are testing the code they write.
If you want more detail, chapters 7, 8 & 9 in “The Complete Guide…” are all about the tools and techniques that you can quickly master and then use as part of your development process. Remember, it costs between 15 and 75 times more to find and fix an issue found during test than if that same issue was found during development (Boehm, 1981).
Types of Profiling
Application profiling goes beyond the raw performance statistics obtained from system performance monitoring tools, and looks directly at the functions and allocated objects inside the executing application.
When profiling a .NET application, the execution speeds of its internal functions and the resources they use are recorded for a specific set of test transactions. The recorded data will give insight into where there may be performance bottlenecks and possible memory problems (such as memory leaks). Profilers retrieve performance and memory information from .NET applications in one of three ways:
- Sample Based
The application function call stack is periodically recorded to give a low overhead but equally low resolution analysis. - Events based
The Common Language Runtime can be configured to send notifications to specific profiler DLLs. Key information on function execution, CPU, memory and garbage collection can be collected using this mechanism. - Instrumentation
Instrumentation code that measures the application is added to it at runtime, which can give very detailed and accurate results but also comes with a high overhead.
A Word about Profiler Overhead
Whichever profiler you use will add some overhead to the executing application it’s measuring, and to the machine it is running on. The amount of overhead depends on the type of profiler.
In the case of a performance profiler, the act of measurement may itself impact the performance being measured. This is particularly true for an instrumenting profiler, which has to modify the application binary to insert its own timing probes to every function. As a result there is more code to execute, requiring additional CPU and memory, causing increased overhead. Most profilers try to compensate by deducting the overhead of the instrumentation from the results.
The profiler also has to deal with the torrent of data it receives, and for a detailed analysis it may require a lot of memory and processor time just to cope.
If your application is already memory and processor intensive, things are unfortunately only going to get worse, and it could be that it’s just not possible to analyse the entire application. Thankfully, most tools allow you to limit the scope and depth of the analysis, which can help. In some situations, the only way to get results may be by writing test harnesses to exercise portions of the application in ways analogous to the full application.
Performance Profiling
Performance profiling is all about discovering which parts of your application consume a disproportionate amount of time or system resource. For example, if a single function takes up 80% of the execution time, it’s usually worth investigating.
Profiling will highlight small areas of code that would never otherwise be looked at again, and it makes developers ask some interesting questions. To be fair, most of the time the answer will be “It has to do that and that’s as fast as we can make it.” The rest of the time a potential bottleneck will have been uncovered.
What to Profile
Profiling a multi-layered networked application can be really difficult simply because of the number of possible variables involved. The question that’s difficult to answer is “Which bit is slow?”. Is it the client, the web server, the application server, the database server or even one of the network links in between?.
The first stage in profiling performance is to identify the “slow bit”. Application server monitoring can help isolate the guilty layer, and will often help you determine if it is an application or a database problem. Sometimes the problem is even more complex, and a network monitoring tool will be required. These tools analyze packet journey times between the layers, and break down application transactions into server processing time and network time. They can help identify the layer responsible for slow-down and determine if the problem is to do with a network issue, such as congestion, bandwidth or latency etc. Chapter 6 discusses this topic in more detail.
Once you have identified the layer responsible (or if you like, the “slow bit”) that will give a clue as to the kind of profiler to use. Obviously, if it’s a database problem then use one of the profiling tools available for the database vendor, or just add another index (just kidding!). If it’s a .NET application problem, then there are a whole host of profilers available and we discuss some of the best ones in the following chapters of the book.
Function Analysis
To measure the performance of an application, you need to know how long specific test transactions take to execute. You then need to be able to break those results down in a number of ways. Specifically:
- Function call
- Function call tree (the sequence of calls created when one function calls another etc).
This breakdown identifies the slowest function and the slowest execution path, which is useful because a single function could be slow, or a set of functions called together could be slow. Many tools create elaborate hierarchical diagrams which allow the developer to explore the call trees, and this can really help when trying to identify a bottleneck.
Line Level Analysis
Profilers can accurately time individual code lines, allowing you to identify the slowest line within a slow function. For me, this is an essential feature because it gives you the best chance of coming up with workable optimizations.
However, line level analysis does add a greater overhead to the profiling session and can normally be switched off, leaving the profiler to analyze at the function level only.
Wall Clock (Elapsed) vs. CPU Time
Most profilers measure “Wall clock time” and “CPU time”. The ability to distinguish between the two is important because CPU time is pure processing and excludes any waiting time. By contrast, “Wall Clock Time” is the total time taken to process a function, including any wait time.
A function may take a long time to execute, but use comparatively little CPU time because it is actually waiting for a database/web service call to return or for a thread synchronization lock to free up. Identifying wait time can help you identify where your application may benefit from asynchronous processing.
At the same time, a CPU-intensive function is usually a good candidate for optimization, because the CPU is a finite resource and a potential bottleneck.
Resource Bottlenecks
Resources such as disk space, network bandwidth, server availability, graphics cards and shared threads call all create bottlenecks in an application. Identifying functions causing high levels of resource activity and contention is a key goal in profiling. This kind of activity, when scaled, could quickly become a problem and reduce the scalability of the application.
Call Count
Function Call Count is the easiest statistic to look at first, because a non-trivial function with a high call count often indicates an immediate problem. It’s always worth validating the origins of the high call count.
Small Optimizations Add Up and Scale
The great thing about performance profiling an application during development is that a developer can immediately see where the main processing hotspots / bottlenecks in the code are. Optimizing the hotspots and asking intelligent questions about call counts can give small but significant improvements in performance, and if the whole team adopts this strategy, the gain can be significant.
With so much code executing on servers, small performances gain become significant because they quickly scale according to the number of user and the number a locations they affect. More to the point, identifying and eliminating potential bottlenecks will prevent them from ever becoming problems during load testing or in production.
Memory Profiling
The way you write your code directly impacts how and when the objects you create are allocated and destroyed. Get it right, and your application will use memory efficiently as needed, with minimal performance impact. Get it wrong, however, and your application could use more memory than necessary, which will cause the memory manager to work harder than it needs to, which will directly impact performance.
Even worse than that, your application could just keep allocating memory until no more is left, causing the application or the machine to crash. This is the “Memory Leak” every developer fears.
The good news is that there are plenty of tools out there which you can use to find and fix memory problems before they actually become problems. All you need is some background knowledge and a few basic techniques, and it will become second nature.
Checking that an application doesn’t have memory leaks and efficiently uses memory, together with fixing any issues found, will improve its overall stability and performance.
Garbage Collection
The .NET Memory management model ensures any allocated objects that are no longer in use by the application will be reclaimed automatically. This relieves developers of the responsibility of having to free memory explicitly, which is something that was often omitted in native C/C++ applications, leading to memory leaks.
Garbage collection was invented by John McCarthy et al in 1959 as part of the Lisp language, but gained most prominence when it was adopted as the memory management model for Java in 1995.
Instead of depending on the developer to manually de-allocate objects, garbage collection adopts an automatic model in which objects are monitored to determine if they are still in use. Those no longer used will have their memory reclaimed automatically. The automatic memory management model, of which garbage collection is a part, was adopted by Microsoft as the model for .NET. I will cover .NET’s memory management model and how it works in detail in Chapter 7, but for now here is a brief overview.
The.NET CLR allocates objects (less than 85K) onto a managed memory heap, and ensures they are placed consecutively in memory with no gaps in between objects. The Garbage Collector then periodically determines which objects are still in use by looking to see if they are referenced by other objects, or from the stack, globals, statics or even CPU registers. If no references are found, it concludes that the object isn’t in use and can be ‘garbage collected’.
When an object is eventually garbage collected, it is simply overwritten by the objects above which are moved down in memory; a process known as compaction. This makes sure there are no gaps left in the heap. In truth, it’s actually a bit more complicated than this, as objects are grouped into generations depending on how recently they were allocated. (For performance reasons the garbage collector always tries to collect the youngest objects first).
Anything that keeps hold of a reference to an object will keep it alive indefinitely, and that can be the cause of a leak if it repeats continually. Memory profiling is all about finding suspiciously persistent objects and tracing back to find the references in code that are keeping them in memory.
Using memory profiling techniques and tools, you can identify large objects that cause the application to have a larger memory footprint than necessary. You can also look for objects that are continually created and never garbage collected, causing memory leaks. I’ll cover the Garbage Collector and associated concepts in much more detail in Chapter 8.
Profiler Approaches
All memory profilers will track instances of allocated classes. Some will also track the allocation call stack, which means that they can report on a function’s allocation profile and identify function “Hotspots”.
The ability to view allocations, both in terms of classes and functions, can be really useful. However, recording allocation call stacks can be very memory intensive and can sometimes limit the size and complexity of application that can be profiled.
Symptoms of Memory Problems
- Memory Leak
- Memory usage slowly increases over time
- Performance degrades
- Application will freeze/crash requiring a restart
- After restart its ok again, and the cycle repeats
- Excessive Memory Footprint
- Application is slow to load
- After load, other application runs slower than expected
- Inefficient allocation
- Application performance suddenly degrades and then recovers quickly
- % Time in GC Statistic in PerfMon is greater than 20-30%
I go through memory profiling in a lot more detail in the complete book.
When to Start Profiling
In my view, the answer to this question is profile when you feel you have achieved functional stability in your coding task. That means after you have completed the requirement and your testing confirms it works as specified. Profiling at this stage will highlight potential bottlenecks that should be investigated. Profile any earlier and you could be optimizing code that may significantly change.
Profiling usually occurs in one of three ways:
- Reactive Debugging
- Proactive Analysis
- Technique Validation
Reactive Debugging
Reactive debugging happens when a problem has been found, typically during a load test or in a live system, and the developers have to react to this unwelcome news and fix the problem.
With load test debugging, you have a lot more data to work with because the results will describe the failing transactions in fine detail and give many detailed server statistics, which will help in isolating exactly where the problems is.
Production debugging is much more difficult, because really all you will get is some performance monitoring statistics and, if you are lucky, some anecdotal evidence about what might have been running when the slowdown occurred.
If you carry out load testing late in the lifecycle or if it’s a production problem, a number of things now have to happen. Developers have to:
- Isolate the tests to run to reproduce the problem
- Understand how to use the profiler
- Interpret the results
- Get familiar with the code again
- Fix the code
- Confirm the fix
Production problems are inevitably accompanied by pressure from management to fix the issue. Developers are also usually caught off guard and are ill prepared for an in-depth analysis of a system they may have last worked with many months ago.
This is all just an inefficient waste of time and resource, and it doesn’t even include the time that would then be required for system testing in a production environment. The earlier you start your application profiling and load testing, the better. Which is why my general recommendations are:
Test your application transactions under load as soon as you can during development, and test regularly (as soon as you have something testable). Ensure issues are found and fixed early.
Encourage a culture where developers proactively look for potential bottlenecks in their code using profiling tools (see next section).
You don’t have to wait until the load test phase to begin load testing (although often the expense is too great to use these facilities too early). There are lots of tools out there that you can use to place stress/load on your application, and doing this as early as possible will highlight issues that single test profiling won’t find. If you can automate the stress testing and run it regularly so that any code changes that impact performance are picked up quickly.
Proactive Analysis
Proactive analysis, as the term implies, is all about the developer actively looking for performance and memory issues during the development cycle. It has the major advantage of being by far the quickest and cheapest type of analysis, because the developer already knows the code well and is able to quickly make knowledgeable optimization decisions.
Proactive Analysis takes place as part of the developer testing process, and should be an essential requirement before source code is checked back into the repository. It takes 15-75 times longer to fix an issue in development, than if it was found in later testing (Boehm, 1981).
The proactive approach does require an investment in tools and training, but it also results in more highly-skilled development teams who are actively looking for problems in applications, and who are empowered with the skills necessary to find and fix said problems when they occur.
Technique Validation
Profilers can really help developers choose the optimal algorithm to achieve a specific processing task. Questions such as, “Should I process it all on the server, or on the client in batches?” can be answered quickly and easily by running a few quick tests.
Finding the most efficient technique to process data can also be very difficult without a profiler. Searching online merely opens up a huge debate, and the only way to be sure is to write some test harnesses, and run a profile.
Tools Used for Profiling
Many of the available profiling tools combine both performance and memory profiling in one package. I will summarize the features of some of the main tools on the market, and in later chapters Il describe how to use them to carry out both performance and memory analysis.
CLR Profiler
The CLR Profiler is, at first glance, quite a basic memory profiling tool. On closer analysis it’s actually extremely powerful once you get the hang of it. Whilst it isn’t the most intuitive or easy-to-use profiler you will find, it is certainly very detailed and comprehensive in the information that can be retrieved.
It can profile applications up to and including .NET framework 3.5, although it only officially supports up to framework 2.0.
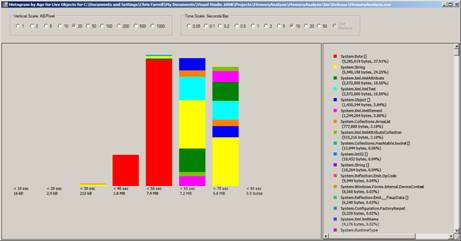
Figure 1: CLR Profiler Histogram by Age
CLR Profiler will monitor the executing application (Exes, services and web applications) and then provides a number of histograms and Call Graphs. These can be used to track memory leaks, excessive memory usage, Large Object heap issues and excessive garbage collection overhead; it’s also possible to analyze Finalizer issues.
Unfortunately, CLR Profiler is one of those tools most developers have downloaded and tried out, but given up on after about twenty minutes because it is quite difficult to use.
It’s a free to download tool and, once you have mastered its quirky interface and have adopted a technique that works for you, it’s possible to gain real insight into the memory state of the application.
CLR Profiler gets complicated really quickly and for that reason I will cover it in more detail in Chapter 7.
Red Gate’s ANTS Memory and Performance Profiler 5.0
Red Gate Software’s ANTS Developer Bundle 5.0 works with .NET framework 1.1, 2.0, 3.0, 3.5, integrates into Visual Studio 2005, 2008 and 2010 at March 2010 release, and it supports both 32bit and 64bit profiling.
The ANTS bundle contains both a Memory and Performance Profiler and, at the time of writing, costs £495 for a single user license (Redgate, 2009).
Memory Profiler
The ANTS Memory Profiler (Figure 1 ) captures class instance allocation and has a low overall overhead. It provides an easy-to-use and flexible user interface
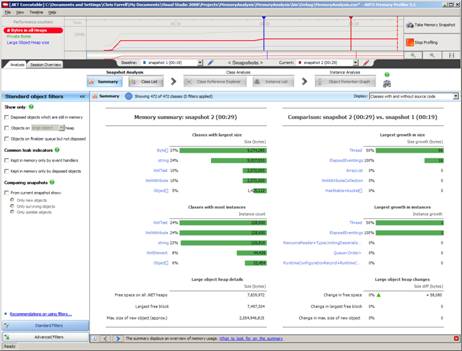
Figure 2: ANTS Memory Profiler
ANTS also provides graphical insight into the heap with the memory timeline, which is a graphical representation of various performance counters including bytes on all heaps, private bytes and large object heap size (other counters can be added in the options). The primary technique for using this tool involves the developer taking memory snapshots at relevant times. Snapshots can then be compared against each other and used to find classes requiring further investigation.
Filters allow the developer to filter out application noise and focus in on specific problems. Application noise refers to any object allocations that are irrelevant to our analysis but whose presence on the heap we may misinterpret. There are standard filters to eliminate general application noise, and specific filters that can be used to find common causes of memory leaks.
Once a set of suspicious class instances has been identified, the Class Reference Explorer allows the developer to trace back into the tree of object references to find the exact references in the code which are causing the problem.
It’s also possible to view a session overview of the snapshot, which gives insight into the state of both the Small Object Heap (including Gen 1 and 2) and the Large Object Heap.
Performance Profiler
When performance profiling an application, ANTS Performance Profiler (Figure 2 ) presents a performance graph with % Processor time, plus a number of other performance counters which can be selected. Results can be viewed for the entire analysis or for just a small portion using the trace graph and selecting and area of interest using the mouse Figure 3 .
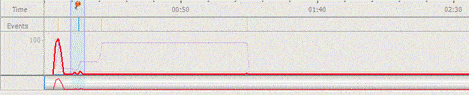
Figure 3 : Selecting a portion of the analysis trace
This can be really useful if you notice part of your trace for example with high CPU activity and allows you to focus on what was happening just for that tightly defined period. The profile results for the trace can be viewed in Call Tree, Grid or Call graph modes.
The Call Tree displays a hierarchical list of the slowest call trees for each execution path in the selected period, and highlights the path that is most likely to be the bottleneck as the “hottest”.
The Grid displays the results in a classic grid format, giving:
- Time (CPU or Wall Clock)
- Time With Children(CPU or Wall Clock)
- Hit Count (Number of times called)
A call graph can also be generated for every function, allowing the sequence of calls to and from a function to be traced.
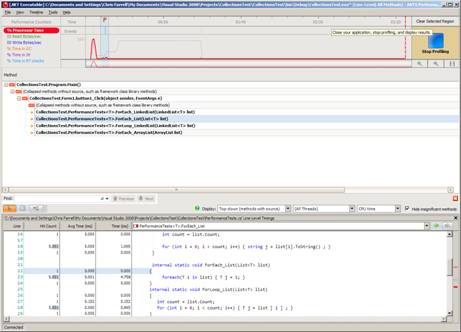
Figure 4: ANTS Performance Profiler
Performance results can be viewed by CPU time or Wall Clock Time, which is a useful feature as it can help to quickly identify where the application may benefit from asynchronous processing.
ANTS also provides a number of analysis modes which change the amount of overhead that is added to the executing application:
- Method Level – Lower overhead but less detailed
- Line Level – Higher overhead, more detailed
It is also possible to further reduce the overhead of both modes by selecting to only profile methods that have source code. That is often the most sensible course of action, seeing as you can only optimize where you have source code to change.
Microfocus DevPartner Studio Professional 9.1
MicroFocus’s DevPartner 9 is a suite of tools for .NET framework 2.0, 3.0 and 3.5 and Visual Studio 2005 and 2008. It supports 32bit profiling on both x86 and x64 systems, and includes:
DevPartner pricing depends on the licensing model, but if you are buying from ComponentSource a single user standalone license is $2,885.46 (£1,758.00) (ComponentSource.com, 2009)
- Memory Profiler
- Memory Leak Detection
- RAM Footprint Analysis
- Temporary Object Analysis
- Performance Profiler
- Timing
- Resources (CPU, Disk, Network)
- Code Coverage Analyzer
- Code Review Tool
It is a developer tool that integrates into Visual Studio 2005 and 2008, and can optionally also be run from the command line.
Memory Profiler
The Memory Profiler (Figure 3 ) can perform three types of analysis:
- RAM Footprint Analysis
- Memory Leak Detection
- Temporary Object Analysis
DevPartner captures both the class instance allocation and the allocation call stack, so it’s possible to view the results in terms of Class Hotspots and Functions Hotspots.
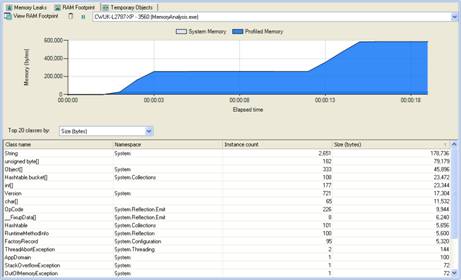
Figure 5 : DevPartner Memory Analysis
RAM Footprint
RAM Footprint looks at both the largest allocated objects and the methods and call trees responsible for allocating large amounts of memory. With these types of analysis it is possible to identify parts of the application that are causing it’s overall memory footprint to be larger than maybe necessary. This often occurs when an application loads data and keeps it cached in memory for later use.
Temporary Object Analysis
Temporary Object Analysis looks at allocation of relatively short lived objects. These are objects that manage to stay around long enough to survive a couple of garbage collections, but then lose their references and become available for collection. These types of objects make full garbage collections run more frequently, which is inefficient. Having insight into where temporary objects are allocated can held a developer reduce object longevity and improve overall memory usage and performance.
Memory Leak Detection
The memory leak detection tool allows the developer to navigate through the application until they get to the point where they want to start tracking the leak. At that point, they press a button and all objects allocated from that point are recorded. When the developer has finished their test, they press a ‘View Memory Leaks’ button, and the tool forces a full garbage collection before presenting the results of all of the classes allocated since tracking began which survived collection.
The results can be viewed by Class/Object Instance and also by Function, as the call stack for each allocation is also recorded.
Performance Profiler
There are two separate performance profilers in DevPartner; one for function Timing analysis the other called Performance Expert for function resource analysis, looking at the CPU, Disk and Network activity.
The timing analyser can profile both managed and native instrumented applications, though the Resource Analyser is a pure .NET tool only.
Performance Timing Analysis
The Timing Analyzer (Figure 4 ) can profile at the function and the code line level. It’s also possible to profile both managed and native code at the same time, although the native code must be built with instrumentation.
Running a test is a simple matter of starting the application using the DevPartner Integration toolbar button within Visual Studio.
![]()
Figure 6 : DevPartner Toolbar Buttons
A couple of further buttons will appear on the toolbar, which will allow you to take performance snapshots, and the application will start.
The snapshots results are displayed within Visual Studio in a standard grid, which can be sorted and filtered. It’s also possible to reduce the scope of results by selecting to only view specific source or system modules. The main statistics provided per-function (see Figure 7 ) include:
- Called (number of times the function was called)
- % in Method (% of Time spent in function excluding time spent in calls to non framework functions)
- % with Children (% of Time spent in function including time spent in calls to non framework functions)
- Average Time (Total Time in Function/Number of calls)
The user can view the source for each function listed, giving them a timed line-by-line breakdown of the source code. Alternatively, it’s possible to view the call tree for the function, and from here you can track backwards or forwards through the call tree to investigate the function’s critical path (more on this later).
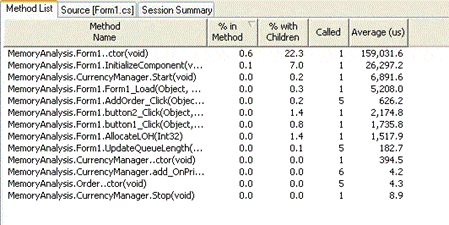
Figure 7 : DevPartner Performance Analysis
Performance Expert Analysis
As with Performance Analysis, Performance Expert (Figure 5 ) is started from within Visual Studio and additional buttons appear which allow you to take performance snapshots. This time, the application is being measured for CPU, Disk, Network activity and Wait time, which are all potential bottlenecks.
When a snapshot is taken, the most CPU intensive execution paths and functions are displayed, and various forms of analysis are available. Execution path analysis allows you to perform a call graph analysis on the execution path. The functions analysis displays a grid of resource statistics for each function, allowing you to sort by each column. From this view, you can quickly determine the most CPU / disk etc. intensive functions.
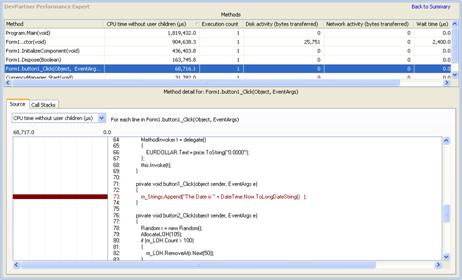
Figure 5 : DevPartner Performance Expert Analysis
Other Tools
In addition to the profiling tools, DevPartner also has:
- Code review Tool
Code Quality, Standards, Security Analysis - Code Coverage Analyzer
Determines how much of an application has been tested and what hasn’t been
Microsoft Visual Studio 2008 Profiling Tools
Visual Studio 2008 Team Edition has a built-in performance and memory profiler, and you can choose to use either sampling or instrumentation methodologies. As well as the usual performance timing and memory allocation information, it is also possible to collect additional CPU counters, Windows events and Windows counters with these tools.
A profile report can be produced at any time, at which point a summary report is displayed from where you can drill into the data or select more detailed reports from a drop down list. The report view provides a filter mechanism which allows for the creation of sophisticated queries on the available data. It’s also possible to compare reports, which is useful to check that an optimization has been successful, for example.
Performance Explorer
Visual Studio’s profiler settings have a lot of options available, and so multiple performance analysis configurations can be set up for the same application in a Performance Explorer window. You may, for example, have separate configurations for Sampling and Instrumentation, and for Memory and Performance profiling. All of the reports for each configuration are stored together.
Performance Analyzer
On completion of a test, the performance analyzer will give a summary of worst functions as well as reports on the following:
- Most Called Functions
- Functions with the Most Individual Work
- Functions Taking the Longest
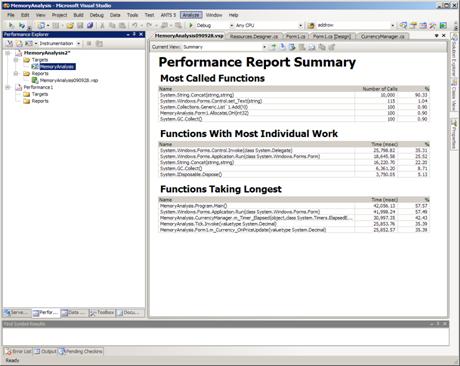
Figure 8: Visual Studio 2008 Performance Profiler
From here, you can choose a function from the list and view its callers, child calls or view the source, if available. The profiler works well at the function level, but only has a crude reporting mechanism to give code-line level statistics. The next version of Visual Studio 2010 will address this issue giving full line level timings and source code visibility. Many other reports can be selected, including a Function Grid to determine the slowest functions, and a Call Tree to identify the slowest execution paths. It is possible using a combination of the reports to find function bottlenecks, which is naturally a good starting point to being able to correct these issues.
Memory Analyzer
To carry out a memory analysis you need to make sure that the Performance Explorer configuration you are using has the following .NET memory profiling options set. See Figure 8 .
- Collect .NET Object Allocation
- Helps identify expensive allocated classes and functions
- Also Collect .NET object lifetime
- Memory leaks
- Mid life crisis detection
- Large Object Heap Issues
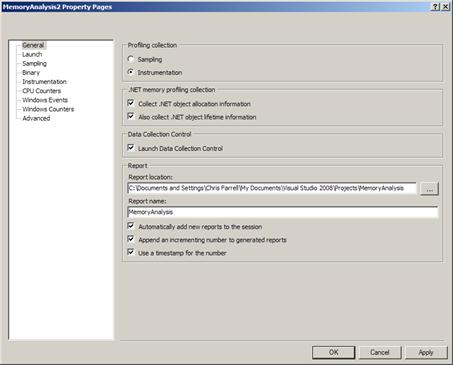
Figure 8 : Visual Studio 2008 Memory Analysis Configuration
The application can now be launched from within the Performance Explorer window.
- Run your test transaction
- Either press the Stop button on the Performance Explorer toolbar or close your application
The memory analyzer reports on:
- Functions allocating the most memory
- Types with the most memory allocated
- Types with the most instances
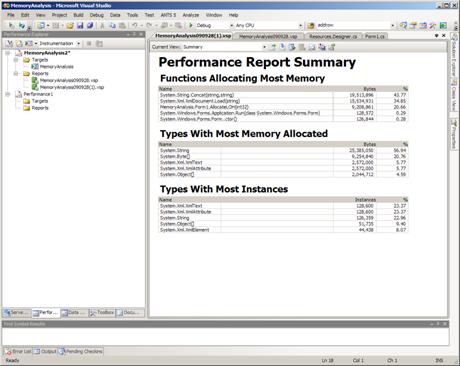
Figure 9: Visual Studio 2008 Memory Analysis
From the summary, you can view reports that detail:
- Object Allocation (Largest allocated classes and the methods that allocated them)
- Object Lifetime (when objects are de-allocated)
- Call Tree (Most memory expensive function call trees)
What to Look For
Let’s now briefly look at some of the main types of problems that can be uncovered using the tools described above. As this chapter is just an introduction to the noble art of profiling, all of the techniques mentioned will be described in more detailed in subsequent chapters.
Performance Analysis
The following key indicators can be used to identify potential bottlenecks and problems in your code. We will cover performance profiling in Chapter 6.
High Call Count
Functions with very high call counts should be treated with suspicion and investigated. Often the high call count is valid, but sometimes it’s due to an error in event handling and can be a major source of unintended processing.
Resolution
Using the call graphing facility of your performance tool, it should be possible to trace back to where the calls to the function originate and decide if it is acceptable behaviour. It’s a very quick and easy check, and a very quick optimization if a problem is found.
I have actually lost count of the number of times I have found this issue in live code!
Slowest Function Excluding Child Calls
This is the slowest function where the body of the function itself is responsible for the time. It includes time spent calling .NET framework functions, but excludes time spent calling other source code functions. In other words, it’s answering the question “What’s the slowest function we have written?”
Resolution
Identify the slowest functions excluding child calls and then, if available, look for the slowest code lines and determine if they are optimizable. You will often see slow lines waiting for database and web service calls to return.
Slowest function Including Child Calls
This is the slowest function where the total cost of the functions, including time spent into calls to child functions (we have written), is accounted for.
Resolution
Use your tool’s Call Graph facility to explore the slowest part of the call tree.
Functions with High CPU Utilization
Any function with high CPU utilization is a prime candidate for optimization, as high resource demands can be a key bottleneck.
Resolution
Identify the most CPU intensive lines of code within the function and determine if there are workable optimizations that may apply.
Functions with Wait Time
Functions with wait time can indicate performance problems in other application layers, or problems with thread locking (I’ll discuss thread locking in Chapter 7, where it’ll be more relevant).
Resolution
Identify which resource the function is waiting for, e.g. database, web service then investigate the cause of the contention on that layer.
Functions Generating Disk Activity
A function generating disk activity needs to be investigated further, as it is demanding resources and so is a potential bottleneck.
Resolution
Make sure the disk activity is necessary particularly if this is a server application. Even if it is necessary try to find and alternative if possible.
Functions Generating Network Activity
A function generating network activity needs to be investigated further as another potential bottleneck.
Resolution
Make sure the network activity is valid and not an artefact left behind from prototyping or developer testing. Ensure the number of time this network activity occurs is as low as possible to reduce any the effect of latency. If possible get more data in one hit.
Memory Analysis
When and where you create objects in your code has far reaching consequences for the application as a whole. Allocating too early and for too long will increase the application’s memory footprint. Leave references to objects in collections or from event listeners for example and they will stay in memory indefinitely.
We’re going to look at Memory Analysis in a lot more detail in Chapter 7 but for now let’s look at some of the key types of analysis that can help improve your application’s memory profile.
Memory Leak Detection
Finding memory leaks is all about identifying objects that are allocated but never garbage collected. Memory leaks always get worse so, in theory, the longer the application runs, the bigger the leak will get, and the easier it will be to see. That doesn’t really help when profiling though, because you need to be able to identify a leak quickly.
Profiling tools help leak detection by allowing you to take memory snapshots. A snapshot usually involves forcing a garbage collection and then recording all of the objects that are left behind in memory. Objects that repeatedly survive garbage collection should be investigated further.
If objects of the same type continually survive garbage collection and keep building up in memory, you need to investigate the references that are keeping those objects in memory. Tracking object references back to source code allows you to find the cause of the leak in your own code, which means you can fix it.
Some profilers track memory allocation by function calls, which allows you to see the functions that are potentially leaking memory, which can also be a highly effective technique for finding a memory leak.
Excessive Memory Usage
Reducing the overall memory footprint can help an application coexist with other applications on the desktop or server. It’s always worth checking where your application is allocating and retaining large chunks of memory, just to ensure that this behaviour really is necessary. Often it’s done for performance reasons and is perfectly valid, as the memory overhead is worth the performance gain. Unfortunately, I have analyzed many applications where large amounts of data is held but then never used again, and this is the kind of behaviour you need to be on the lookout for.
Inefficient Allocation and Retention
Certain programming techniques, such as string concatenation for example, can create large numbers of intermediate objects on the heap, which makes the garbage collector work harder than it needs to. The harder the garbage collector works, the greater the performance impact on the application.
Detecting when your application is allocating inefficiently will allow you correct the issue.
Large Object Heap Fragmentation
The large object heap is used to store objects that are greater than 85K in size. The trouble is, it can become fragmented, which can lead to the heap size expanding to larger than it needs to be. In severe cases, this can eventually lead to ‘out of memory’ issues. See Chapter 7 from more detail on this.
Production / Load Test Clues
Problems uncovered during load test or in production will usually be accompanied by a wide variety of performance metrics collected from multiple servers. I have included some of the most useful statistics that are widely regarded as key indicators of performance issues (Meier, Vasireddy, Babbar, Mariani, Mackman, & Microsoft, 2004). They are, at the very least, a starting point, and will help you identify where to begin your analysis and which tools to employ. You can find this article over at MSDN.
General Performance Counters
The following performance counters can act as general guidelines for different performance problems. Please refer to the previous chapter in the book for a more detailed breakdown.
- Processor\% Processor Time
- Memory\% Committed Bytes in Use
- PhysicalDisk\%Idle Time
- Network Interface\Output Queue Length
- .NET CLR Memory\% Time in GC
- .NET CLR Memory\# Gen 0,1,2 Collections
- .NET CLR Memory\# of Pinned Objects
- .NET CLR Memory\Large Object Heap Size
- .NET CLR LocksAndThreads\Contention Rate/sec
- ASP.NET \Requests Queued
- ASP.NET \Requests Rejected
Managing Profiling Results
Each of the profiling tools store the profile data in a proprietary flat file format, although some of the tools allow the data to be exported to XML, CSV files.
The main benefit to XML or CSV export is that you can use the data to generate your own reports and publish that data to other systems. This become mores important when you begin automating your unit testing because you can also analyze the executing tests using a profiler. Instead of just getting pass and fail for your tests you could also collect performance and stability metrics. By comparing these metrics with previous test runs it’s then possible to identify problems as they occur.
Comparing Analysis Runs
Tools such as Visual Studio 2008 Profiler and DevPartner Professional have tools which allow various profiling results to be compared. This feature can help to quickly identify where there has been a performance improvement or degradation.
Pre Check-In Requirements
In support of Pro Active analysis, it’s a good idea to require developers to include evidence of performance and memory analysis results as part of a source code check-in procedure at the end of a unit of work.
This could be as simple as a manual procedure in which all of the profiler results files are zipped together and added (suitably labelled) to the project office. Alternatively the source control system itself could be used to define a pre check-in process requiring the addition of profile results files. This largely depends on how extensible the source control system is. Microsoft Team Foundation Server 2005, 2008 allows custom check in policies to be defined allowing more complex check-in procedures.
Continuous Integrated Testing
Tools which support command line execution and XML export can be incorporated into an automated testing framework, in which the automated tests are run and the executing process is profiled using performance or memory analysis. The results are then extracted to XML and uploaded to a results server, along with the results for the control cases.
To make life even easier, an automated testing framework can be set up to identify when the performance of a test transaction has degraded, and report it to the development team.
Summary
Knowing how to profile an application and understanding what the potential issues are will help you write better code. Routinely testing the functionality you have written using a profiler, and looking for the common bottlenecks and problems will allow you to find and fix many minor issues that would otherwise become bigger problems later on.
Load testing as early as possible during development, as well as adding to and running these tests regularly with the latest builds, will identify problems almost as soon as they occur. It will also highlight when a change has introduced a problem.
In the next two chapters of “The Complete Guide…”I go through the performance and memory issues you might encounter, and techniques you can use to deal with them, and highlight how to use some of the most common tools to find and fix problems in your code.
‘The Complete Guide to .NET Performance Testing and Optimization’ is available as a free eBook download here.
This document contains proprietary information and is protected by copyright law.
Copyright © 2026 Red Gate Software Limited. All rights reserved
Load comments