
Recently, it came time to refactor and improve the code that manages our online product licensing at Redgate. This code handles requests to activate products, when users enter their serial number, as well as various other licensing tasks, such as deactivating a license on one machine so that it can be reused on a different one.
In its original form, the code performed database access using LINQ to SQL, which was embedded in a variety of classes. Whenever a class needed to access the database, it created a database context and used LINQ to SQL to construct an appropriate query. While the queries were usually reasonably efficient, it made our eventual goal of modifying the database difficult, as database access was performed in many places and mixed in with business logic.
Therefore, alongside refactoring the code, we also decided to separate database access from business logic, and standardise on Entity Framework. This library is under active development and recommended by Microsoft for new projects, whereas LINQ to SQL is no longer seeing significant investment. We extracted the database access logic into repository classes and converted it to use Entity Framework, adding new unit and integration tests where appropriate. After doing this, we put the refactored code to test in real-world scenarios, performing both automated testing using recorded data and manual testing of key processes. We didn’t anticipate a significant risk of performance-related problems, and so hadn’t explicitly called those out in our testing strategy.
Discovering a performance issue
Unfortunately, both the automated and the manual tests surfaced noticeable and unexpected performance issues which would need to be resolved before we could deploy the new code to our production systems. Fortunately we discovered the problems as a side-effect of our other tests and were able to do something about them. Had we included performance testing as an explicit step in our test plan, we might have discovered them more quickly.
The first of these issues was discovered by a tester trying out the deactivation process. Deactivation responses were taking so long to come back that the client was timing out waiting for a response. While we suspected that our live infrastructure would be faster than the test machines, we certainly didn’t want to count on this. It would certainly be unacceptable for deactivation requests to start timing out, and we should minimize the time that they take in any case – that’s probably time that someone is sitting watching a “Please wait” dialog.
Investigating the problem through profiling
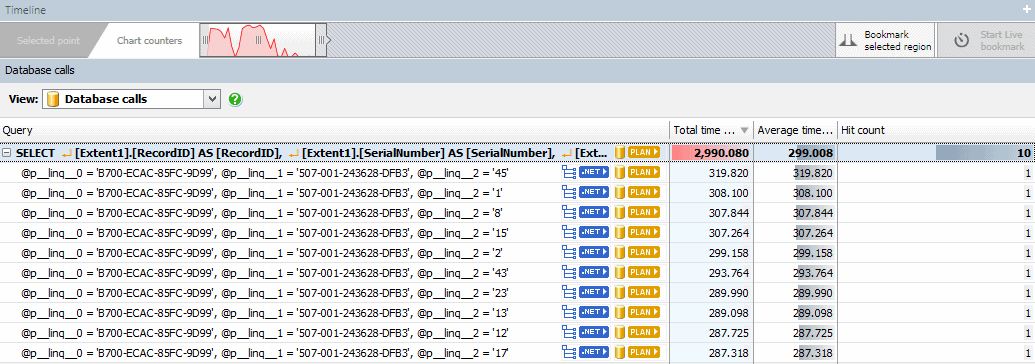
To investigate this problem, we turned to ANTS Performance Profiler 9. The server that processes deactivation requests is an IIS ASP.NET application, so we were able to use ANTS Performance Profiler to run the server locally and record performance data about both the .NET code and the generated SQL. Because we suspected that the Entity Framework refactoring was at fault, we switched to the Database Calls view and observed that what should be a fast SELECT statement, run once for each of the 10 products in the bundle being deactivated, was taking an unexpectedly long amount of time:
With each of these SELECTs taking an average of 299 milliseconds to start returning data, running ten of them was consuming almost three seconds – and this was only part of the process required to deactivate a serial number. This shouldn’t be taking so long: while the table that the SELECTs operate on does contain millions of rows, the query is simple, and it should be possible to utilise the existing indexes to perform this lookup efficiently. The old LINQ to SQL code didn’t have this problem, either.
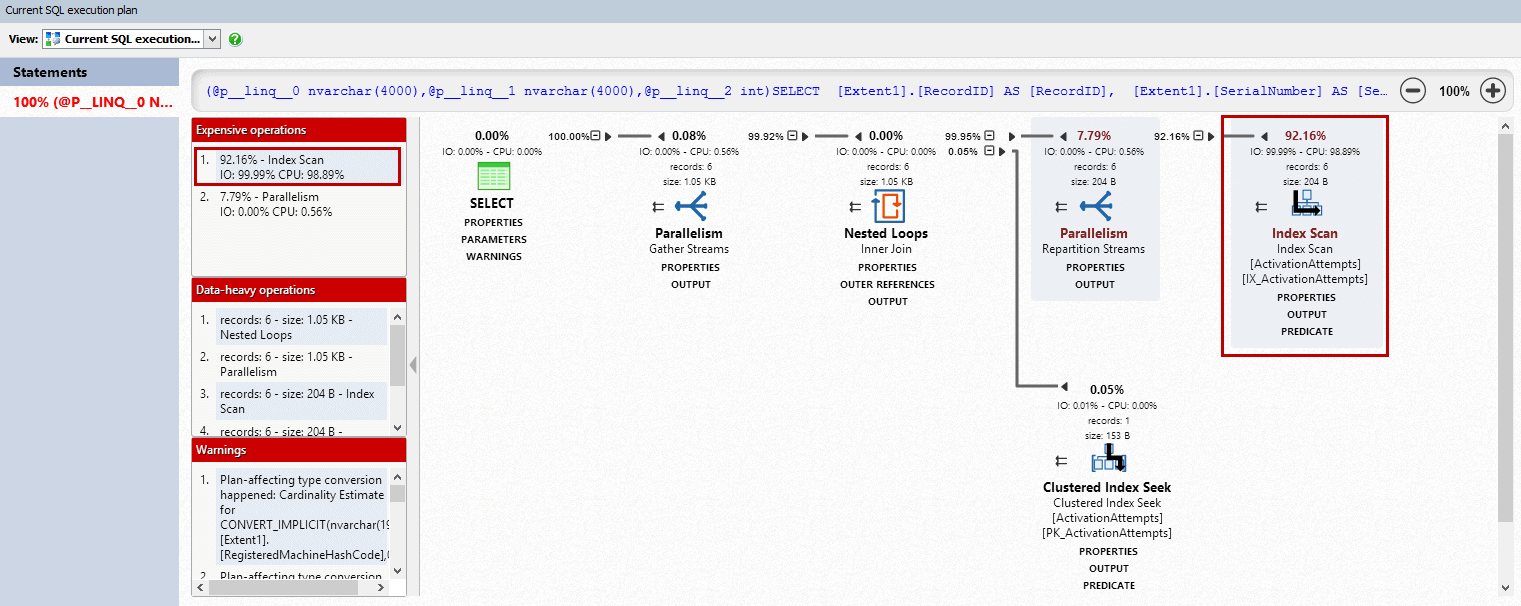
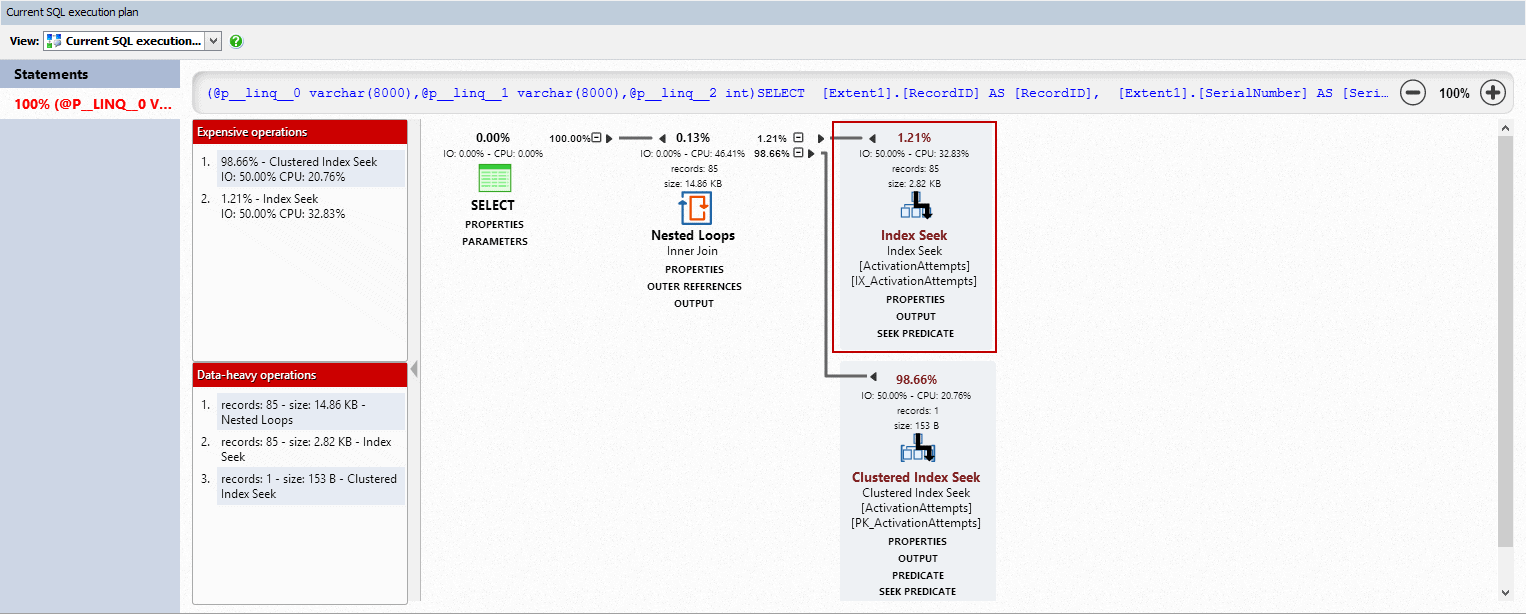
ANTS Performance Profiler 9 now supports displaying cached query execution plans for the SQL Server queries performed during the profiling session. Looking at this view pointed us in the direction of the problem.
Despite the presence of an index covering the columns used for the lookup, SQL Server was performing an index scan rather than an index seek, which the profiler identified as an expensive operation taking over 90% of the query time. An index scan requires looking at every one of the millions of rows in the table, even though only a few are returned – the kind of operation where an index seek would be far more efficient, as the index can be used to quickly identify the relevant rows, while the majority which do not match the query can be ignored.
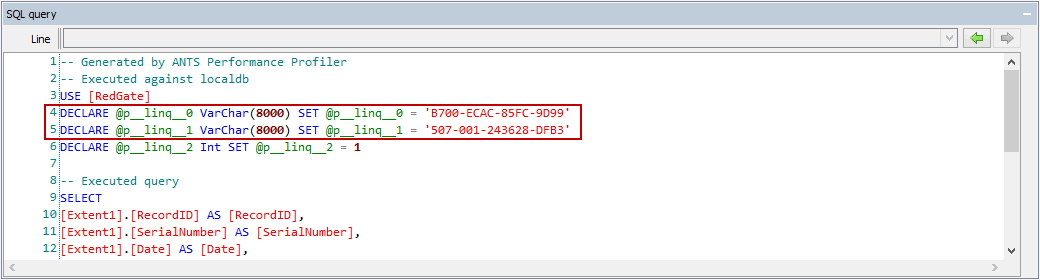
To identify the reason for this sub-optimal query, we looked at the SQL query itself.

As always, profiling helps to identify the problem, but fixing it requires integrating the information the profiler provides with an understanding of the system and its expectations and requirements. The query shows that two string parameters are being passed in as the Unicode (16-bit) nvarchar, but the database columns are actually of the non-Unicode (8-bit) string type varchar. This is also called out in the warnings in the query plan, which notes that a plan-affecting type conversion occurred.
This is caused by an omission in our Entity Framework bindings. Neglecting to specify that the columns are of type varchar has led Entity Framework to use its default string type, nvarchar (an understandable choice, given that .NET strings are Unicode). The type of the parameter must be converted to match the type of the column in order to perform the lookup, but it’s not possible to convert a Unicode string to a non-Unicode form without potentially losing data. Because of this, the only safe option left to SQL Server is to convert every non-Unicode string to a Unicode form and then to perform the comparison on a row-by-row basis.
Fixing the issue and re-checking performance
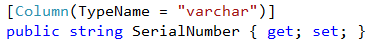
To fix this, we added the appropriate attributes to our bindings to specify the column type.
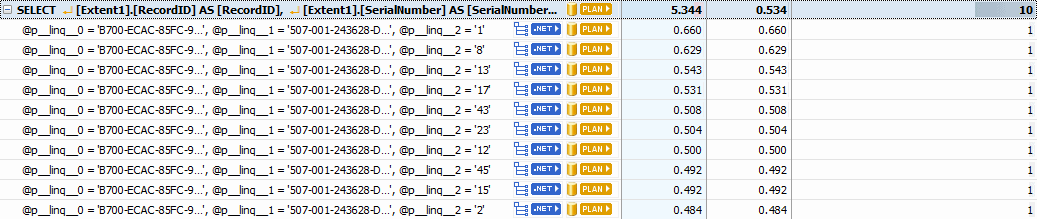
Re-profiling the deactivation process after this change confirmed that this query had sped up significantly, with each SELECT statement returning results within a millisecond.
Looking at the SQL query shows that specifying the column type as varchar did, as expected, change the type of the parameters created by Entity Framework.
The query plan also shows that the costly index scan operation has been replaced by an index seek, and that the clustered index seek which looks up the remainder of the columns in the SELECT is responsible for most of the time the query takes.
Profiling to discover performance issues in development
This analysis was a big step towards getting the performance of our new repositories back to the performance level of the LINQ to SQL code that they replaced, as we subsequently found several other places where queries could be sped up by specifying all the types of all the varchar columns. This was, however, only one class of issue surfaced by profiling our new code, and there were further gains to be made both in the code itself and its interaction with the database, and only once these were complete were we happy enough with the performance to push our refactoring to our production systems.
We hadn’t particularly anticipated performance problems when starting this work, and should ideally have made specific plans to monitor this. However, using real-world workloads (rather than near-empty test databases) was invaluable for discovering and investigating this issue. Use of a profiler (like APP 9) allowed the performance issue to be quickly isolated to a particular database query, and comparing the query plan used by the application to the expected operation helped to narrow it down further. Ultimately, it pays to fully understand what a framework is doing and how best to interact with it, especially for something as performance-critical as database access, and to confirm your expectations during development before they have a chance to become issues in production.
This document contains proprietary information and is protected by copyright law.
Copyright © 2026 Red Gate Software Limited. All rights reserved
Load comments