
We’ve just shipped another beta build of ANTS Performance Profiler 8, and it’s a big one. It adds new feature called web request profiling, which captures all web requests made by your application and displays them in the context of the code. If you’ve already used database profiling in a previous version of ANTS, this is a bit like that, except now you can examine even more aspects of your application’s data access.
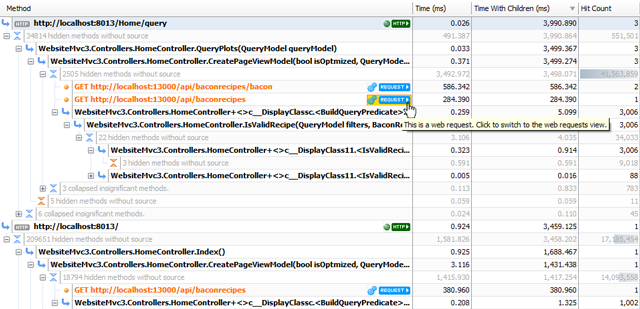
Whenever a web request is made by your application, ANTS records the url, verb, and all the request headers (except POST request data). If the request was successful (in the 2xx range), you can examine the response headers, and you can also see whether a request failed. Alternatively, you can look at a list of all the requests made, then jump from any one of them back into the application’s call tree to understand how and why that request was made.
You can download this latest beta from www.red-gate.com/labs/ants-performance-profiler. I’d really appreciate any feedback you can offer to help us make the next version even better – please email dotnetteam@red-gate.com.
Ben
Load comments