
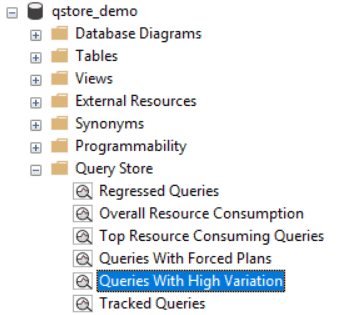
A few weeks ago I published an interesting article about how to use query store to identify parameterization problems.
At that point I hadn’t played with the new SQL Server 2017. While later, when I did, I got surprised by the new ‘Queries with High Variation’ graph included in query store. This new graph can help you identifying parameterization problems.
As I explained in the article, parameterization problems creates a high variation of the query execution. Sometimes the query runs well and very fast, sometimes the query will be very slow. Query Store keeps track of the standard deviation of the query execution and, due to the parameterization problem, the standard deviation will be high.
The new graph, ‘Queries with High Variation’, allows us to easily identify the queries with most severe parameterization problems. We can use the graph to achieve a first view of these queries and only after that get more details using the queries I explained my previous article.
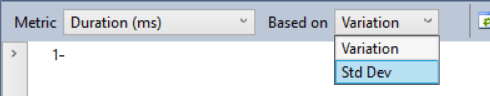
In the “Based On” box, over the graph, we have two options: Variation or Standard Deviation. The ‘Standard Deviation’ option gives a better result to illustrate parameterization problems. I suggest the use of ‘Standard Deviation’ together ‘CPU Time’ in the box ‘Metric’ to achieve better result.
Let’s do a small walkthrough to illustrate how this new graph will react to a parameterization problem.
1) The following script will create a new database. Don’t forget to correct the path of the files.
use master
go— Criando todo o ambiente
drop database if exists qstore_demoCREATE DATABASE [qstore_demo]
ON PRIMARY
( NAME = N’qs_demo’, FILENAME = N’C:\dbfiles\qs_demo.mdf’ , SIZE = 102400KB ,
MAXSIZE = 1024000KB , FILEGROWTH = 20480KB )
LOG ON
( NAME = N’qs_demo_log’, FILENAME = N’C:\dbfiles\qs_demo_log.ldf’ , SIZE = 50480KB ,
MAXSIZE = 1024000KB , FILEGROWTH = 20480KB )
GO
ALTER DATABASE [qstore_demo] SET QUERY_STORE (INTERVAL_LENGTH_MINUTES = 1)
go
ALTER DATABASE [qstore_demo] SET QUERY_STORE = OFF
GOUSE qstore_demo
GO
2) Let’s create the database objects, a table and a stored procedure
— create a table
CREATE TABLE dbo.db_store (c1 CHAR(3) NOT NULL, c2 CHAR(3) NOT NULL,
c3 SMALLINT NULL)GOCREATE NONCLUSTERED INDEX NCI_1
ON dbo.db_store (c3)GO— create a stored procedure
CREATE PROC dbo.proc_1 @par1 SMALLINT
AS
SET NOCOUNT ON
SELECT c1, c2 FROM dbo.db_store
WHERE c3 = @par1GO
3) Insert a lot of records. This will take a while to execute. Pay heed to the uneven data distribution in field c3.
SET nocount ON
goINSERT INTO [dbo].db_store
(c1,
c2,
c3)
SELECT ’18’,
‘2f’,
2go 20000
INSERT INTO [dbo].db_store
(c1,
c2)
SELECT ‘171’,
‘1ff’go 4000
INSERT INTO [dbo].db_store
(c1,
c2,
c3)
SELECT ‘172’,
‘1ff’,
0go 10
INSERT INTO [dbo].db_store
(c1,
c2,
c3)
SELECT ‘172’,
‘1ff’,
4go 15000
4) Execute the procedure. Using ‘0’ as the parameter the procedure will use the index.
EXEC dbo.Proc_1 0
go 20
5) Execute the procedure again, with a different parameter, ‘2’. This time the procedure shouldn’t use the index, but it will because the plan is already in the cache.
EXEC dbo.Proc_1 2
go 20
6) Check the ‘Queries with high variation’ graph, selecting ‘CPU Time’ and ‘Standard Deviation’ in the boxes ‘Metric’ and ‘Based On’
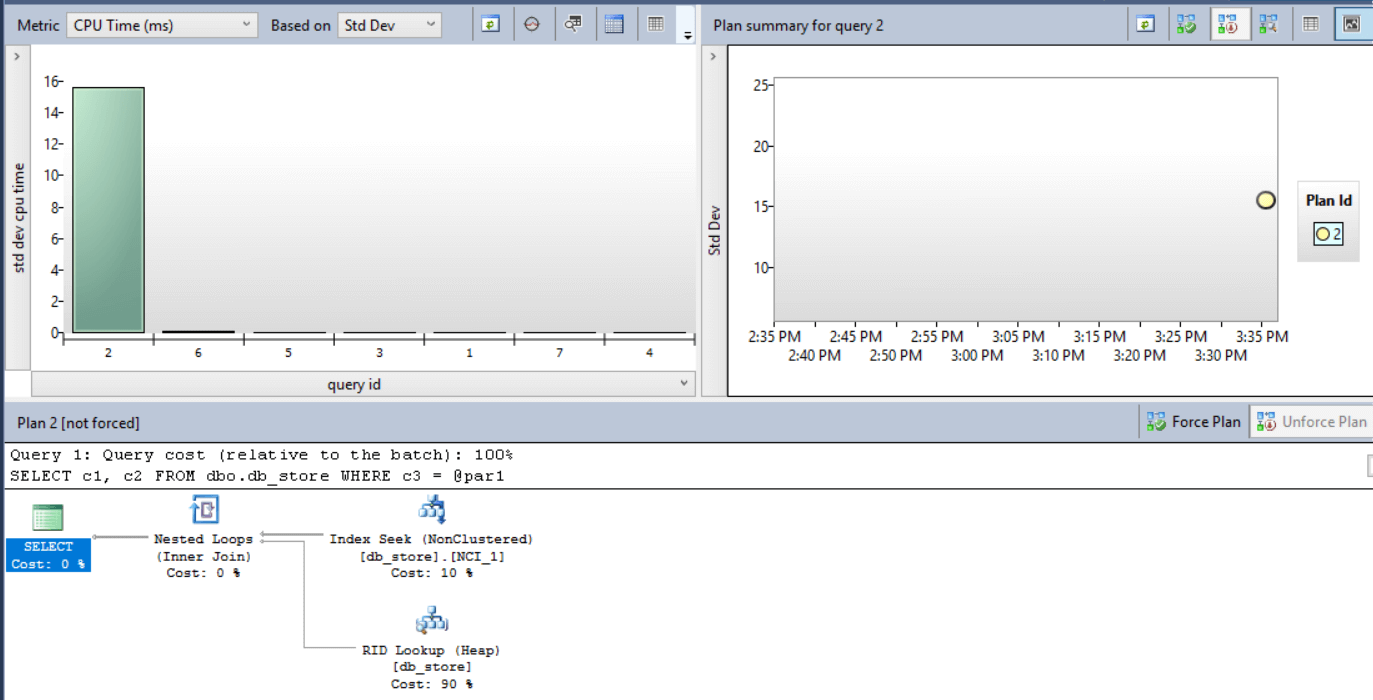
As you may notice, our query with parameterization problem has the highest standard deviation in the graph. This graph will call our attention to parameterization problems before we start the queries I explained in the previous article.
This document contains proprietary information and is protected by copyright law.
Copyright © 2026 Red Gate Software Limited. All rights reserved


Load comments